Synapse: Synthetic Application Profiler and Emulator
Abstract
We introduce Synapse motivated by the needs to estimate and emulate workload execution characteristics on high-performance and distributed heterogeneous resources. Synapse has a platform independent application profiler, and the ability to emulate profiled workloads on a variety of heterogeneous resources. Synapse is used as a proxy application (or ”representative application”) for real workloads, with the added advantage that it can be tuned in different ways and at arbitrary levels of granularity in ways that are simply not possible using real applications. Experiments show that automated profiling using Synapse represents application characteristics with high fidelity. Emulation using Synapse can reproduce the application behaviour in the original runtime environment, as well as reproducing properties when used in a different run-time environments.
I Introduction
A large body of research in high-performance and distributed computing is concerned with the design, implementation and optimization of tools, runtime systems and services in support of scientific applications. Scientific applications are sophisticated entities, with complex development, deployment and execution level requirements. Furthermore, many scientific applications have limited portability and scalability, thus restricting their direct use in the development and optimization process of tools and services.
Some constraints and challenges associated with developing tools and services can be addressed by the use of synthetic applications111also known as Application Skeletons, Representative Applications, and Artificial Applications as proxies for the original application. Synthetic applications are viable proxies only when they can capture the essential characteristics of the application being represented. Synthetic applications should use a relatively simple code base with minimal runtime requirements. They should be easy to deploy and easy to tune toward a specific use case and environment.
A tradeoff in the design and implementation of synthetic applications for use as proxy applications is the need to be simple and general purpose on the one hand, with the ability to emulate the behavior of application as accurately and as with high fidelity as possible. Achieving accuracy and high-fidelity is already difficult if emulation is needed on multiple heterogeneous resources; the task is made more difficult when those resources are different from the resource on which the application(s) was profiled.
In response to these requirements and constraints, we have designed and developed Synapse: a SYNthetic Application Profiler and Emulator. Synapse is primarily motivated by the need for automated and system-independent application profiling in computational science, where the multitude and generality of applications and platforms are the primary requirements, and not cycle-level fidelity and very high-level precision. Similarly, Synapse is designed to provide uniform profiling capabilities across a range of application types, tools and services.
Synapse acts as a simplified proxy application to circumvent the limitations and complexity of the scientific application. For example, scientific applications are not infinitely malleable, due to fixed and often discrete physical sizes of input systems. They also typically have limited tunability, as they can be modified only in discrete steps over a limited range of values. Synapse can profile an application for given parameter values, but can be tuned to emulate the same application for different parameter values.
Synapse is designed to “profile once, emulate anywhere”. Synapse determines the application’s resource consumption by running a sample based black-box profiler on the application on any machine, and then replays the observed consumption patterns on the target machine. Thus, in emulation mode, Synapse consumes precisely the same amount of resources (CPU, memory, storage, network) as the original science application, without the need to profile the application on the target machine. Additionally, Synapse is able to estimate the resources consumed, and the time-to-completion (TTC) on heterogeneous infrastructure without necessarily having access to system-level capabilities.
While synapse is precise on what resource are consumed, Synapse is less precise on exactly how those resources are consumed, i.e., in what chunkiness, granularity and order. We will discuss and verify that this tradeoff is limited by Synapse’s support for variable sample granularity and its partial sample ordering approach.
Experiments validate the fundamental requirement that Synapse’s automated profiling captures the application characteristics with fidelity. Experiments also show emulation using Synapse reproduces the application characteristics in the original runtime environment as well as for different resources and runtime systems. While not designed to achieve the same accuracy as other established approaches, experiments support the claim that Synapse’s emulation has sufficient fidelity and generality to make it a useful instrument for the development of tools and services for computational science as well as supporting computer science research.
This paper presents the initial design of Synapse and progress towards an implementation that is robust and usable. In Section II we outline three application and systems scenarios that have motivated the development of Synapse. In Section III, we discuss the design and architecture of Synapse, followed by the implementation in Section IV. Experiments are discussed in Section V followed future and related work.
II A Case for System-Independent Profiling and Emulation
The development of tools for computational science, as well as for large-scale computer science experiments need proxy applications that provide flexible and tunable capabilities as well as being portable across resource types. We outline three distinct use cases for proxy applications, each highlighting a different requirement.
Abstractions and Middleware for Distributed Computing
In spite of significant progress in scientific distributed computing over the past decade, there do not exist general purpose abstractions and middleware to support the large-scale distributed execution of applications. Although many specific solutions exist, they are customized to specific workloads and resource types. In order to alleviate this shortcomings, as part of the DOE AIMES project, we have designed the AIMES middleware for distributed execution [1]. AIMES introduces the concept of execution strategies and we have demonstrated the use of AIMES abstractions and middleware over different resource types. Initial progress was based upon using static and some what simple workloads, such as bag-of-tasks of null workloads (sleep). The challenges in generalizing the base capabilities to different workloads on different resource types is more of an implementation and deployment challenge than a conceptual challenge. A proxy application that could emulate actual workloads that would benefit from distributed execution capabilities would play an important role in the validation and extension of base AIMES abstractions and middleware. Proxy applications would have the advantage of capturing important application properties without exposing the complexity of running these applications on very distinct platforms.
High-Performance Task-Parallel Computing
Traditionally high-performance computing (HPC) systems have been optimized to support mostly monolithic workloads. The workload of many important scientific applications however, is comprised of spatially and temporally heterogeneous tasks that are often dynamically inter-related [2]. These workloads can benefit from being executed at scale on HPC resources, but a tension exists between their resource utilization requirements and the capabilities of HPC system software and HPC usage policies. In order to address this tension, we have developed RADICAL-Pilot [3], a scalable and interoperable execution framework for task-level parallelism. RADICAL-Pilot provides a runtime system designed to support a large number of concurrent tasks with low start-up overhead. It is agnostic to the specific properties of the executed tasks, viz., many-node parallelism as well as single core tasks, short running tasks versus long duration jobs. Not surprisingly, there are many components that need to be designed and parameterized in order to provide balanced performance while being agnostic (as much as possible) to task properties. For example, RADICAL-Pilot’s task execution component (the RP Agent) has to be engineered for optimal resource utilization while maintaining the full generality.
In practice, application workloads are not infinitely malleable, i.e., they can only be modified in discrete steps over a limited range of values. This often necessitates the selection of new application workloads beyond certain ranges. A proxy application could enable the design and test of RADICAL-Pilot with a single workload by providing the ability to tune “application properties” without wholesale refactoring of the workload.
Toolkits for Computational Science
Many scientific applications in the field of molecular sciences, computational biology [4], astrophysics [5], weather forecasting [6], bioinformatics [7] are increasingly reliant on ensemble-based methods to make scientific progress. Ensemble-based applications vary in the degree of coupling and dependency between the tasks, and heterogeneity across tasks. In spite of the apparent simplicity of running ensemble-based applications, the scalable and flexible execution of a large and collective set of tasks is non-trivial. As a consequence of complexity and many degrees-of-freedom, the challenges and the growing importance and pervasiveness of ensemble-based applications, we designed and implemented Ensemble-MD toolkit based upon a careful analysis of requirements of ensemble-based applications. Similar to the previous two use-cases, a proxy application would provide a lightweight and highly tunable workload so as to simplify and design Ensemble-MD toolkit for general purpose workloads. In addition, a proxy application would provide the ability to arbitrary vary the duration and number of task instances between different stages of the application, as well as change the coupling between tasks; this is an important characteristics of applications used for advanced sampling [8].
III Synapse Scope and Architecture
A finer-grained analysis of the aforementioned use cases, results in the following requirements on the profiling and emulation stages of Synapse.
III-A Requirements on Application Profiling
We state four requirements for correct profiling:
-
•
P.1 Minimal Self-Interference: the act of profiling does not influence the results of the profiling;
-
•
P.2 Low Overhead: the act of profiling does not influence the runtime behavior of the profiled application;
-
•
P.3 Black-box Approach: the act of profiling does not require any changes in application code, and minimal, non-intrusive changes in application runtime environment;
-
•
P.4 Consistency: repeated profiling of the same application, in the same environment, yields consistent results, and the results of profiling are usable to reproduce (emulate) the application’s runtime behavior;
We believe these requirements are both necessary and sufficient, given the scope and motivation of this work. We do not directly list ’quantitative correctness’ as a requirement, i.e., we do not consider it strictly necessary for profiling to measure the exact number of Bytes and FLOPs etc, but rather only require that the measured metrics are reliable and consistent, and allow truthful application emulation. Having said that, we do believe that the metrics that we will discuss in Section IV-C are relevant in the sense that they reflect executed resource level operations. Some caveats that are discussed later.
III-B Requirements on Application Emulation
Requirements for the application emulation as motivated are:
-
•
E.1 Fidelity: application emulation must exhibit the same runtime characteristics as the execution of the actual application. Amongst others, we specifically expect emulation TTC to correspond to application TTC.
-
•
E.2 Portability: the application can be emulated on resources other than the one used for profiling.
III-C Synapse Architecture
Synapse is a research prototype used in support of other research projects. As such it is subject to frequent changes in in target use cases, requested features and system to be supported. We chose an architecture which is modular for both the profiling as the emulation part of Synapse, but is otherwise thin and lightweight. The implementation in Python caters toward portability and usability, with some caveats which are discussed in the implementation description in Section IV.
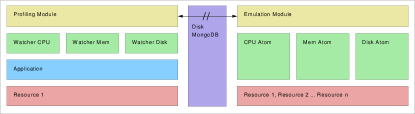
Figure 1 shows the resulting Synapse architecture. The modularity of the Synapse profiling is provided by extensible and exchangeable Watcher plugins which profile for a very specific resource type; the counterpart on the Synapse emulation are pluggable emulation Atoms which can emulate the consumption of the same resource types as profiled by the Watchers. Profiles are stored in local json files, but alternatively Synapse can employ a MongoDB database for storing collected profiles, and also for retrieving profiles for later emulation runs.
IV Implementation of Synapse
Synapse is implemented as a Python module222Some well contained parts of synapse are written in C and assembly, as discussed later on. that primarily provides two methods:
radical.synapse.profile(command, tags=None) radical.synapse.emulate(command, tags=None)
where command is either a shell command line or a Python callable (which is then spawned in its own Python shell).
The profile method profiles the specified command and stores the result in a MongoDB database, which is indexed by command itself and by an optional set of user supplied tags. Repeated profile runs of the same command/tag combination will let Synapse collect multiple profiles for statistical analysis, to estimate means and standard deviation of resource consumption metrics. The tags are used to differentiate application instances that are not distinguishable by their command line alone, but that are expected to result in different execution profiles. For example, tags can be used to flag different semantic content of application control and configuration files, or to distinguish between different application configurations.
The emulate method utilizes a set of emulation atoms, which are very fine grained and tunable software elements which consume one specific type of resource. Synapse uses the command and tag combination specified on the emulate call to search the database for any available profile. Once a profile is found, Synapse will retrieve the set of profile samples and will feed them to the emulation atoms in the order in which they have been collected. That sample ordering is an essential element for the fidelity of the emulation, as will be discussed in detail in Section IV-D. Some very light-weight profiling is also applied during Synapse’s own emulation run, to verify that the resources are consumed as expected.
Synapse also provides a set of command line tools which are essentially wrappers around certain configurations and combinations of the profile and emulate module calls.
IV-A Implementation of Synapse Profiling
The Synapse profiler relies on several system utilities. Amongst others, it uses the perf-stat utility to inspect CPU activity, the /proc/ filesystem to read system counters on memory and disk I/O, and the POSIX rusage call to obtain runtime process information.
The different information providers are implemented as plugins, Synapse is thus extensible with additional profiling metrics (see discussion of future work in Section VI). Those plugins are structured as follows:
class WatcherClass(rsw.WatcherBase): def __init__(self, pid): ... def _pre_process(self, config): ... def _sample(self): ... def _post_process(self): ... def _finalize(self): ...
Pre- and Post-Process set up and tear down any profiling environment for that watcher. The _sample method is invoked at regular intervals by the main Synapse profiling loop. In the _finalize method, the plugin has access to the raw profiling results of other watchers, in order to perform some further post processing. While this creates some dependencies between plugins, it prevents the duplication of measurements (such as overall runtime).
Each watcher plugin runs in its own thread:
def run(self): self._pre_process(self._config) while not self._terminate.is_set(): now = timestamp() self._sample(now) time.sleep(self._sample_rate) self._post_process()
Once Synapse spawns the application process, it communicates the process PID to the watcher threads, and they begin monitoring the process. There is a small delay between process spawning and start of profiling but the process itself is wrapped into the POSIX tool time -v, which allows us to correct some of the effects of that offset333Other effects are found to be too small to matter. The first watcher sample is usually collected at around seconds after startup..
Profile data are collected as time series. The timestamps of the different watchers are not synchronized, and can drift relative to each other over time. We found this preferable to an increased profiling overhead due to synchronization. The individual time series are combined during postprocessing and pushed into a MongoDB, or are written to disk.
The sample rate is globally controlled via an environment variable, and is uniform over all watchers. The highest sample rate is , i.e., Synapse can at most gather one sample every . That limit coincides with the limit of perf stat. There is no lower bound to the sampling rate. Section V discusses the impact of different sampling rates on profiling overhead, profiling accuracy, and emulation fidelity.
IV-B Implementation of Synapse Emulation
At its core, the Synapse emulation framework consists of a set of small, self-contained C-codes (Synapse Atoms) that consume one specific resources type. Currently, compute, memory, storage and network atoms have been implemented.
The compute atom contains a loop of assembly code that efficiently performs a matrix multiplication. The loop’s efficiency represents the maximum efficiency Synapse can emulate, which seems on par with the various application codes we have profiled so far. The efficiency of the assembly loop can be artificially lowered toward the target emulation efficiency by reducing the loop invocation frequency. In all cases we make sure that the matrix size is small enough to fit fully into the CPU caches.
The memory and storage atoms are relatively simple C codes that perform the respective canonical libc operations (malloc, free, read and write). Those operations use buffer sizes that can be tuned, but are ultimately independent of the buffer sizes used in the actual application. This introduces potential discrepancies compared to the emulated application, since system performance directly depends on the buffer size of I/O operations. Our assumption is that application codes are generally aware of this, and attempt to use large block sizes where possible, and that small reads/writes are dominantly served by disk caches, and have thus relatively small impact on the overall performance. In Section V we support that assumption with experiments, but acknowledge that it is likely to break (to a varying degree) for certain types of applications that are bound by specific I/O patterns.
The Synapse profiler features an experimental watcher plugin that can, in principle, infer block sizes of disk I/O operations with blktrace. We consider using this data in Synapse emulation when applications require that granularity to be future work (see Section VI).
The Synapse emulation atoms are driven by a global loop which feeds sequences of profile samples to the atoms for emulation. The sample granularity is the same as used for profiling: the profiling sampling rate thus not only determines the accuracy of the profiling itself, but also influences the emulation fidelity. All atoms run in separate processes; resources are thus utilized concurrently. That may or may not reflect what the application code implements. While the profiler does gather information about the number of used application threads and processes, that information at the moment is not used in the Synapse emulation phase.
IV-C Profiling Metrics
Three main types of resources are currently profiled: compute (CPU), storage (disk), and memory. Synapse measures several metrics for each of those, as listed in Table I. Additionally, Synapse records several types of system information, such as number and type of CPU cores, available memory, and system load. Some of those are used to compute derived metrics, for example, the CPU type and clock speed determines the maximum number of operations per second, which when combined with the observed number of used and stalled instructions cycles yields CPU efficiency and utilization.
Synapse is able to force an artificial CPU, disk and memory load onto the system while emulating an application, thus emulating the application execution in a stressed environment. We do not currently measure the disk and memory stress on the system, so these load factors have to be specified manually, and are currently used to confirm Synapse’s viability on stressed systems. Artificial load has not been used in the experiments presented in this paper, and is thus not discussed any further.
Several listed metrics, such as CPU efficiency and utilization, are marked as derived: they are not directly reported by the system, but are calculated from other, primary metrics. We use the following formula to compute CPU efficiency:
We interpret the ’cycles’ reported by perf stat as , and ’cycles_stalled_frontend’ + ’cycles_stalled_backend’ as , the latter in the sense that they are counted toward the application execution, but did not contribute to its progression. This is not a canonical definition for CPU efficiency, because the wasted cycles can potentially be counted twice (once for frontend and once for backend), or can overlap with used cycles (the backend can be busy while the frontend stalls). However, the metric makes semantic sense in that it considers used cycles to contribute to higher efficiency, and any stalling to lower efficiency, which reflects the intuitive interpretation of those values in terms of code efficiency.
Similarly, we compute CPU utilization as:
where is derived from the maximum possible number of cycles, which is determined by the CPU architecture and clock speed. Synapse does not sample the CPU clock speed (modern CPUs can adapt clock speed to load to preserve energy), and we do not take any background CPU activity (by the system or other applications) into account. The derived utilization is still a useful metric to interpret in that it exposes the expected monotonic behavior toward faster/slower execution, but it is not comparable to similar metrics derived by other software.
| Resource | Metric | Tot. | Samp. | Der. | Emul. |
| System | number of cores | + | - | - | - |
| max CPU frequency | + | - | - | - | |
| total memory | + | - | - | - | |
| runtime | + | + | - | - | |
| system load (CPU) | + | - | - | + | |
| system load (disk) | - | - | - | + | |
| system load (memory) | - | - | - | + | |
| Compute | CPU instructions | + | + | - | + |
| cycles used | + | + | - | - | |
| cycles stalled backend | + | + | - | - | |
| cycles stalled frontend | + | + | - | - | |
| efficiency | + | + | + | (+) | |
| utilization | + | + | + | - | |
| FLOPs | + | + | + | - | |
| FLOP/s | + | + | + | - | |
| threads | + | - | - | + | |
| Storage | bytes read | + | + | - | + |
| bytes written | + | + | - | + | |
| block size read | - | (-) | - | (-) | |
| block size write | - | (-) | - | (-) | |
| Memory | bytes peak | + | + | - | - |
| bytes resident size | + | + | - | - | |
| bytes allocated | + | + | + | + | |
| bytes freed | + | + | + | + | |
| block size alloc | - | (-) | - | (-) | |
| block size free | - | (-) | - | (-) | |
| Network | connection endpoint | (-) | (-) | - | (+) |
| bytes read | (-) | (-) | - | (+) | |
| bytes written | (-) | (-) | - | (+) | |
| block size read | - | (-) | - | (-) | |
| block size write | - | (-) | - | (-) |
Sampl.: sampled over time; Der.: derived from other metrics;
Tot.: integrated total over runtime; Emul.: used in emulation;
(+): partial; (-): planned.
Table I includes several metrics that are currently planned or only partially implemented. Specifically, it lists network interactions, which Synapse can to some extent emulate, but which are not yet meaningfully profiled. CPU efficiency is listed as ‘partially supported’ for emulation: Synapse is able to tune the CPU load toward a certain efficiency value, but that tuning is currently manual (the experiments presented in the paper use the default values for all tunable settings).
IV-D The Effects of Sampling
The effects of sampling are illustrated in Figure 2. Profiling metrics are gathered at (roughly) equidistant points in time, for different types of resources. Emulation follows the same clustering, but disregards all timing information. It is after all not the purpose of emulation to reproduce the exact same timings, but to consume the exact same resources. We will discuss several detail of this figure below.
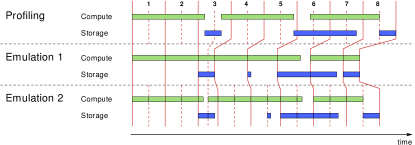
Figure 2 illustrates that profiled resource consumptions may or may not fill a complete sampling period. Where one specific resource interaction dominates overall application performance for that sample, one can expect that that type does fill a sampling period (e.g., samples 1 & 6). In the general case, a sampling period will capture several full or partial resource consumption types which may or may not occur concurrently.
What resource consumption operation is accounted for in what sample depends on a multitude of parameters: applications will often employ techniques to hide I/O latency, such as caching or asynchronous operations, and the operating system itself uses latency hiding (caches, read-ahead, branch prediction etc). In those cases, actual system activity can occur before or after the application code requests it.
During Synapse’s emulation, all resource consumptions for a specific sample are started immediately and concurrently upon starting that sample, without any ordering in between resource types. Emulation samples end when the last resource consumptions is completed for that sample, and then the emulation for the next sample is started (see samples 3 & 4 in Figure 2). Resource consumptions that are not concurrent in the application are concurrent in the emulation (see samples 3 and 8), thus yielding potential emulation speedup. Smaller samples reduces that effect (see Emulation 2 in the figure, alternative samples 3 & 8).
In many cases, one type of resource consumption is a semantic requirement for another type. For example, an application needs to read data from a disk before being able to compute on those data; it needs to allocate memory before reading data from disk into that memory; it needs to perform computation before being able to write results to a disk; etc. The code-agnostic sampling approach used by Synapse does not allow to directly detect such dependencies – parts of those dependency information are, however, implicitly captured: operations observed in a sample at time can only depend on resource consumption at samples from or earlier. By ensuring that the emulation respects sampling order across resource types, Synapse will implicitly play back the dependencies thus captured.

Synapse profile samples are designed to be portable, i.e., they can be used to emulate the application on resources other than the profiling resource. Figure 3 illustrates that the implicit dependencies captured in the sampling order preserves the order of the original application activities even on machines with very different performance characteristics, reflecting that the dominating contribution to the application’s TTC can differ per machine. In the figure, we see that the emulation is performed on a machine with faster CPU, but slower disk. While sample 7 on the originally profile machine is, for example, dominated by the application’s CPU utilization, the same sample is storage I/O dominated during emulation.
IV-E Scope and Limitations
Sections I and II motivated the scope for which Synapse was defined. This subsection makes this scope more specific; we list the set of conditions under which Synapse is expected to operate, or under which it is not.
IV-E1 Application Semantics
Synapse watches application behavior – it explicitly does not inspect the application at the code or system call level, and thus has no knowledge whatsoever of application semantics. This limits the applicability of Synapse in some contexts. For example, the POSIX system call sleep(3) will consume a very small number of flops, but will show significant contributions to TTC. An inspection on different layers (code, libc call, OS signals etc.) could reveal that behavior, but that is considered out of scope for Synapse.
IV-E2 Resource Details
A side effect of not inspecting the application on code or system call level is that Synapse does not distinguish which exact system resource is used: for example, it finds that the application wrote a certain number of bytes to disk, but does not infer what file system the data have been written to (we currently assume that all I/O operations go to /tmp/). That can though significantly impact application performance, specifically for HPC resources that often feature shared file systems.We consider the use of blktrace for I/O profiling on the level of individual block device operations.
IV-E3 Application Granularity
A similar side effect of external, sampled measurements is that application activities are not resolved beyond a certain granularity. For example, Synapse can measure the number of bytes written to disk in a certain period of time, but actual I/O performance can vary significantly depending on how exactly those I/O operations are executed: a large number of small, scattered I/O operations will often be much slower than a small number of large I/O operations. Synapse does not distinguish those cases: it assumes a static block size for the emulation of I/O (that block size can be manually tuned, but was left at the default value for the experiments in this paper).
IV-E4 Application Optimization
Different resources may provide different means to optimize application codes, via compiler flags, optimized system libraries, specific hardware etc. Synapse’s profiling on one system cannot take optimization on another system into account, when those optimizations map to different resource consumption patterns, such as GPU acceleration which is available on the target host but was not used on the profiling host. Profile portability is thus limited to resources with fundamentally similar architectures. The experiments in this paper were done with application code that was compiled with default settings for each resource, and that uses optimized system libraries where available.
IV-E5 Multithreading
Application performance varies significantly with the number of threads employed to perform the necessary operations. While Synapse does record the number of application threads, it does not distinguish what operation originates in what thread, nor does it use that information during emulation (all emulation is multi-processed). The sampling based approach provides some mitigation to this, as it infers dependencies between data and compute operations, as discussed in Section IV. That inference can be wrong though, and the recorded order of events can be a coincidence. In that case, the sampling based emulation will introduce too many synchronizations, and emulation will be slower than the actual application. This specifically can happen for target resources where resource types have very different performance (e.g., a much faster disks). Whenever an application is bound by a single resource type, that reordering effect will not apply.
IV-E6 Multiprocessing
Synapse’s profiling is process based – it targets single-process applications. Synapse does not attempt to detect the spawning of additional application processes. This could in principle be added (/proc/ contains the required information), but support is not planned at this point.
IV-E7 IPC
Synapse will not detect interprocess communication, neither between processes within the same OS, nor any communication over the network. Specifically it is not able to handle application level threading locks, semaphore locks, etc. We plan to at least add profiling of MPI communication at some point (see Section VI on future work), most likely by utilizing one of the many existing MPI profilers.
IV-E8 Overhead
The processes of profiling and emulation consume certain amounts of resources. Synapse manages though to keep those overheads very small (see experiments in Section V). The profiler’s startup-time is constant and in the order of seconds. Concurrent to the application, the profiler consumes a part of another CPU core (if available), and about 150 MB of memory. A very high sampling rate can increase the overall memory footprint. Writing the data to the database requires some time, depending on network latency and total number of samples. Synapse emulation has a similar overhead (fetching the samples from the DB into memory, a loop that feeds the Synapse atoms).
The emulation additionally shows some memory overhead. This is partially owed to the fact that multiple python instances are spawned, and Python is often more memory heavy than the (compiled) application codes under investigation. That memory overhead though is not large enough to significantly influence the measured TTCs, but it does show up in the profiles of emulation runs.
Profiling will only terminate when full sample periods have passed, which can thus delay the completion of the profiling process to up to one additional sampling period. That is only relevant for very low sampling rates.
IV-E9 DB limitations
MongoDB has a 16 MB limit on the size of a single document. This limits the total number of data samples Synapse supports to about 250,000. This limitation can be lifted by changing to a different data model or storage backend. File based storage of profiles is available.
V Experimental Results and Discussion
Our experiments are designed to investigate the viability of Synapse’s approach as a tool that, (i) automatically derives application profiles, and (ii) implements synthetic application components which can emulate the profiled applications. The experiments demonstrate the fidelity of Synapse’s profiling and emulation for a specific scientific application under a range of conditions, on a range of resources. Experiments are designed to support the requirements listed in Sections III-A and III-B and cover the following steps:
-
•
Use Synapse to profile an application over a range of application parameters, with different sampling rates.
Purpose: determine the profiling overhead versus non-profiled execution (experiment 1: P.1/P.2); show how the consistency of profiling results depends on sampling rate (experiment 2: P.3).
-
•
Use Synapse to emulate the same application over the same range of application parameters, measuring TTC.
Purpose: show the fidelity of the profiling results to capture relevant application characteristics; determine emulation precision in computing application TTC compared to actual execution (experiment 3: P.4, E.1).
-
•
Use Synapse to emulate the same application on different resources, measuring TTC.
Purpose: support the claim that Synapse profiling metrics are system independent; determine emulation precision in computing application TTC, on resources that are distinct from those used for profiling (experiment 4: P.4, E.2).
The application used for all experiments is Gromacs [9]. It is an application used for Molecular Dynamics (MD) simulations, in particular for biomolecular simulations. Gromacs is used by thousands of scientists, including multiple collaborators of the authors.
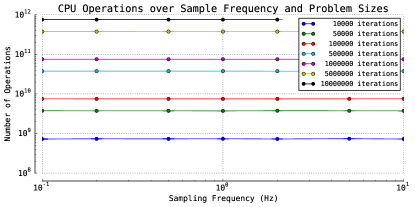
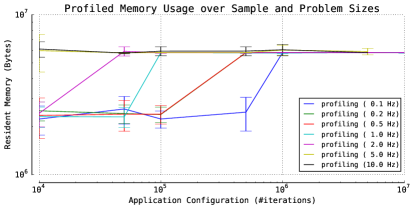
We configured applications with a varying number of iteration steps, ranging from to . The number of steps influences both CPU consumption and disk output, but leaves disk input and memory consumption constant.
Due to space constraints, we do not present other experiments, but note that variations in other parameters also yield variations in the application’s resource consumptions, which can also be captured by Synapse profiling and represented by Synapse emulation. Ultimately, Synapse will not care what parameter changes cause the variation, as the application execution is considered a black box, and the parameter variations are not visible to Synapse.
A subset of tests have been performed with larger numbers of iterations (up to ), which confirmed the stability of results over that range. Due to resource time limitations, we limit the results presented here to the range mentioned.
Experiment Platform:
All profiling is performed on an off-the-shelf Intel Core i7 CPU (M620) with 4 cores, 8GB memory, Intel SSD 140GB (320-Series) under a Debian Linux with X86_64 kernel v3.11.8-1. Emulation experiments are performed on the same host, as well as on HPC resources, viz., Stampede, at the Texas Advanced Computing Center (TACC) [10], and on Archer, a Cray at EPCC [11].
Stampede’s compute nodes feature two 8-core Intel Xeon E5-2680 (Sandy Bridge) processors and an Intel Xeon Phi SE10P Coprocessor. The aggregate peak performance of the Xeon E5 processors is 2+PF – we do not use the coprocessors in our experiments. Each node has 32GB main memory, and a local 250GB HDD. All I/O performed in our experiments is on that local hard drive.
Archer is a Cray XC30 with two 12-core E5-2697 v2 (Ivy Bridge) series processors and 64GB main memory per node. On Archer we also perform all disk I/O to /tmp, i.e. to a local hard drive.
The data sets produced and used in the experiments as presented below are freely available, as is the Synapse software itself; see the Software Availability paragraph.
Experiment 1 – Profiling Self-Inference and Overhead
Figure 4 compares the TTC for two cases: pure application runs, and the execution of the application on the same resource under the Synapse profiler. That measurement is shown for different application configurations (application runtimes) and different sampling rates. The graph shows that the profiling overhead is negligible and remains so for the investigated range of problem sizes and sampling rates.

Experiment 2 – Profiling Consistency
We repeated profiling of the same application instances in the same environment. While the non-zero standard deviation indicates some noise in the measured metrics, the distribution is in very good agreement with the distribution of the pure application TTC (see Figures 5 and 6), which indicates the influence of system background. The figure shows the profiling consistency over a range of application sizes and sampling rates.
Experiment 3 – Profiling as Emulation Input
The ultimate purpose of Synapse’s profiling is to feed Synapse’s emulation. Figure 7 compares the TTC of pure application execution versus emulated application runs, on the very same machine used for application profiling. The graphs show that emulation tends to incur an overhead, specifically at startup time, which quickly becomes insignificant for applications running longer than a few seconds.
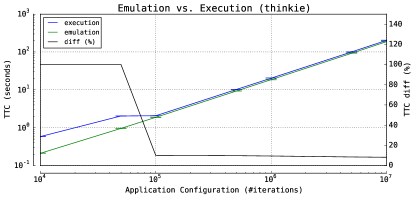
As a self-check, we run the emulated application again under the profiler, and compared the reported resource consumptions: the values are in excellent agreement for any application instance running longer than a few seconds, as long as the sample rate is fast enough to result in at least two samples. There exist some small deviations due to the memory footprint of the emulation driver (Python, C threads), but no other discernible difference.
Experiment 4 – Profiling as Portable Emulation Input
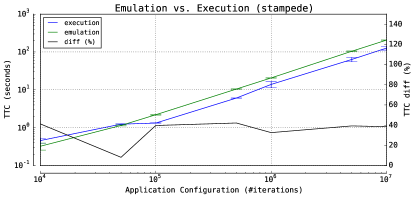
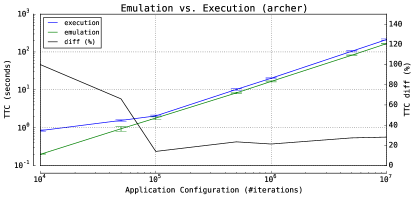
Figures 8 and 9 compare application execution and application emulation on resources different than the one used for application profiling, specifically on Stampede and Archer, respectively. Again the TTCs for application execution and emulation resemble the application characteristics over a range of application sizes and sampling rates.
The plots again show that the emulation overhead is significant for small application sizes, i.e., for application runtimes of about a second or smaller. We find that acceptable, as our research focus lies on much longer living applications, and we assume that sub-second application runs will remain the exception in both high-throughput and high-performance distributed computing.
VI Future Work
Sampling Rate
A high sampling rate has been shown to be able to capture application startup more accurately, and is necessary to handle short-running jobs. At the same time, a high sampling rate incurs some emulation overhead.
We will consider switching to an adaptive scheme which starts with a high sampling rate (10/sec), and after a few seconds, when we can expect to have captured the application startup, decrease the rate. Synapse’s code base does not assume a constant rate, but neither does it implement any sampling rate adaptation, yet.
Networking, MPI
The most significant, but also most challenging next development step is the support for network profiling and emulation. We consider it essential to capture the connectivity endpoints, and to attempt to perform actual data exchange to the remote network components, where possible. That requires, however, changes to our current profiling approach, as a sample-based inspection seems insufficient to capture that information. We consider to use libc call tracing for that purpose.
A similar route seems useful to support the profiling and emulation of MPI and OpenMP applications. A wide variety of MPI and OpenMP tracing tools and libraries exists, which we intent to investigate.
Block-Level I/O Operations
The performance of disk I/O operations depends heavily on the storage system that is used, and on the granularity of the I/O requests toward that storage system. Synapse currently captures neither of those, but we plan to use blktrace to obtain those information. A prototype watcher plugin for blktrace exists.
Resource Specificity
The experiments showed that Synapse application profiles are portable for emulation on other resources. However, that is only valid when the application codes on the target resources are compiled with similar optimizations and against similar low-level numerical libraries.
We plan to investigate the optional introduction of an application-specific scaling factor that takes those differences into account. Such a scaling factor could be determined via well defined probes that gauge the application performance toward a specific resource or resource configuration. However, we expect the problem to persist in general, as it is unlikely that all configuration options can be determined automatically, or that any sample-based gauging will be representative for an application. At the same time, the simplicity and resource-independence of Synapse is expected to remain an important design objective, even if that limits its emulation fidelity to some extent.
VII Related Work
PAPI [12] is widely used in the HPC community. PAPI’s sample based evaluation of hardware counters is conceptually similar to Synapse profiling. The simpler version in Synapse is based on standard Linux system utilities, motivated by the use of resources where PAPI was not available and where we lacked permissions to install it. Also, using perf and other Linux tools integrated better with elements of Synapse profiling, such as disk I/O or memory allocation, which are not covered by PAPI. There will likely be convergence with PAPI for some of Synapse’s profiling needs, so as to make the Synapse profiling more portable and easier to maintain.
We are aware of only a few efforts to combine non-intrusive application profiling with application emulation. In [13], the authors describe an approach to automatically derive application characteristics. It focuses on tracing the application’s communication calls, including MPI calls. Other resource interactions are considered opaque and measured as times, and are thus system dependent. This approach works well for communication bound applications. The emulation represents a subset of the application: total application TTCs are extrapolated under the assumption that the subset is representative.
In [14] Katz et al. work on a complementary approach of Application Skeletons. Skeletons do not include any mechanisms for automatic application profiling, and thus require the user to specify resource consumptions manually. The focus of Skeletons is primarily on the representation of logical and data dependencies between individual application components: Application Skeletons can be used to represent a DAG of such components. Ref. [14] discusses how Synapse can be used to complement Application Skeletons, in that it provides configuration parameters at the level of individual DAG components.
Note that a large body of work on the simulation of application execution exists, which aims to predict application runtimes (and other metrics) based on certain models of resources and runtime environments. Synapse is not predictive, and thus does not relate to simulation approaches.
VIII Conclusions
Synapse is capable of automatically deriving application characteristics, and of configuring representative application emulation, for single threaded, scalar applications. While the application used to validate Synapse (Gromacs) is representative of many other applications used in computational science, it remains to be seen if this approach can suitably extend toward applications with multiple threads or processes.
The profiling capability of Synapse has a low runtime overhead, and provides stable, consistent results. It requires no human intervention code instrumentation, or exchange of libraries, and is fully transparent to the application. It does however, need support at the system level and is constrained to resources where perf stat can be executed by users. We believe this not to be an issue in practice.
The emulation capabilities of Synapse provide a relatively accurate representation of the application’s behavior within constraints. The main contribution to emulation uncertainties arise in resource specific compile time optimizations of the application codes, which are not covered when applying application profiles across resources. Nevertheless, Synapse’s emulation manages to capture the overall application characteristics and important trends that determine TTC. When used on the same host as where profiling occurred, Synapse provides high-fidelity emulation. Given the simplicity and low overhead of usage we believe this will provide a useful contribution to the computational science community. In fact, Synapse is used a proxy application for each of the three use cases discussed in Section 2.
Software Availability
Synapse is available as Open Source Software, under the LGPL license, at [15]. The experiments in this paper used version v0.10. All scripts and configurations, along with the raw data sets and scripts for plotting, are available at [16]. Please refer to the README.md file for instructions on how to reproduce the experiments. Comments, feedback, and contributions to the software are welcome. A bugtracker (which can also be used for feedback) is available at [17]. When using this software, please reference [18].
Acknowledgements
This work is supported by NSF “CAREER” ACI-1253644, NSF ACI-1440677 “RADICAL-Cybertools” and DOE Award DE-SC0008651. We acknowledge access to computational facilities on XSEDE resources via TG-MCB090174. We thank members of the RADICAL group, in particular Matteo Turilli for helpful discussions, suggestions & testing, and Vivek Balasubramanian and Mark Santcroos for testing. We also thank Daniel S. Katz (U. Chicago) for useful discussions in the context of Skeletons and for improvements to the paper.
References
- [1] M. Turilli, F. F. Liu, Z. Zhang, A. Merzky, M. Wilde, J. Weissman, D. S. Katz, and S. Jha, “Integrating Abstractions to Enhance the Execution of Distributed Applications,” in Proceedings of 30th IEEE International Parallel and Distributed Processing Symposium (IPDPS), 2016, http://arxiv.org/abs/1504.04720.
- [2] L. R. Jay Srinivasan, Richard Shane Canon. My Cray can do that? Supporting Diverse Workloads on the Cray XE-6. https://cug.org/proceedings/attendee_program_cug2012/includes/files/p ap157.pdf.
- [3] A. Merzky, M. Santcroos, M. Turilli, and S. Jha, “RADICAL-Pilot: Scalable Execution of Heterogeneous and Dynamic Workloads on Supercomputers,” 2015, (under review) http://arxiv.org/abs/1512.08194.
- [4] J. Preto and C. Clementi, “Fast recovery of free energy landscapes via diffusion-map-directed molecular dynamics,” Physical Chemistry Chemical Physics, vol. 16, no. 36, pp. 19 181–19 191, 2014.
- [5] E. Sirko, “Initial conditions to cosmological n-body simulations, or, how to run an ensemble of simulations,” The Astrophysical Journal, vol. 634, no. 2, p. 728, 2005.
- [6] P. Bauer, A. Thorpe, and G. Brunet, “The quiet revolution of numerical weather prediction,” Nature, vol. 525, no. 7567, pp. 47–55, 2015.
- [7] J. Martin, V. M. Bruno, Z. Fang, X. Meng, M. Blow, T. Zhang, G. Sherlock, M. Snyder, and Z. Wang, “Rnnotator: an automated de novo transcriptome assembly pipeline from stranded rna-seq reads,” BMC genomics, vol. 11, no. 1, p. 663, 2010.
- [8] https://github.com/radical-experiments/enmd-pattern-testing.
- [9] S. Pronk, S. Páll, R. Schulz, P. Larsson, P. Bjelkmar, R. Apostolov, M. R. Shirts, J. C. Smith, P. M. Kasson, D. van der Spoel et al., “GROMACS 4.5: a High-Throughput and Highly Parallel Open Source Molecular Simulation Toolkit,” Bioinformatics, 2013.
-
[10]
STAMPEDE: Texas Advanced Computing Center,
https://www.tacc.utexas.edu/stampede/. -
[11]
ARCHER: Advanced Research Computing High End Resource,
http://www.archer.ac.uk/. - [12] P. Mucci, J. Dongarra, R. Kufrin, S. Moore, F. Song, and F. Wolf, “Automating the Large-Scale Collection and Analysis of Performance,” in In Proceedings of the 5th LCI International Conference on Linux Clusters: The HPC Revolution, Austin, Texas, May, 18-20 2004.
- [13] S. Sodhi and J. Subhlok, “Skeleton based Performance Prediction on Shared Networks,” in IEEE International Symposium on Cluster Computing and the Grid, 2004. CCGrid 2004. IEEE, 2004, pp. 723–730.
- [14] D. S. Katz, A. Merzky, Z. Zhang, and S. Jha, “Application skeletons: Construction and use in eScience,” Future Generation Computer Systems, 2015, http://dx.doi.org/10.1016/j.future.2015.10.001. [Online]. Available: http://www.sciencedirect.com/science/article/pii/S0167739X15003143
-
[15]
A. Merzky, “RADICAL-Synapse Repository,”
http://github.com/radical-cybertools/radical.synapse/. -
[16]
——, “RADICAL-Synapse Experiments: Scripts and Data Sets,”
http://github.com/radical-cybertools/radical.synapse.experiments/. -
[17]
“RADICAL-Synapse Bugtracker,”
http://github.com/radical-cybertools/radical.synapse/issues/. -
[18]
A. Merzky, “RADICAL-Synapse v0.10,” May 2015,
http://dx.doi.org/10.5281/zenodo.17874.