The Variation of Rotation Curve Shapes as a Signature of the Effects of Baryons on Dark Matter Density Profiles
Abstract
Rotation curves of galaxies show a wide range of shapes, which can be paramaterized as scatter in Vrot(1kpc)/Vmax i.e. the ratio of the rotation velocity measured at 1 kpc and the maximum measured rotation velocity. We examine whether the observed scatter can be accounted for by combining scatters in disc scale-lengths, the concentration-halo mass relation, and the M⋆-Mhalo relation. We use these scatters to create model galaxy populations; when housed within dark matter halos that have universal, NFW density profiles, the model does not match the lowest observed values of Vrot(1kpc)/Vmax and has too little scatter in Vrot(1kpc)/Vmax compared to observations. By contrast, a model using a mass dependent dark matter profile, where the inner slope is determined by the ratio of M⋆/Mhalo, produces galaxies with low values of Vrot(1kpc)/Vmax and a much larger scatter, both in agreement with observation. We conclude that the large observed scatter in Vrot(1kpc)/Vmax favours density profiles that are significantly affected by baryonic processes. Alternative dark matter core formation models such as SIDM may also account for the observed variation in rotation curve shapes, but these observations may provide important constraints in terms of core sizes, and whether they vary with halo mass and/or merger history.
keywords:
methods: galaxies: formation - haloes1 Introduction
The rotation curves of disc galaxies are diverse (e.g. Zwaan et al., 1995; Swaters et al., 2009); even galaxies with similar velocities at the flat part of the rotation curve can have significantly different rotation velocities at small radii. This results in a large scatter in rotation velocity at small radii, when plotted as a function of Vmax (Oman et al. 2015 who measure Vrot at 2 kpc).
It is well documented that a population of galaxies have slowly rising rotation curves, meaning a low value of Vrot(1kpc) compared to Vmax. Such galaxies are presented as evidence for dark matter profiles that are relatively flat in the inner region, often referred to as cored profiles (Moore, 1994; Salucci et al., 2003; Kuzio de Naray et al., 2008; Oh et al., 2011). It is argued that this contradicts a prediction of cold dark matter cosmology, that dark mater halos have steep inner density profiles, or “cusps” (Navarro et al., 1996). Yet other galaxies have rotation curves that do rise steeply in the inner region, and which can be fit by cuspy dark matter density profiles, having relatively high values of Vrot(1kpc) compared to Vmax. It would seem that a successful model of galaxy formation needs to account for both cored and cuspy density profiles, sometimes in galaxies that have similar dynamical masses.
This Letter examines the scatter in the Vrot(1kpc)-Vmax plane in a model population of galaxies that incorporates the empirical scatter in disc scale-lengths (Courteau et al., 2007; Swaters et al., 2009; Fathi et al., 2010), scatter in the concentration-halo mass relation (Dutton & Macciò, 2014), and scatter in the M⋆-Mhalo relation (Reddick et al., 2013; Behroozi et al., 2013). Different forms of the underlying dark matter halo are assumed. Firstly the universal “NFW” density profile that provides a good fit to dark matter only simulations (Navarro et al., 1996). Secondly a mass dependent density profile that accounts for the effects of baryons on dark matter (Di Cintio et al. 2014a,b). And finally, a cored density profile that may occur in alternative dark matter theories, in particular self-interacting dark matter (SIDM).
In Section 2.1, we present our model galaxy populations. In Section 2.3 we compile an observational sample of galaxies which have detailed rotation curve data. In Section 3 we show the model populations in the Vrot(1kpc)-Vmax plane, and plot the scatter in Vrot(1kpc)/Vmax as a function of Vmax, making comparisons with the observational sample. We discuss our findings in Section 4, concluding that baryonic physics play a role in shaping the dark matter density profiles in the inner 1 kpc of galaxies.
2 Method
2.1 Model
Our model galaxies consist of exponential stellar and gas discs embedded within dark matter halos. For the dark matter halos, we use the concentration-mass relation for Planck CDM (Dutton & Macciò, 2014), including a correction for adiabatic contraction, as found in cosmological simulations (Di Cintio et al., 2014). This contraction correction alters the concentration rather than the inner slope, allowing the inner slope of the density profile to be set by hand, and has the form:
| (1) |
where (M⋆/Mhalo) + 4.5, and CNFW is the concentration given from the adopted (Dutton &
Macciò, 2014) relation.
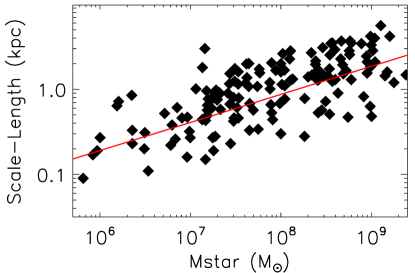
Galaxy stellar masses are matched to dark matter halos using the empirical abundance matching relation (Guo et al., 2010). We include the universal dark matter fraction of mass (/=0.83) in dark matter halos, and add a stellar disc with scale-lengths (hs) taken from the observed M⋆-hs relation, log10(hs)=2.8+0.35log10(M⋆), (Dutton 07 gives log10(hs)=2.46+0.281log10(M⋆)) coming from a fit to galaxies from Hunter & Elmegreen (2006), which is similar to the relation found previously in larger studies of generally more massive galaxies (Courteau et al., 2007; Fathi et al., 2010). We also add a gas disk with mass Mgas1.3MHI, with log10(MHI/M⋆)logM⋆ (Papastergis et al., 2012) and disc scale length hg=3hs.
The mass dependent ‘DC14’ density profile is based on cosmological simulations which match a wide range of galaxy scaling relations (Brook et al., 2012; Stinson et al., 2013; Kannan et al., 2014; Obreja et al., 2014). The DC14 profile accounts for the expansion of dark matter halos due to the effects of feedback from star forming regions (Di Cintio et al., 2014), taking the form (Merritt et al., 2006):
| (2) |
where () are the sharpness of the transition, the outer and the inner slope, respectively.
The DC14 profile allows for a range of inner slopes, determined by the stellar-to-halo mass ratio. Galaxies with M⋆3106M⊙ are dark matter dominated, and do not produce enough energy to flatten the halo’s inner density profile, which remains steep (Peñarrubia et al., 2012; Governato et al., 2012; Di Cintio et al., 2014). The inner density profile then becomes increasingly flat as stellar mass increases relative to the dark matter mass (Governato et al., 2012; Di Cintio et al., 2014), with the greatest flattening when M⋆3108M⊙. For higher masses, the deeper potential well is able to oppose the halo expansion (Di Cintio et al. 2014a,b), resulting in a profile which becomes steeper, and returns to the NFW value at about the Milky Way mass.
We make a simple parameterisation as representative of the self interacting dark matter (SIDM) case, which is loosely based on Zavala et al. (2013). Core size is set to zero for Milky Way mass galaxies (M⋆=61010M⊙) and increases as the scale-length decreases, until reaching a maximum for M⋆108M⊙, with lower mass halos all having the maximum core size, for which we use values of 1, 2 and 3 kpc. Cored profiles for the SIDM model have the form:
| (3) |
where is a characteristic halo density, is a scale radius and is the core size (Peñarrubia et al., 2012).
Note that this definition of core size, set by the parameter , does not necessarily match definitions used in studies which use different density profiles, so care needs to be taken when comparing core sizes quoted here to those quoted in other studies.
The important distinction between the SIDM model and the DC14 model is that in the SIDM case, core size depends on halo mass, while in the DC14 model the core size depends on the ratio of M⋆/Mhalo. We have not included scatter in the relation between Mhalo and core-size which may occur in SIDM models, dependent on different merger histories. Such a scatter is apparent in high mass SIDM halos Rocha et al. (2013), but has not been quantified for low mass SIDM halos.
2.2 Scatter
We then add scatter to our models. Scatter in disc scale length comes from the empirical scatter of 0.23 dex in the luminosty-disc scale length relation, determined using 144 observed galaxies (Hunter & Elmegreen 2006, Oh et al 2015 in prep), as shown in Figure 1. This is lower than the scatter of 0.3 dex found in Courteau et al. (2007) for a larger sample of late type galaxies, but a sample which is of generally higher mass galaxies than used in this study. Fathi et al. (2010) explored the relation between scale-length and stellar mass down to 106.6M⊙, and found similar scatter to Courteau et al. (2007), but with lower scatter for low mass galaxies. We tested our results using a scatter of 0.3 dex and found relatively insignificant effects that do not alter our conclusions. Scatter in the mass-concentration relation is set at 0.11 dex (Dutton & Macciò, 2014). Finally, scatter in M⋆-Mhalo is set at 0.2 dex (Reddick et al., 2013; Behroozi et al., 2013).
2.3 Observations
We compiled 110 observed galaxies (de Blok & Bosma 2002; Swaters et al. 2003; de Blok et al. 2004; Kuzio de Naray et al. 2008; de Blok et al. 2008; Swaters et al. 2009; Oh et al. 2011; Mannheim & O’Brien 2012; Oh et al 2015, and references therein) with Vmax150kms-1 that have rotation curves that allow us to compare Vrot(1kpc) with Vmax.
3 Results
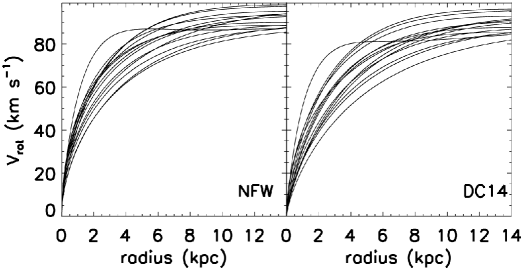
In Figure 2, we show 18 rotation curves for the models with NFW and DC14 density profiles in the left and right panels respectively. This subset of model galaxies have associated dark matter halos with maximum velocities 90V100 km s-1: the only difference between the two panels are the density profiles. A significant range of rotation curve shapes is apparent in both models. The DC14 models have rotation curves that are more slowly rising than the NFW models.
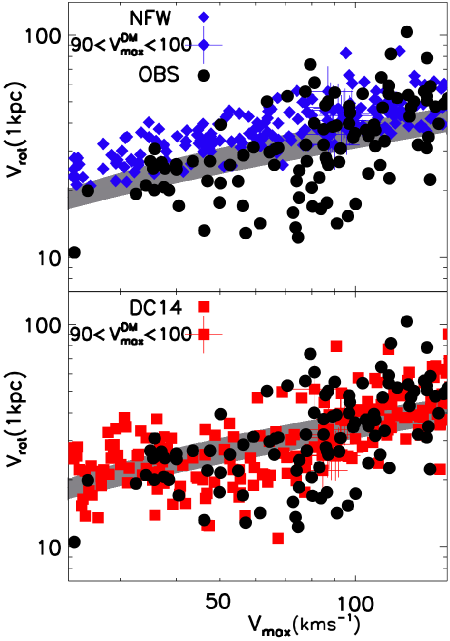
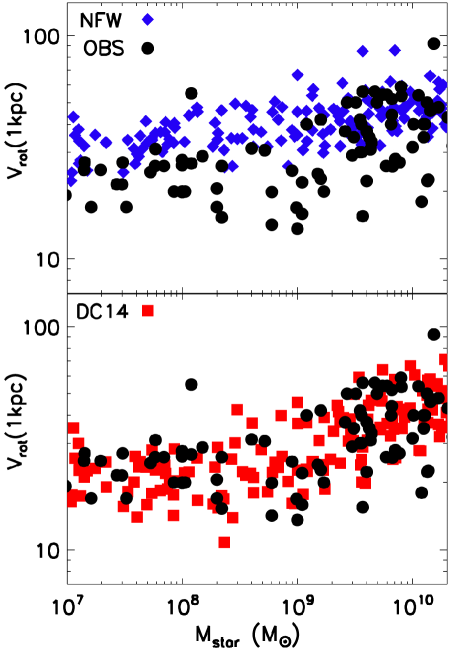
To measure the diversity in rotation curve shapes we plot, in Figure 3, Vrot(1kpc) as a function Vmax for the model galaxy populations when assuming the NFW (top panel, blue diamonds) and DC14 (bottom panel, red squares) profiles. Vmax is defined as the rotation velocity as measured at 5 disc scale lengths, better representative of the observational data than simply plotting maximum circular velocity. Also shown in each panel, as black circles, are the observed galaxies. The value of Vmax for halos from dark matter only simulations, including 1 scatter, are shown in each panel as a grey band. The 18 model galaxies whose rotation curves are shown in Figure 2 are marked with ’+’ symbols.
Two features of Figure 3 are worthy of attention. Firstly, around half the observed galaxies have values of Vrot(1kpc)/Vmaxthat fall below the NFW model population. This is just re-stating that a significant number of observed galaxies are better fit by cored profiles than cuspy profiles. By contrast, the DC14 model population includes galaxies with low Vrot(1kpc)/Vmax, better matching the observations,
The second feature is that the models with universal NFW profiles scatter around (and slightly above) the expected values from pure N-body simulations, with no apparent shape to the distribution, in terms of mass dependance. This reflects the universality of the NFW profile. By contrast, both the observed galaxies and the DC14 model galaxies appear to have a structure in their distribution; a relatively flat relation at low velocities, with a positive relation between Vrot(1kpc) and Vmax for higher rotation velocities, i.e those with Vmax70 km s-1.
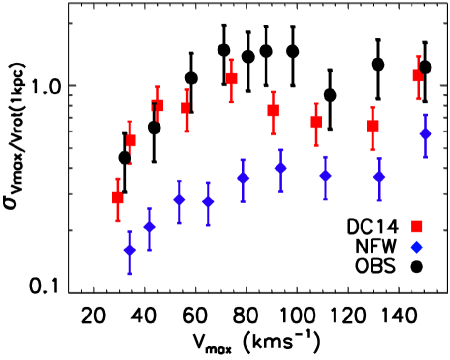
We further explore the scatter in Vrot(1kpc)/Vmax in Figure 4, where the standard deviation of the ratio Vrot(1kpc)/Vmax is plotted as a function of Vmax for the NFW (blue diamonds) and DC14 (red squares) models. The observed galaxies are again shown as black circles. In each case, error bars indicate the standard error. Clearly the NFW model has far too little scatter in the ratio Vrot(1kpc)/Vmax at all values of Vmax. The DC14 model is a better match to observations. The match is certainly not perfect, with the DC14 model having a peak dispersion at a slightly lower value of Vmax than is found in the observed population.
3.1 M⋆-V(1kpc)
We now look at the relation between M⋆ and V(1kpc), plotted for the NFW (top panel) and DC14 (bottom panel) models in Fig. fig:msv1. It is clear from Fig. fig:msv1 that the NFtW model is not able to form galaxies with low values of V(1kpc) at all stellar masses. By contrast, the observed relation between stellar mass and V(1kpc) is well produced by the DC14 model. We caution that the data set is not homogeneous in terms of stellar masses. A homogeneous set of galaxy stellar masses, along with high resolution rotation curves, as being compiled by Lelli et al. 2015 (in prep), would be invaluable here.
3.2 Self Interacting Dark Matter
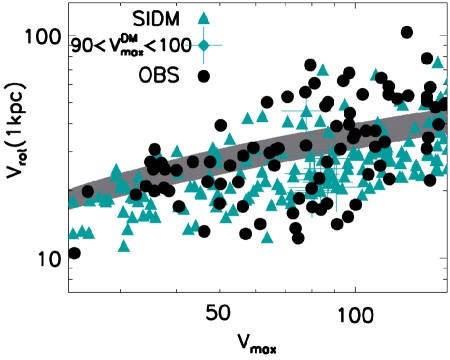
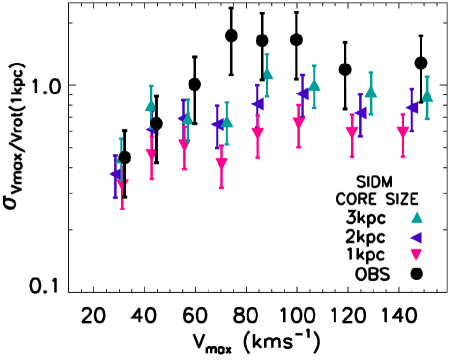
We made similar plots for the SIDM model population. Figure 6 shows Vrot(1kpc) as a function of Vmax as green triangles, where we have used a maximum core size of 3 kpc, with observed galaxies over-plotted as black circles. Again, expected values for dark matter only simulations, including 1 scatter, are shown as a grey band. The galaxies associated with dark matter halos with maximum velocities 90V100 km s-1 are marked with ’+’ symbols. Figure 7 shows the scatter in the ratio Vrot(1kpc)/Vmax plotted as a function of Vmax for the SIDM model for 3 different core sizes, 1 kpc(pink triangles), 2 kpc(purple triangles) and 3 kpc(green triangles) compared to the observed galaxies.
For the paramaterization that we have used, the SIDM model requires a relatively large core size, 3 kpc, in order to reproduce the observed relations. As is evident in Figure 6, SIDM model galaxies can have low values of Vrot(1kpc), at given Vmax, as cored profiles make a better match for galaxies with slowly rising rotation curves. The SIDM models also have a larger range of rotation curve shapes than the NFW models. The larger the cores in SIDM halos, the greater is the effect of the scatter in the baryonic mass distribution (i.e. scatter in scale-lengths) in determining the variation in rotation curve shapes. The SIDM model with 3 kpccores is able to do as well as the DC14 model in reproducing the observed scatter in the rotation curve shapes.
What has not been included in the SIDM model is a dependence of core size on mass accretion history, which would result in scatter in the core size at given halo mass. This is expected, and has been shown on cluster scales Rocha et al. (2013), but has not been quantified at low masses. This scatter will likely make the SIDM model closer to observations, and difficult to distinguish from core formation through baryonic processes, although the detailed relation between scatter and galaxy mass may still differ between the models.
4 Conclusions
We have created a model population of disc galaxies, using empirical relations between disc scale length and stellar mass, between stellar and gas mass, and between stellar and halo mass. Scatter in the M⋆-scale length and M⋆-Mhalo relations are added, also from empirical values. The model galaxies are housed within dark matter halos that follow the mass-concentration relation with scatter, as found in N-body simulations. We compare model populations that make different assumptions for dark matter halo profiles, and explore the consequent relations between Vrot(1kpc) and Vmax.
When the model galaxy population is housed within halos with universal, steep, NFW density profiles, none of the galaxies have low values of Vrot(1 kpc)/Vmax, as found in some observed galaxies, and the model population has too little scatter in Vrot(1 kpc)/Vmax.
The model population with the DC14 density profile, whose profile is determined by the ratio M⋆/Mhalo, has galaxies with low values of Vrot(1kpc)/Vmax and a large scatter in the ratio Vrot(1kpc)/Vmax, both in reasonable agreement with observations. The model galaxies with low Vrot(1kpc)/Vmax result from halo expansion, which is included in the DC14 density profile. Two effects are responsible for the increased scatter compared with the NFW model: firstly, the increased fraction of baryonic mass in the inner regions when profiles are cored, which heightens the effect of the scatter in disc scale lengths. Secondly, the dependance of the DC14 density profile on M⋆/Mhalo means that halos with the same mass can have different core sizes.
We note that the model that best fit observations included both halo expansion from non-adiabatic effects of outflows, as well as adiabatic contraction, both dependent on the ratio of M⋆/Mhalo. Both baryonic effects are required to explain the existence of galaxies below and above the Vrot(1kpc)Vmax relation that is predicted by N-body simulations.
We also looked at a specific case of a SIDM model, from which we can draw some general conclusions for models in which core size depends on Mhalo. The increased fraction of baryonic mass in the inner regions is also present in models where core size is dependent on halo mass. This means that the scatter in scale lengths results in such models having significantly more variation in rotation curve shapes than the NFW models. The cores of such models also result in low values of Vrot(1kpc)/Vmax in some galaxies, in line with observations. Scatter in Vrot(1kpc)/Vmax depends on the core size, and can be as large as the observations for core sizes of 3 kpc, using the definition of core size of eq. 3. However, core size may also have a mass dependance in SIDM models (Vogelsberger et al., 2012), which is not accounted for in our simple parameterization.
Further, it is likely that a scatter in core size versus Mhalo will exist in SIDM halos, with a dependence on merger histories. Indeed, Rocha et al. (2013) find scatter in core sizes at given halo mass. Future studies will be able to quantify such scatter, and its mass dependence, which may result in a better match between the SIDM model and observations for smaller core sizes. It is certainly also possible (as recently shown in Fry et al. 2015) that baryonic physics would affect the dark matter density profiles in a SIDM universe, in a mass dependent manner.
Our study suggests that baryonic physics are able to affect density profiles in dark matter models, to a degree that can account for the observed variation of rotation curve shapes. Such observations may also provide constraints on alternative dark matter models, such as SIDM, in terms of the scatter and size of cores at a given halo mass.
Acknowledgements
CB acknowledges support through the MINECO grant AYA2012-31101, and the Ramon y Cajal Fellowship.
References
- Behroozi et al. (2013) Behroozi P. S., Wechsler R. H., Conroy C., 2013, ApJ, 770, 57
- Brook et al. (2012) Brook C. B., Stinson G., Gibson B. K., Roškar R., Wadsley J., Quinn T., 2012, MNRAS, 419, 771
- Courteau et al. (2007) Courteau S., Dutton A. A., van den Bosch F. C., MacArthur L. A., Dekel A., McIntosh D. H., Dale D. A., 2007, ApJ, 671, 203
- de Blok & Bosma (2002) de Blok W. J. G., Bosma A., 2002, A&A, 385, 816
- de Blok et al. (2008) de Blok W. J. G., Walter F., Brinks E., Trachternach C., Oh S.-H., Kennicutt Jr. R. C., 2008, AJ, 136, 2648
- de Blok et al. (2004) de Blok W. J. G., Weldrake D. T. F., Walter F., 2004, in Ryder S., Pisano D., Walker M., Freeman K., eds, Dark Matter in Galaxies Vol. 220 of IAU Symposium, A high-resolution rotation curve of NGC 6822. p. 373
- Di Cintio et al. (2014) Di Cintio A., Brook C. B., Dutton A. A., Macciò A. V., Stinson G. S., Knebe A., 2014, MNRAS, 441, 2986
- Di Cintio et al. (2014) Di Cintio A., Brook C. B., Macciò A. V., Stinson G. S., Knebe A., Dutton A. A., Wadsley J., 2014, MNRAS, 437, 415
- Dutton & Macciò (2014) Dutton A. A., Macciò A. V., 2014, MNRAS, 441, 3359
- Fathi et al. (2010) Fathi K., Allen M., Boch T., Hatziminaoglou E., Peletier R. F., 2010, MNRAS, 406, 1595
- Fry et al. (2015) Fry A. B., Governato F., Pontzen A., Quinn T., Tremmel M., Anderson L., Menon H., Brooks A. M., Wadsley J., 2015, MNRAS, 452, 1468
- Governato et al. (2012) Governato F., Zolotov A., Pontzen A., Christensen C., Oh S. H., Brooks A. M., Quinn T., Shen S., Wadsley J., 2012, MNRAS, 422, 1231
- Guo et al. (2010) Guo Q., White S., Li C., Boylan-Kolchin M., 2010, MNRAS, 404, 1111
- Hunter & Elmegreen (2006) Hunter D. A., Elmegreen B. G., 2006, ApJS, 162, 49
- Kannan et al. (2014) Kannan R., Stinson G. S., Macciò A. V., Brook C., Weinmann S. M., Wadsley J., Couchman H. M. P., 2014, MNRAS, 437, 3529
- Kuzio de Naray et al. (2008) Kuzio de Naray R., McGaugh S. S., de Blok W. J. G., 2008, ApJ, 676, 920
- Mannheim & O’Brien (2012) Mannheim P. D., O’Brien J. G., 2012, Phys. Rev. D, 85, 124020
- Merritt et al. (2006) Merritt D., Graham A. W., Moore B., Diemand J., Terzić B., 2006, AJ, 132, 2685
- Moore (1994) Moore B., 1994, Nature, 370, 629
- Navarro et al. (1996) Navarro J. F., Frenk C. S., White S. D. M., 1996, ApJ, 462, 563
- Obreja et al. (2014) Obreja A., Brook C. B., Stinson G., Domínguez-Tenreiro R., Gibson B. K., Silva L., Granato G. L., 2014, MNRAS, 442, 1794
- Oh et al. (2011) Oh S.-H., de Blok W. J. G., Brinks E., Walter F., Kennicutt Jr. R. C., 2011, AJ, 141, 193
- Oman et al. (2015) Oman K. A., Navarro J. F., Fattahi A., Frenk C. S., Sawala T., White S. D. M., Bower R., Crain R. A., Furlong M., Schaller M., Schaye J., Theuns T., 2015, MNRAS, 452, 3650
- Papastergis et al. (2012) Papastergis E., Cattaneo A., Huang S., Giovanelli R., Haynes M. P., 2012, ApJ, 759, 138
- Peñarrubia et al. (2012) Peñarrubia J., Pontzen A., Walker M. G., Koposov S. E., 2012, ApJ, 759, L42
- Reddick et al. (2013) Reddick R. M., Wechsler R. H., Tinker J. L., Behroozi P. S., 2013, ApJ, 771, 30
- Rocha et al. (2013) Rocha M., Peter A. H. G., Bullock J. S., Kaplinghat M., Garrison-Kimmel S., Oñorbe J., Moustakas L. A., 2013, MNRAS, 430, 81
- Salucci et al. (2003) Salucci P., Walter F., Borriello A., 2003, A&A, 409, 53
- Stinson et al. (2013) Stinson G. S., Brook C., Macciò A. V., Wadsley J., Quinn T. R., Couchman H. M. P., 2013, MNRAS, 428, 129
- Swaters et al. (2003) Swaters R. A., Madore B. F., van den Bosch F. C., Balcells M., 2003, ApJ, 583, 732
- Swaters et al. (2009) Swaters R. A., Sancisi R., van Albada T. S., van der Hulst J. M., 2009, A&A, 493, 871
- Vogelsberger et al. (2012) Vogelsberger M., Zavala J., Loeb A., 2012, MNRAS, 423, 3740
- Zavala et al. (2013) Zavala J., Vogelsberger M., Walker M. G., 2013, MNRAS, 431, L20
- Zwaan et al. (1995) Zwaan M. A., van der Hulst J. M., de Blok W. J. G., McGaugh S. S., 1995, MNRAS, 273, L35