Strongly bound excitons dominate electronic relaxation in resonantly excited twisted bilayer graphene
Abstract
When two sheets of graphene stack in a twisted bilayer graphene (BLG) configuration, the resulting constrained overlap between interplanar 2 orbitals produce angle-tunable electronic absorption resonances. Using a novel combination of multiphoton transient absorption (TA) microscopy and TEM, we resolve the resonant electronic structure, and ensuing electronic relaxation inside single BLG domains. Strikingly, we find that the transient electronic population in resonantly excited BLG domains is enhanced many fold, forming a major electronic relaxation bottleneck. 2-photon TA microscopy shows this bottleneck effect originates from a strongly bound, dark exciton state lying 0.37 eV below the 1-photon absorption resonance. This stable coexistence of strongly bound excitons alongside free-electron continuum states has not been previously observed in a metallic, 2D material.
Photoexcited electrons in graphene relax energetically far faster than the e-h separation timescale, making many electronic and optoelectronic applications prohibitive.Malard et al. (2013); Graham et al. (2013a); Ju et al. (2015); Tielrooij et al. (2015) While similar fast, picosecond relaxation timescales are also observed in Bernal stacked bilayer graphene(BLG),Newson et al. (2009) slower relaxation might be possible in twisted bilayer graphene (BLG). In BLG, an off-axis interlayer twist angle () gives rise to band anticrossings and van Hove singularities (Hs, Fig 1b).Li et al. (2009); Lui et al. (2010); Park et al. (2015) Near such Hs, previous studies show that optical absorption increases by 20% and is peaked at an energy, .Li et al. (2009); Lui et al. (2010); Jorio et al. (2014); Bistritzer and MacDonald (2011); Luican et al. (2011); Grüneis et al. (2008); Havener et al. (2012); Wang et al. (2010b); Brihuega et al. (2012); Havener et al. (2014) This absorption resonance peak increases monotonically with (see supplementary video).Havener et al. (2013) To date however, the properties of photoexcited electrons in Hs remain unexplored beyond the Raman and linear absorption characterization. Here, we apply space, time, and energy-resolved 1-photon (1-ph) and 2-photon (2-ph) transient absorption (TA) microscopy to both spectrally map the excited state electronic-structure of BLG and image the ensuing electronic dynamics.
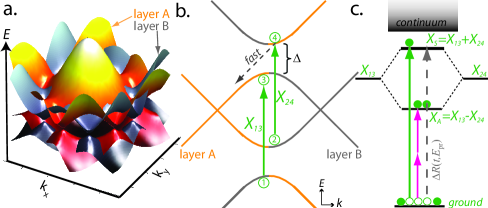
The single-particle band structure for BLG can be understood by superimposing two graphene Brillouin zones, rotated by a twist angle , as shown in Fig. 1a.Mele (2010); Lopes dos Santos et al. (2007) The vertical line cutting through the two Dirac points of the graphene layers (Fig. 1b) shows the band anticrossing near the degeneracy with an energy splitting (), and four possible Hs transitions between the graphene sub-bands labeled 1 through 4. These optical transitions experience a large joint density of states between the valance bands (1 & 2) and the conduction bands (3 & 4), but only 13 (denoted ) and 24 () transitions are allowed due to selection rules.Moon and Koshino (2013); Havener et al. (2014)
Outwardly, the and transitions shown in Fig. 1b are degenerate Hs similar to graphene’s -point saddle-point exciton.Mele (2010); Mak et al. (2011a) In this case, Coulombic attraction between e-h pairs would augment both and transition energies and produce an asymmetric, Fano optical lineshape.Ohta et al. (2012); Fano (1961) Since such unbound Fano excitons couple to continuum states of graphene,Ohta et al. (2012) this model predicts the 1-ph TA response from BLG will decay quickly, with an amplitude and rate similar to single-layer graphene (dotted arrow in Fig. 1b).
Alternatively, previous studies suggest that inclusion of bound-exciton effects are necessary to simulate the nearly gaussian BLG optical absorption lineshape.Havener et al. (2013); Liang et al. (2014) While one can consider unbound excitonic states for and independently, such a picture is incomplete because the two states occur at the same energy and momentum, a direct result of the electron-hole symmetry at the Hs in BLG. A more complete description was given in recent work reported by Liang that predicts formation of stable, strongly bound (0.5 eV) excitons.Liang et al. (2014) These first-principles calculations suggest that interlayer excited states in BLG are better described by renormalized symmetric (=+) and anti-symmetric (=-) excitonic states.Liang et al. (2014) In this model, illustrated in Fig. 1c, corresponds to the optical BLG resonance at , and is an unstable exciton.Lui et al. (2010); Havener et al. (2013) Conversely, is only 2-ph accessible and is calculated to be a strongly-bound, localized excitonic state.Liang et al. (2014) The remarkable stability predicted for the state results from the deconstructive coherence between the two degenerate Fano resonances rigorously canceling coupling with graphene continuum states. Such a state is termed a ’ghost Fano’ resonance. While similar phenomena have been weakly observed in quantum dot and carbon nanotube systems, such strongly bound exciton states have never been observed in a 2D metallic system.Lu et al. (2005); Guevara et al. (2003); Liang et al. (2014) If such ghost Fano excitons are present in BLG, weak exciton-continuum coupling is expected to enhance the local electronic population, giving longer relaxation dynamics for the 1-ph () and 2-ph () TA response.
In this work, we obtain the TA spectra and dynamics of single BLG domains, and map out the different 1-ph and 2-ph electronic transitions predicted by the contrasting Hs and strongly-bound exciton models in Fig. 1. We further correlate ultrafast TA microscopy with the precise local atomic stacking and grain boundaries, by employing darkfield TEM to definitively assign a twist angle to the absorption resonance, .Brown et al. (2012) Our experimental TA microscopy approach is outlined in Fig. 2a. The 1-ph TA map in Fig. 2a shows a prominent patch of oriented BLG that is surrounded by non-twisted CVD graphene on a silicon nitride membrane substrate. This map was obtained by raster scanning a diffraction-limited pump and probe pulse pair over the graphene. We tuned our 140 fs pump pulse to be resonant with the domain at 1.3 eV. After a delay time , we detect the differential TA (() ) of a collinear probe pulse and construct time-dependent TA maps point-wise. Using probe energies (=0.8 eV) well below the resonance , in Fig. 2a graphene gave an interband decreased absorption response (i.e. Pauli blocking of probe beam) everywhere at all time delays.Graham et al. (2013a)
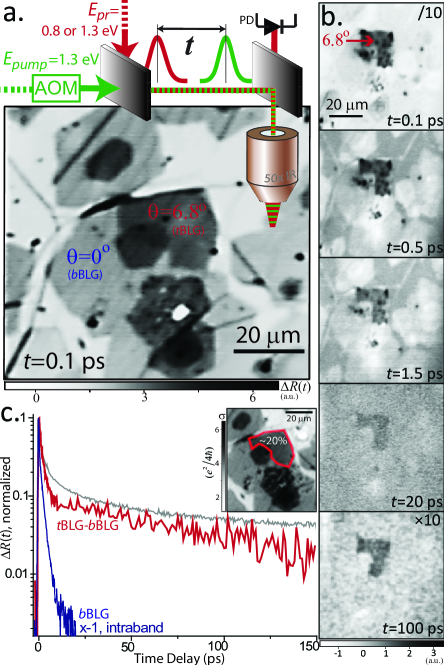
Our TA maps can be interpreted as ’movie frames’ that closely approximate the relative photoexcited electronic population at a particular probe energy and time-delay (see supplementary video 2). The 6.8o BLG region labeled in Fig. 2a has a two-fold stronger TA Pauli blocking response than the adjacent stacked regions. However, the corresponding linear absorption map in Fig. 2c only shows a 20% resonant enhancement. To account for this discrepancy, electrons in interlayer BLG avoided crossing regions must relax much slower than the surrounding non-twisted graphene bilayers, suggesting an intrinsic electronic relaxation bottleneck.
In Figure 2b, we repeat the 1-ph measurement but instead resonantly probe the electronic population at (=1.33 eV, =1.26 eV probe). Compared against the corresponding linear absorption map in Fig. 2c (inset), the TA maps differ in both sign and absolute amplitude. Strikingly, only the BLG domain gives a strong TA Pauli blocking response. Meanwhile, the surrounding graphene in Fig. 2b gives a weak, short-lived graphene intraband TA response signified by its opposite sign. This suggests that interlayer BLG electrons are decoupled from the intraband transient response that dominates the TA map everywhere else in Fig. 2b. Surprisingly, the subsequent TA movie frames show excited carriers are present even 100 ps after initial excitation. Both observations definitively show that interlayer electrons excited at experience a major bottleneck restricting electronic relaxation. Such a strong and long-lived electronic signal in BLG disagrees with the continuum Fano resonance model (Fig. 1b), but can be explained by an excitonic model (Fig. 1c) where weak exciton-continuum coupling allows for stable exciton formation.Liang et al. (2014)
To isolate the relaxation rates intrinsic to interlayer BLG electrons excited at , we plot BLG-BLG (red) in Fig. 2c by subtracting the much weaker (and opposite signed) intralayer electronic TA response (blue). A similar approach has been previously used to decouple linear absorption spectra, as -.Havener et al. (2012, 2014) A least-squares deconvolution exponential fit of the kinetic decay requires only a biexponential fit that decays with lifetimes of 1.40.1 ps and 664 ps. These lifetime components are remarkably long for any electronic state within a metallic system. By repeating our linear and TA measurements at low temperatures, we further found the interlayer electronic response appears largely invariant to both lattice temperature (5-295 K) and the substrate used (see supplemental materials). Furthermore, the TA response did not shift sign as the probe wavelength was scanned through the resonance, . Combined, these observations suggest that laser-induced heating effects do not contribute appreciably to the overall large TA signal response, and so the TA signal is predominately electronic in origin.
If carrier in BLG are unbound excitons, the TA (red) in Fig. 2c must relax at a rate similar to BLG (navy), providing that phonons with (dotted arrow in Fig. 1b) are available to scatter carriers through the anti-crossing gap () illustrated in Fig. 1b.Graham et al. (2013a) Comparison of the short-time BLG kinetics against BLG in Fig. 2c (red) reveals the absence of the dominant fast sub-ps electron relaxation components associated with graphene electron thermalization and optic phonon emission.Wang et al. (2010b) Remarkably, the shortest interlayer BLG lifetime is 1.4 ps, which is similar to graphene’s rate-limiting relaxation rate that is often associated with disorder-assisted or supercollision relaxation.Graham et al. (2013a, b) The absence of the sub-ps relaxation processes, and the emergence of this long 66 ps decay in BLG relaxation kinetics, suggests that some electrons are decoupled from graphene’s continuum states, as predicted by the strongly bound exciton model.Liang et al. (2014)
The unexpected TA bottleneck we observe in BLG may be compared against semiconducting single-walled carbon nanotubes (SWCNTs), a similar carbon system with constrained 2 orbital interactions. It is established that SWCNTs have 1-ph and 2-ph excitonic states resulting from (chiral) angle dependent overlapping 2 orbitals.Srivastava et al. (2008); Matsunaga et al. (2008); Deslippe et al. (2007) Fig. 2c (gray) directly compares the exciton relaxation rate of (6,5) chirality SWCNTs against BLG (red). While the short time behavior differs greatly, Fig. 2c shows the longer components of both traces decay at a similar rate, suggesting that the dynamic phonon environment causing exciton relaxation in SWCNTs might be of a similar nature to the interlayer exciton-phonon interactions causing exciton relaxation in BLG.
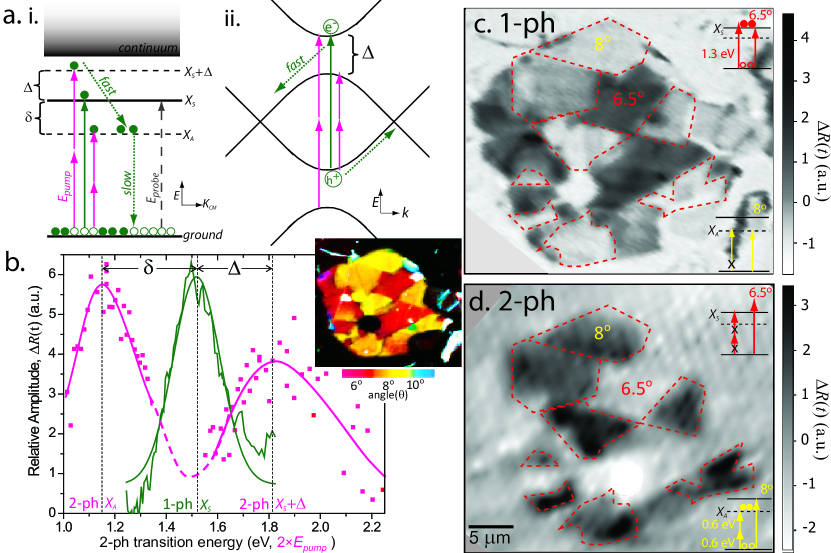
We can better distinguish between competing Hs and bound exciton models outlined in Fig. 3a, by exploiting the 2-ph selection rules required for the predicted dark BLG exciton state, .Moon and Koshino (2013); Liang et al. (2014) To search for possible dark state transitions, we used a different sample of CVD bilayer graphene. The linear absorption map shown in Fig. 3b (inset) reveals a series of BLG domains with twist angles of either (yellow) or (red), corresponding to 1.25 eV and 1.55 eV respectively. Figure 3b plots the 2-ph TA spectrum obtained using IR pump energies ranging from 0.49 to 1.15 eV, and a resonant probe at =0.56 eV. We observe two clear TA peaks centered at 1.18 eV and 1.82 eV that originate from a resonantly enhanced 2-ph absorption. Specifically, as illustrated in Fig. 3ai, we observe these dark states through resonant 2-ph enhanced Pauli blocking of the depleted ground state. Moreover, our ability to probe electronic population of optically dark state requires that and states share a common ground state; an inherent feature of a bound exciton model.Deslippe et al. (2007)
The lowest peak in Fig. 3b indicates that enhanced 2-ph absorption took place via a discrete, low-lying transition centered at 1.18 eV. Comparing the 2-ph peak against the 1-ph absorption resonance at =1.55 eV (green, Fig. 3b), we readily obtain the energy-state splitting parameters of eV and eV. This 0.37 eV energy splitting closely matches the theoretically predicted 0.4-0.5 eV, state splitting calculated for 21o BLG.Liang et al. (2014) Such a large bright-dark state energy splitting is much greater than the analogous state splitting in SWCNTs, and explains why photoluminescence has not yet been observed from resonantly excited BLG domains.
To completely map the selection rules associated with BLG electronic transitions, we compare the 1- and 2-ph TA microscopy response of and oriented domains in Fig. 3c-d. Fig. 3c maps-out the 1-ph TA response for =1.3 eV, =1.2 eV at = ps. Despite the state being 1-ph resonant with the BLG (dotted red outlines), we observed only a weak intraband response as was seen for BLG regions previously (Fig. 2b). This confirms that the transition is not 1-ph accessible. In contrast, the 6.5o BLG domains give a strong Pauli blocking response because is resonant with .
2-ph resonant transitions of single BLG domains are imaged in Fig. 3c, by tuning our pump pulse energy to roughly half the predicted state energy(see Fig. 3a), or = 0.6 eV. Comparison of the TA maps in Fig. 3c against 3d show all of the 8o BLG domain excitations that were forbidden under 1-ph excitation conditions are now allowed for a 2-ph excitation. Conversely, all the 6.5o BLG domain excitations that were observed under 1-ph excitation conditions now appear dark (inaccessible) under two-photon excitation. Using state parity, we assign the two-photon accessible dark states in Fig. 3d to electronic carriers populating the state of 8o BLG. Together, Fig. 3c and 3d show that the bright state is two-photon forbidden, and the dark state is only two-photon allowed. These strongly enforced selection rules follow the parity expectations of a roughly hydrogenic-like, strongly-bound exciton model advocated by recent first-principle simulations.Liang et al. (2014)
The 2-ph spectral peak centered at 1.82 eV in Fig. 3b has not been previously predicted or observed. This peak has a broader, asymmetric shape, that fits better to a Fano lineshape expected from the unbound exciton model.Mak et al. (2011b); Chae et al. (2011) In contrast, the other 1-ph and 2-ph peaks in Fig. 3b fit best to a gaussian lineshape, a common characteristic of bound excitonic transitions. Accordingly, we infer that the two-photon absorption near 1.82 eV is best assigned to an unbound state transition labeled + in Fig. 3ai. Conversely, the two-photon absorption resonance lying eV below is best characterized as the bound exciton or ghost Fano resonance peak predicted by Liang et al. Liang et al. (2014) as supported by (i.) its asymmetric energy spacing (i.e. vs. ), (ii.) gaussian lineshape, (iii.) long electronic lifetime and (iv.) parity enforced two-photon selection rules for the and transitions.
Using both explicit calculations based on the Bethe-Salpeter equation and effective low-angle continuum model, Liang et al. predicted radically different electronics properties emerge for both the theorized and exciton states.Liang et al. (2014) Specifically, the symmetric state was found to have delocalized wavefunctions and a negligible binding energy. Conversely, the antisymmetric state is predicted to be optically dark, insensitive to charge screening, and strongly bound.Liang et al. (2014) While certain phonons can scatter bound excitons into the lower-lying continuum states, the exciton-continuum coupling for the is predicted to be vanishingly small, and roughly intensive to charge screening effects.Liang et al. (2014) Accordingly, both theory and our TA microscopy now support that fast exciton dissociation becomes unfavorable in the state of BLG, enabling stable and meta-stable bound exciton states to form.
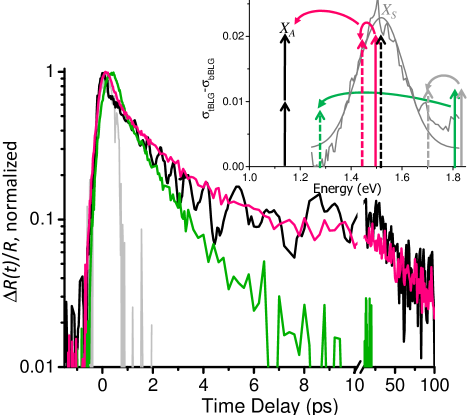
Lastly, we compare the 1-ph (pink) vs. 2-ph (black) electron relaxation kinetics measured for 8o BLG in Fig. 4. We find that the normalized TA relaxation kinetics for one-photon and two-photon resonant excitations are nearly identical. These matching kinetics indicate that both signals originate from the same depleted common ground state, and that the electrons are impulsively transferred from the bright to the dark state as illustrated in Fig. 3ai. Such fast kinetic relaxation is consistent with theory showing that is an unstable exciton state.Liang et al. (2014) As a control, in Fig. 4 (gray) we show that the relaxation kinetics are impulsive when both and , indicating that only free electron states are probed above resonance. Lastly we consider the case of , and find the long-decay components are consistently absent, suggesting resonant optical excitation may be required to form a long-lived stable exciton. Nonetheless, the off-resonance BLG kinetic relaxation (green) is still significantly enhanced in amplitude and lifetime compared to the BLG TA response (Fig. 2c). This suggests that an electronic relaxation bottleneck effect is still present even when BLG is optically excited above resonance.
By definitively isolating the interlayer electronic dynamics of 1- and 2-ph resonant optical transitions in BLG, we have uncovered a fine-structure of bound () and unbound (, +) exciton states that agrees well with recent simulations.Liang et al. (2014) Specifically, we employed a novel form of diffraction-limited TA microscopy to obtain the intrinsic spectra and dynamics of single BLG domains under a variety of resonant and non-resonant pump/probe combinations. In Fig. 2b, we show a TA-movie of electronic population that reveals the striking contrast between the bound-exciton carriers in the BLG region and the free-electron population in the surrounding graphene. These results suggest that the photoexcited BLG interlayer electrons are initially decoupled from scattering into graphene continuum sates, and experience a significant electron relaxation bottleneck. In particular, resonantly excited carriers in BLG give much stronger TA amplitude with longer relaxation kinetics for both the short (2 ps) and long relaxation timescales (70 ps). This bottleneck is best explained by the existence of strongly-bound excitons in a ’ghost Fano’ state that we explicitly resolve using 2-ph TA microscopy.Liang et al. (2014) Our results imply that BLG may be a unique hybrid electronic material where free-electron metallic character can coexists alongside stable exciton states. The work further opens up possible new avenues for carrier extraction that combine the high conductivity of metallic intralayer-electrons, with the enhanced electronic population that is now established for the interlayer electrons in BLG.
Methods: Multi-layer graphene was grown using low pressure CVD method on copper foil and transferred to silicon nitride grids (see supplemental materials).Li et al. (2011) Areas containing low-angle BLG were first identified using, a combination of hyperspectral absorption imaging technique, and dark field TEM (DF-TEM).Havener et al. (2013) Final twist angle assignments of the bilayer patches were made by correlating the linear absorption and 1-ph TA peak spectral peaks energies.
BLG bright () and dark () states and their corresponding electronic dynamics were measured using 1- and 2-ph confocal scanning TA microscopy.Hartland (2010) Collinear pump-and probe pulses were obtained from two independently tunable outputs of an ultrafast system composed of Ti:Saph oscillator (Coherent Chameleon Ultra II, 80 MHz, wavelength range 680-1080 nm) pumping an optical parametric oscillator (APE-Compact, wavelength range 1000-4000 nm). For one-photon TA measurements requiring pump and probe pulse doubly resonant with the bright () transition, a white-light supercontinuum probe was instead used. Cross-correlation of the pump and probe after the objective yielded a FWHM pulse duration of fs.
After a mechanical delay stage, both the pump, and the probe beams were aligned in a collinear geometry, raster-scanned by piezo-scanning mirror and coupled into a confocal scanning microscope via a 50X IR-region enhanced, achromatic objective (NA= 0.65). One- and two photon transient absorption signals were detected by measuring the probe beam on with a TE cooled InGaAs detector connected to a Zurich HF2LI lock-in amplifier. The pump beam was modulated at either 0.25 or 1 MHz using a AO-modulator (Gooch & Housego) to enable high-frequency lock-in detection of the differential reflectivity. Appropriate optical filters were used in front of the detector to block the pump beam. The pump and probe spot sizes on the sample were determined to 1.5 m, by fitting to a confocal scanning reflection profile of deposited gold pads. The fluence of the probe power was 5% of the pump fluence. Except where specified, all the measurements were done at 295 K. The probe power was fixed at ( photons/cm2 ) for the pump power dependence measurements. Microscope objective/transmission corrections curves were measured and rigorously taken into account for all the wavelengths, after each measurement.
Acknowledgments: this research was supported by the Oregon State Foundation and Cornell’s AFOSR (FA 9550-10-1-0410) grant. This work made use of TEM facilities of Cornell Center for Materials Research Shared Facilities which are supported through the NSF MRSEC program (DMR-1120296). We gratefully acknowledge Robin Havener.
References
- Malard et al. (2013) L. M. Malard, K. Fai Mak, A. H. Castro Neto, N. M. R. Peres, and T. F. Heinz, New Journal of Physics 15, 015009 (2013).
- Graham et al. (2013a) M. W. Graham, S.-F. Shi, Z. Wang, D. C. Ralph, J. Park, and P. L. McEuen, Nano Letters 13, 5497 (2013a).
- Ju et al. (2015) L. Ju, Z. Shi, N. Nair, Y. Lv, C. Jin, J. Velasco Jr, C. Ojeda-Aristizabal, H. A. Bechtel, M. C. Martin, A. Zettl, J. Analytis, and F. Wang, Nature advance online publication (2015), 10.1038/nature14364.
- Tielrooij et al. (2015) K. J. Tielrooij, L. Piatkowski, M. Massicotte, A. Woessner, Q. Ma, Y. Lee, K. S. Myhro, C. N. Lau, P. Jarillo-Herrero, N. F. v. Hulst, and F. H. L. Koppens, Nature Nanotechnology advance online publication (2015), 10.1038/nnano.2015.54.
- Newson et al. (2009) R. W. Newson, J. Dean, B. Schmidt, and H. M. van Driel, Optics Express 17, 2326 (2009).
- Li et al. (2009) G. Li, A. Luican, J. M. B. Lopes dos Santos, A. H. Castro Neto, A. Reina, J. Kong, and E. Y. Andrei, Nature Physics 6, 109 (2009).
- Lui et al. (2010) C. H. Lui, Z. Li, Z. Chen, P. V. Klimov, L. E. Brus, and T. F. Heinz, Nano Letters 11, 164 (2010).
- Park et al. (2015) J. Park, W. C. Mitchel, S. Elhamri, L. Grazulis, J. Hoelscher, K. Mahalingam, C. Hwang, S.-K. Mo, and J. Lee, Nature Communications 6 (2015), 10.1038/ncomms6677.
- Jorio et al. (2014) A. Jorio, M. Kasperczyk, N. Clark, E. Neu, P. Maletinsky, A. Vijayaraghavan, and L. Novotny, Nano Letters 14, 5687 (2014).
- Bistritzer and MacDonald (2011) R. Bistritzer and A. H. MacDonald, Proceedings of the National Academy of Sciences of the United States of America 108, 12233 (2011).
- Luican et al. (2011) A. Luican, G. Li, A. Reina, J. Kong, R. R. Nair, K. S. Novoselov, A. K. Geim, and E. Y. Andrei, Physical Review Letters 106, 126802 (2011).
- Grüneis et al. (2008) A. Grüneis, C. Attaccalite, L. Wirtz, H. Shiozawa, R. Saito, T. Pichler, and A. Rubio, Physical Review B 78, 205425 (2008).
- Havener et al. (2012) R. W. Havener, H. Zhuang, L. Brown, R. G. Hennig, and J. Park, Nano Letters 12, 3162 (2012).
- Wang et al. (2010b) Y. Wang, Z. Ni, L. Liu, Y. Liu, C. Cong, T. Yu, X. Wang, D. Shen, and Z. Shen, ACS nano 4, 4074 (2010b).
- Brihuega et al. (2012) I. Brihuega, P. Mallet, H. González-Herrero, G. Trambly de Laissardière, M. M. Ugeda, L. Magaud, J. M. Gómez-Rodríguez, F. Ynduráin, and J.-Y. Veuillen, Physical Review Letters 109, 196802 (2012).
- Havener et al. (2014) R. W. Havener, Y. Liang, L. Brown, L. Yang, and J. Park, Nano Letters 14, 3353 (2014).
- Havener et al. (2013) R. W. Havener, C.-J. Kim, L. Brown, J. W. Kevek, J. D. Sleppy, P. L. McEuen, and J. Park, Nano Letters 13, 3942 (2013).
- Mele (2010) E. J. Mele, Physical Review B 81, 161405 (2010).
- Lopes dos Santos et al. (2007) J. M. B. Lopes dos Santos, N. M. R. Peres, and A. H. Castro Neto, Physical Review Letters 99, 256802 (2007).
- Moon and Koshino (2013) P. Moon and M. Koshino, Physical Review B 87, 205404 (2013).
- Mak et al. (2011a) K. F. Mak, J. Shan, and T. F. Heinz, Physical Review Letters 106, 046401 (2011a).
- Ohta et al. (2012) T. Ohta, J. T. Robinson, P. J. Feibelman, A. Bostwick, E. Rotenberg, and T. E. Beechem, Physical Review Letters 109, 186807 (2012).
- Fano (1961) U. Fano, Physical Review 124, 1866 (1961).
- Liang et al. (2014) Y. Liang, R. Soklaski, S. Huang, M. W. Graham, R. Havener, J. Park, and L. Yang, Physical Review B 90, 115418 (2014).
- Lu et al. (2005) H. Lu, R. Lü, and B.-f. Zhu, Physical Review B 71, 235320 (2005).
- Guevara et al. (2003) M. Guevara, F. Claro, and P. Orellana, Physical Review B 67, 195335 (2003).
- Brown et al. (2012) L. Brown, R. Hovden, P. Huang, M. Wojcik, D. A. Muller, and J. Park, Nano Letters 12, 1609 (2012).
- Graham et al. (2013b) M. W. Graham, S.-F. Shi, D. C. Ralph, J. Park, and P. L. McEuen, Nature Physics 9, 103 (2013b).
- Srivastava et al. (2008) A. Srivastava, H. Htoon, V. Klimov, and J. Kono, Physical Review Letters 101, 087402 (2008).
- Matsunaga et al. (2008) R. Matsunaga, K. Matsuda, and Y. Kanemitsu, Physical Review Letters 101, 147404 (2008).
- Deslippe et al. (2007) J. Deslippe, C. D. Spataru, D. Prendergast, and S. G. Louie, Nano letters 7, 1626 (2007).
- Mak et al. (2011b) K. F. Mak, J. Shan, and T. F. Heinz, Physical Review Letters 106, 046401 (2011b).
- Chae et al. (2011) D.-H. Chae, T. Utikal, S. Weisenburger, H. Giessen, K. V. Klitzing, M. Lippitz, and J. Smet, Nano letters 11, 1379 (2011).
- Li et al. (2011) X. Li, C. W. Magnuson, A. Venugopal, R. M. Tromp, J. B. Hannon, E. M. Vogel, L. Colombo, and R. S. Ruoff, Journal of the American Chemical Society 133, 2816 (2011).
- Hartland (2010) G. V. Hartland, Chemical Science 1, 303 (2010).