11email: Johannes.Sahlmann@esa.int 22institutetext: Center for Astrophysics and Space Science, University of California San Diego, La Jolla, CA, 92093, USA 33institutetext: INTA-CSIC Centro de Astrobiología, 28850 Torrejón de Ardoz, Madrid, Spain 44institutetext: Main Astronomical Observatory, National Academy of Sciences of the Ukraine, Zabolotnogo 27, 03680 Kyiv, Ukraine 55institutetext: Observatoire de Genève, Université de Genève, 51 Chemin Des Maillettes, 1290 Versoix, Switzerland 66institutetext: University of Cambridge, Cavendish Laboratory, J J Thomson Avenue, Cambridge, CB3 0HE, UK
DE082349 is a juvenile binary brown dwarf at 20.7 pc††thanks: Based on observations made with ESO telescopes at the La Silla Paranal Observatory under programme IDs 086.C-0680, 088.C-0679, 090.C-0786, and 092.C-0202.
Astrometric monitoring of the nearby early-L dwarf DE082349 has revealed a low-mass companion in a 248-day orbit that was announced in an earlier work. Here, we present new astrometric and spectroscopic observations that allow us to characterise the system in detail. The optical spectrum shows Li i-absorption indicative of a young age and/or substellar mass for the primary component. The near-infrared spectrum is best reproduced by a binary system of brown dwarfs with spectral types of L1.5 L5.5 and effective temperatures of K and K. To conform with the photocentric orbit size measured with astrometry and the current understanding of substellar evolution, the system must have an age in the 80–500 Myr range. Evolutionary models predict component masses in the ranges of and with a mass ratio of . Multi-epoch radial velocity measurements unambiguously establish the three-dimensional orbit of the system and allow us to investigate its kinematic properties. DE082349 emerges as a rare example of a nearby brown dwarf binary with orbit, component properties, and age that are characterised well. It is a juvenile resident of the solar neighbourhood, but does not appear to belong to a known young association or moving group.
Key Words.:
Stars: low-mass – Brown dwarfs – Planetary systems – Binaries: close – Spectroscopy – Astrometry1 Introduction
Binary stars are vital for advancing our understanding of stellar formation and evolution. They provide us with the opportunity of direct mass measurements through orbital motion, and they are calibration systems for evolutionary models, which have to match the observations of a two-body system that presumably is co-eval and has near-identical composition. Very low-mass binary systems composed of brown dwarfs and/or ultracool dwarfs (spectral type M7 and later) are no exception and are in many ways more enlightening, given that brown dwarfs dim and cool substantially over time, yet they are less common than their higher-mass counterparts. The discovery and characterisation of ultracool dwarf binaries is thus a rare opportunity to yield observational input for the refinement of models, eventually leading to a better understanding of ultracool dwarf physics.
The L dwarf DENIS J082303.1-491201, hereafter DE082349, was targeted as part of an astrometric planet search (Sahlmann et al., 2014) and consequently identified as an astrometric binary (Sahlmann et al., 2013). On the basis of features in its optical spectrum (Phan-Bao et al., 2008), Sahlmann et al. (2013) suggested that DE082349 is younger than the average field population, which corresponds to a primary at the hydrogen-burning mass limit orbited by a low-mass brown dwarf secondary. Here, we present follow-up spectroscopic observations that allow us to better constrain the system’s properties, in particular the components’ effective temperatures, the system age, and individual masses.
2 Observations
2.1 VLT/FORS2 imaging
We obtained two new astrometric epochs with the FORS2 instrument (Appenzeller et al., 1998) at ESO’s Very Large Telescope (VLT), in addition to the data used for the orbit discovery. Details on the observation strategy can be found in Sahlmann et al. (2013, 2014). The photocentre computations for DE082349 are complicated by a close background star, which resulted in noticeable systematic errors for this object compared to other targets of the astrometric survey. Therefore a special model that extends the work of Lazorenko et al. (2014) was devised for the reduction of DE082349 images. In this model, the seeing-dependent light contribution of the background star is taken into account. A second improvement concerns the enhanced suppression of parameter correlations when reducing data of objects that show significant orbital motion. All data were re-reduced with the improved methods and used for the orbit adjustment.
2.2 VLT/UVES spectroscopy
We observed DE082349 on 2013 October 7 (MJD111Modified Julian date (MJD) is barycentric Julian date – 2400000.5. 56572.3332) with the red arm of UVES at the VLT (Dekker et al., 2000) using a slit width, which provided a resolving power of 33 000, and the Dichroic 2 standard setup centred at 760 nm to cover the wavelength range of 565 - 931 nm. The exposure time was 2830 s and the observation took place with 101 optical seeing at an airmass of 1.52. The spectrum was recorded on two separate chips (REDL and REDU) and was reduced using the ESO pipeline in standard setup.
2.3 IRTF/SpeX spectroscopy
We observed DE082349 on 2013 November 24 (UT) with the SpeX spectrograph on the NASA Infrared Telescope Facility. (IRTF; Rayner et al. 2003). Conditions were clear but windy with poor seeing (14 at -band). We used the SpeX prism mode with the 05 slit aligned with the parallactic angle, yielding 0.8–2.45 m spectra with an average resolution 120. Eight exposures of 120 s each were obtained at an airmass of 2.81, followed by observations of the A0 V star HD 83719 ( = 7.64) at an airmass of 2.79. HeNeAr arc lamps and quartz lamp exposures were also obtained for dispersion and pixel response calibration. Data were reduced using SpeXtool version 3.4 (Cushing et al., 2004; Vacca et al., 2003) following standard procedures for point-source extraction.
2.4 Keck/NIRSPEC spectroscopy
We obtained two high-resolution infrared spectra of DE082349 with the NIRSPEC echelle spectrograph on the Keck II telescope (McLean et al., 2000) on 2014 April 14 and December 8. Conditions on both nights were clear with 06 and 09 seeing at -band, respectively. We used the N7 order-sorting filter and 0432-wide slit to obtain 2.00–2.39 m spectra over orders 32–38 with = 20 000 ( = 15 km s-1) and dispersion of 0.315 Å pixel-1. Two dithered exposures of 600 s each were obtained at an airmass of 2.78, followed with observations of the A0 V star HD 87363 ( = 6.11). Flat field and dark frames were obtained at the start of the night with the same instrument setting.
3 Analysis and interpretation
| (mas) | ||
| (mas) | ||
| (mas) | 48.27 | |
| (mas yr-1) | ||
| (mas yr-1) | 7.99 | |
| 0.36 | ||
| (deg) | 41.8 | |
| (day) | 247.75 | |
| (deg) | -365.8 | |
| (deg) | ||
| (deg) | 52.2 | |
| (mas) | 4.62 | |
| (mas) | 20.8 | |
| (mas) | ||
| (mas) | ||
| (mas) | ||
| Derived and additional parameters | ||
| (MJD) | 55926.823928 | |
| (mas) | ||
| (mas) | ||
| Distance | (pc) | |
| Number of epochs / frames | 16 / 334 | |
| (mas) | 0.176 | |
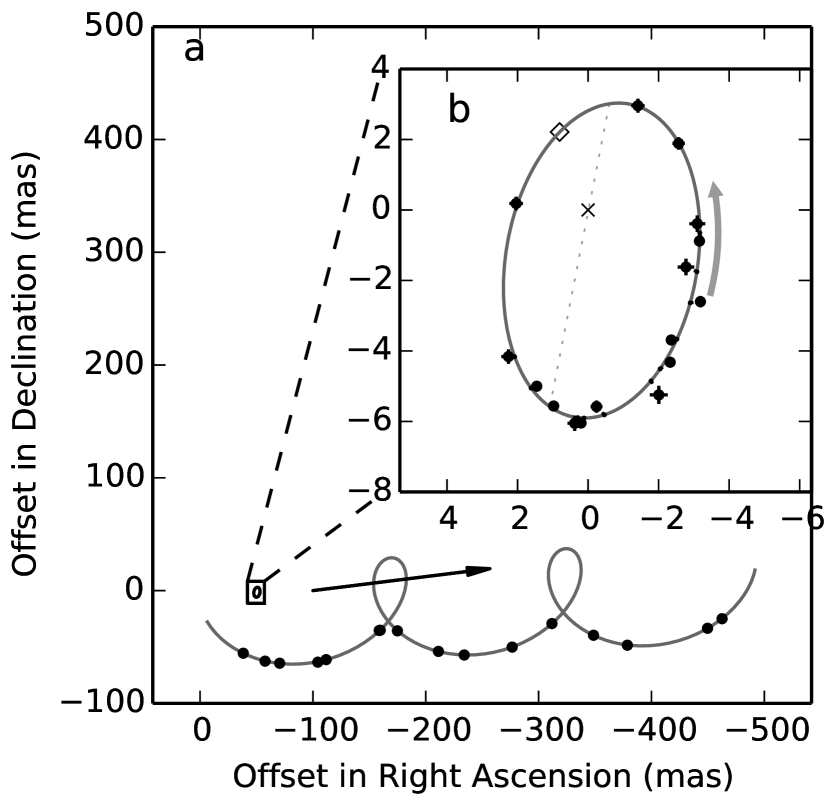
Because of the new astrometric measurements and the improved reduction method, we re-analysed the astrometric data that comprise 16 epochs over a timespan of 831 days. The analysis methods are described in detail in Sahlmann et al. (2013) and consist of a genetic algorithm followed by a Markov-Chain Monte Carlo (MCMC) code. The updated fit parameters and their confidence intervals are reported in Table 1, where and are relative offsets to the target’s position at the reference date taken as the arithmetic mean of the observation dates, is the relative parallax, and are the proper motions, is the eccentricity, is the argument of periastron, is the orbital period, is the mean longitude at , is the ascending node, is the orbit’s inclination, and is the semi-major axis of the photocentric orbit. The parameters and model the differential chromatic refraction and and are nuisance parameters. The parallax correction was determined in Sahlmann et al. (2013) and yields the absolute parallax . The time of periastron passage can be retrieved via the mean anomaly
| (1) |
where t is time and is the phase at periastron.
The most significant change is the reduction of the residual scatter from 0.330 milli-arcseconds (mas) (Sahlmann et al., 2013) to mas, which reflects the improved data reduction. Consequently, the confidence intervals of most parameters are smaller as well. A notable change in the orbital parameters is a smaller inclination (° before, ° in this work). Other parameters, in particular the parallax, period, eccentricity, and photocentric semi-major axis , remain unchanged when accounting for the uncertainties.
3.1 Radial velocity measurements
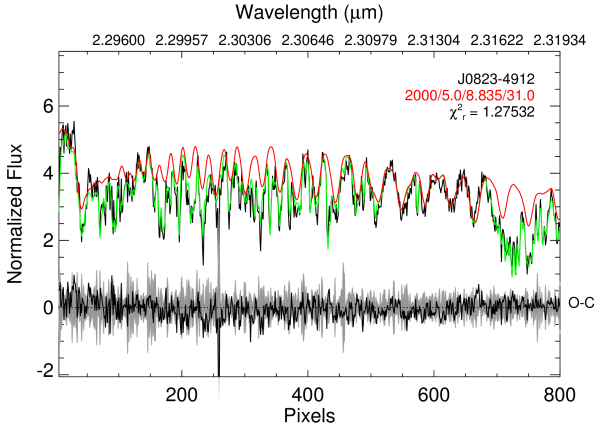
The Keck/NIRSPEC spectra were optimally extracted using a modified version of the REDSPEC package; the spectra on each night had a S/N12. These data were then forward-modelled using a custom MCMC implementation of the method described in Blake et al. (2010). We used the Solar atlas of Livingston & Wallace (1991) to model telluric absorption and the BT-Settl atmosphere models (Allard et al., 2011) to model the spectrum of DE082349. A = 2000 K, = 5.0 (cgs) model provided the best fit. Figure 2 shows that the extracted spectrum is a good fit to the final model. The distribution of chain values yields the mean heliocentric radial velocities and projected rotational velocities listed in Table 4.
We also measured the radial velocity on the UVES spectrum using four strong atomic lines clearly visible in the data, namely Rb i at 780.0268 nm, Rb i at 794.7603 nm, Cs i at 852.1132 nm, and Cs i at 894.3474 nm. The rest wavelengths for these lines were obtained from the NIST Atomic Spectra Database (version 5.1; Kramida et al. 2012). The wavelengths of the centroid of the lines in the observed spectrum were derived using line profile fitting with the task splot in IRAF. Heliocentric correction was applied using the IRAF task rvcorrect and the information of Julian Date provided in the FITS header. This procedure was checked using archival UVES spectra for the L1 dwarf 2MASS J10484281+0111580 from ESO program ID 078.C-0025(A) (PI A. Reiners). With our method we obtained a heliocentric radial velocity of 21.9 1.4 km/s, which is consistent with the published value of 24.0 1.1 km/s (Seifahrt et al., 2010). No significant (i.e. larger than our uncertainties) radial velocity offset is expected to exist between the NIRSPEC and UVES measurements, as these two instruments have been shown to give comparable results for the brown dwarf LP944-20, although with larger scatter in the UVES based measurements (Martín et al., 2006). For DE082349, we determined a heliocentric radial velocity of km/s.
A fourth radial velocity of km/s was obtained from observations with the Magellan Echellette Spectrograph (MagE) in 2009. This measurement will be discussed in Burgasser et al. (in prep.). Using 32 sources that were both observed with MagE and with UVES (Seifahrt et al., 2010; Reiners & Basri, 2009), we determined an average velocity offset between both instruments and reduction methods of km/s. It is small and not significant, especially when compared to the uncertainty of the MagE measurement of DE082349, and we therefore neglected it in our analysis.
3.2 Spectroscopic age indicators
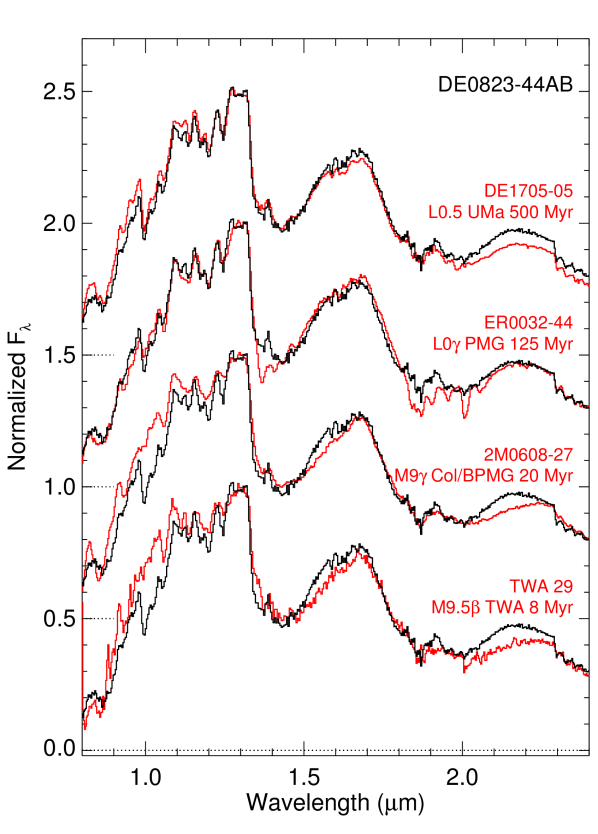
Figure 3 shows the reduced SpeX spectrum of DE082349 compared to four sources with reasonable age estimates and similar spectral types that were chosen to best match the m water band: TWA 29 (8 Myr, i.e. the age of the TW Hydrae Association), 2MASS J06085283-2753583 (2M060827, 20 Myr, i.e. the age of the Beta Pic Moving Group), EROS-MP J0032-4405 (EROS 003244, 100 Myr, i.e. the age of the Pleiades Moving Group or local association) and DENIS J170548.3-051645 (DE1705-05, 500 Myr, i.e. the age of the Ursa Majoris Moving Group). The comparison sources are from Allers & Liu (2013) and the references therein.
DE082349 does not look like a source with the young age of TWA or Beta Pic, whose members lack FeH features around 1 m and have different and band shapes. The best match seems to be EROS 003244, i.e. an age of perhaps 125 Myr (the age of the Pleiades Moving Group is still debated, see Famaey et al. 2008), a source which exhibits low-gravity features and lithium absorption (Martín et al., 1999). This is consistent with the Allers & Liu (2013) gravity-sensitive indices that point towards an intermediate gravity (INT-G), indicating an age estimate of roughly 100–300 Myr. The MagE spectra reported in Burgasser et al. (in prep.) exhibits subtle indications of low surface gravity — slightly weaker 8183/8195 Å Na i lines and a modestly stronger 8100 Å VO band than equivalently-classified dwarfs — but these are not particularly strong features and thus consistent with a source in the few 100 Myr age range.
The UVES spectrum of DE082349 shows a strong Li i absorption feature. A Li i equivalent width of was measured by direct integration of the line profile shown in Fig. 4. Such a strong Li i line has already been reported in high-resolution spectra of late-M and L dwarfs, and it indicates that lithium has not been depleted in the primary component of the binary (Pavlenko et al., 2007). The spectral resolution of our UVES spectrum is much higher than the resolution that has been used to classify L dwarfs using gravity sensitive features (Cruz et al., 2009), and we refrain from putting our data in a classification system based on low-resolution spectra. In future work we plan to compare our UVES spectra of the Sahlmann et al. (2014) targets with high-resolution synthetic spectra to obtain quantitative estimates of their surface gravities (Martín et al. in prep.).
As discussed in Magazzu et al. (1993), the presence of a strong Li i line coupled with the effective temperature of DE082349 already indicates that it must have a substellar mass lower than about 0.065 solar masses and a relatively young age between 100 and 1000 Myr. A more precise estimate on the age of DE082349 using lithium and other age indicators is presented in Sect. 3.4.

3.3 Spectral binarity
Unresolved ultracool binaries with late-M/L dwarf and T dwarf components can be discovered and characterised by disentangling the spectral features of individual components in their combined-light spectra (e.g. Burgasser 2007). For DE082349, the estimated component masses from Sahlmann et al. (2013) for an age of 1 Gyr suggested that the secondary of this system could be a T dwarf. However, we do not see the -band ‘dip’ feature commonly present in combined-light L/T binary spectra, only a slight excess in the 2.05 and 2.2 m region.
We nevertheless applied the methods described in Burgasser et al. (2010) and compared the spectrum of DE082349 to binary templates constructed from L and T dwarf spectra in the SpeX Prism Library333http://www.browndwarfs.org/spexprism (SPL, Burgasser 2014). This procedure allows us to estimate the spectral types and effective temperatures of the individual components and their -band magnitude difference.
Because of the Li i absorption and its near-infrared spectrum, we know that DE082349 is relatively young. To reflect this in spectral binary fitting, we performed the analysis with three sets of templates: those with only ‘young’ sources, only ‘not young’ sources, and with ‘all’ sources. In each case, this analysis uses binary templates constructed from M9–L5 primaries and L4–T6 secondaries in the SPL, where individual component spectra were scaled to the absolute -band magnitude – spectral type relation of Dupuy & Liu (2012). The F test was applied to compare the quality of different fits, which relies on the assumption of Gaussian uncertainties444Note that the used prescription (Eq. (1) in Burgasser et al. 2010) does not account for the noise spectrum of the template, because this would bias the result towards the most noisy templates.. The young sources were selected as having previously identified signatures of low surface gravity (e.g. Cruz et al. 2009; Allers & Liu 2013), however this sample is dominated by sources older than 100 Myr. The ‘not young’ sample excludes these young sources.
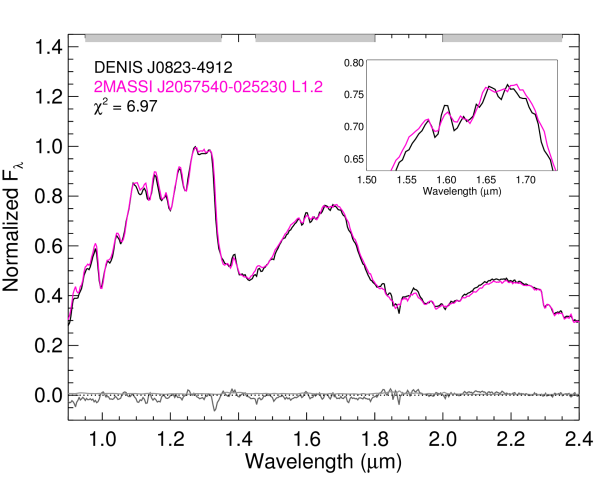
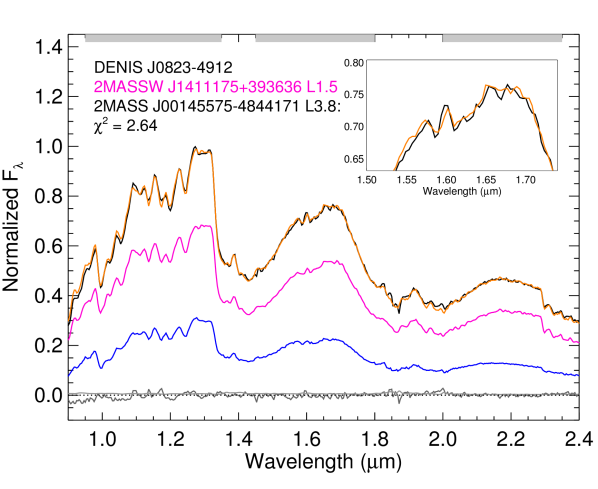
For both the ‘young’ and ‘all’ sets of templates, the best single match to the spectrum of DE082349 is that of the L1.5 2MASS J20575409-0252302 (hereafter 2M205702; Cruz et al. 2003; Burgasser et al. 2004; Allers & Liu 2013), which is shown in Fig. 5. The best-fit binary template for the unrestricted template set (‘all’) is shown in the top panel of Fig. 6. Is is a combination of the L1.5 2MASSW J1411175+393636 (Kirkpatrick et al., 2000) and the L2.5 pec 2MASS J00145575-4844171 (Kirkpatrick et al., 2008), where the latter’s near-infrared appearance classifies it closer to a spectral type of L4. This provides a significantly better match than the spectrum of 2M205702, particularly in the shape of the 2.1 m -band peak (likely due to stronger H2 absorption in the secondary), so that the single template model is rejected with a confidence of 99.9 % on the basis of the F test. The influence of the companion on the blended light spectrum is thus clearly detected.
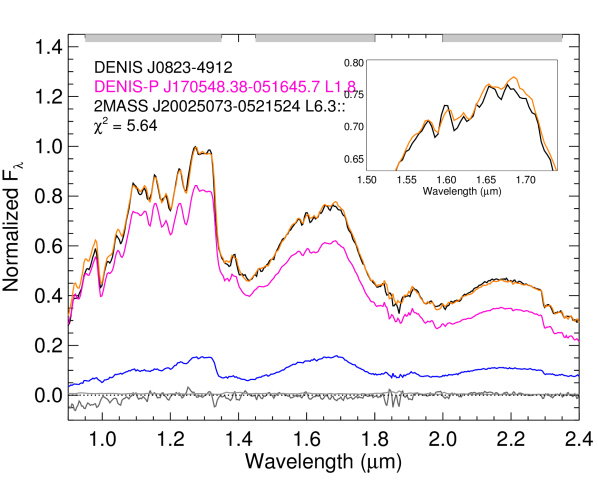
For the ‘young’ template set, the bottom panel of Fig. 6 shows the best-fit young binary template, a combination of DENIS-P J170548.4-051645.7 (DE170505, Kendall et al. 2004) and 2MASS J20025073-0521524 (2M200205, Cruz et al. 2007). The addition of the L6 fills in the excess flux at -band, and this binary template provides a significantly better match than the spectrum of 2M205702. The single template model is rejected with a confidence of 75 % on the basis of the F test.
To obtain the parameters of DE082349 and their confidence intervals, we combine all template fits and assign them relative weights according to their values to compute weighted average values with uncertainties like in Burgasser et al. (2010). The results are summarised in Table 2, which also lists the number of available binary templates and the F-test confidence. Effective temperatures were derived using the relations of Looper et al. (2008) and include an additional 0.5 spectral subtype uncertainty for optically classified sources. We measured the 2MASS magnitudes for both components of the binary templates and used the Schmidt et al. (2010) relation between spectral type and SDSS – 2MASS colour to obtain estimates for the SDSS magnitude difference between primary and secondary. We found that this is indistinguishable from integrating the Bessel or the SDSS bandpasses from the template spectra directly. The uncertainties are dominated by scatter in the viable sources, thus . For every individual spectral fit, we also computed bolometric corrections (Liu et al., 2010) for the components of the spectral templates and estimated the -band magnitude difference . We used these to compute the component bolometric luminosities based on the system’s combined light absolute MKO magnitude, obtained from absolute 2MASS and the MKO–2MASS correction from the spectrum. The uncertainty in includes 0.08 mag uncertainty in the -band bolometric correction.
| ‘young’ | ‘not young’ | ‘all’ | |
|---|---|---|---|
| # Primaries | 59 | 381 | 440 |
| # Secondaries | 28 | 341 | 369 |
| # Binaries | 1 634 | 128 868 | 161 121 |
| Primary SpT | L | L | L |
| Secondary SpT | L | L | L |
| Primary (K) | |||
| Secondary (K) | |||
| Primary () | |||
| Second. () | |||
| (mag) | |||
| F-test conf. (%) | 75 | 99.9 | 99.9 |
In all cases, the spectral types of the primary and secondary component are consistent with L1.5 and L5, respectively. All other properties are also derived consistently within their uncertainties for different template sets. For the ‘not young’ and ‘all’ sets, the single template model is rejected with a confidence of 99.9 %, which we interpret as a significant detection of the companion in the blended light spectrum. For the ‘young’ templates, the rejection confidence is 75 %, which would be considered insufficient evidence of (young) multiplicity based on spectroscopy alone. However, this statistic is skewed by the small number of young templates available in the SPL, and spectral binary ‘significance’ is less relevant since we already know that this system is a binary. We can still use the F-statistic to weight the spectral types from this analysis, which are in agreement with the ‘not young’ and ‘all’ templates samples. The high significance of the F test with ‘all’ templates may suggest that spectral binary fitting can be a viable procedure for detecting L+L spectral type binary systems. We caution, however, that the binarity of DE082349 was established with astrometry, which simplifies the interpretation of the spectral fitting results.
Because we know that DE082349 is relatively young, we adopt the parameters determined with the young templates. This yields component spectral types of L1.50.6 and L5.51.1 and effective temperatures of K and K for the primary and secondary components of DE082349, respectively. The corresponding magnitude difference of is valid for the passband of our FORS2 observations.
3.4 Constraints on age and physical parameters
The determination of individual effective temperatures in the previous section allows us to employ models of (sub-)stellar evolution to set constraints on the system’s age and its properties. The first comes from the detection of Li i absorption in the spectrum, which implies a mass of for the primary. Figure 7 shows how this translates into an upper age limit of 0.5 Gyr when coupled to the primary’s effective temperature and the DUSTY (Chabrier et al., 2000) evolutionary models.

Additional constraints can be derived from the photocentric orbit, which was measured in the -band (I_Bessel filter of FORS2, centred at 760 nm). Because of the moderate magnitude difference between the two components of DE082349, we have to take into account the light contribution of the companion if we want to determine the barycentric orbit size that relates to the system’s mass function. The fractional mass
| (2) |
and the fractional luminosity in the observation passband
| (3) |
where is the magnitude difference, define the relationship between the semimajor axis of the photocentre orbit and the semimajor axis of the relative orbit, both measured in mas:
| (4) |
An independent constraint on the relative semimajor axis is given by Kepler’s law:
| (5) |
were is the gravitational constant, is measured in metres and is in seconds. The relation between and is given by the parallax. Any combination of the unknown parameters , , and has to satisfy Eqs. 4 and 5, which are constrained by the measured quantities , , and the parallax . We used the DUSTY and Saumon & Marley (2008) models to impose theoretical relationships between effective temperature or bolometric luminosity and mass as a function of age, which is the parameter we want to constrain.
For every accepted binary template in the previous section, we derived theoretical component masses on the basis of the effective temperatures and combined them with the estimated -band magnitude difference and Eqs. 2–5 to compute the expected photocentric orbit sizes for a range of ages. For every age, we determined the effective orbit size and its uncertainty from the weighted average and the weighted standard deviation, respectively, where again we used the weights corresponding to the values of the spectral binary fits. When needed, the models were interpolated linearly in effective temperature, mass, or age.
| Model | R | Age | |||
|---|---|---|---|---|---|
| (Myr) | () | () | |||
| DUSTY | [91,473] | [0.028,0.060] | [0.018,0.044] | [0.65,0.74] | |
| DUSTY | |||||
| SM08a𝑎aa𝑎aSaumon & Marley (2008). | [110,568] | [0.031,0.063] | [0.020,0.045] | [0.65,0.71] | |
| SM08 | |||||
| SM08 | b𝑏bb𝑏bThese results were obtained when considering a systematic offset in the model that corresponds to making a brown dwarf of a given mass 0.3 dex brighter in terms of . | ||||
| DUSTY | [83,342] | [0.034,0.054] | [0.022,0.039] | [0.64,0.73] | |
| DUSTY | |||||
| SM08 | [86,428] | [0.035,0.060] | [0.022,0.043] | [0.64,0.71] | |
| SM08 |
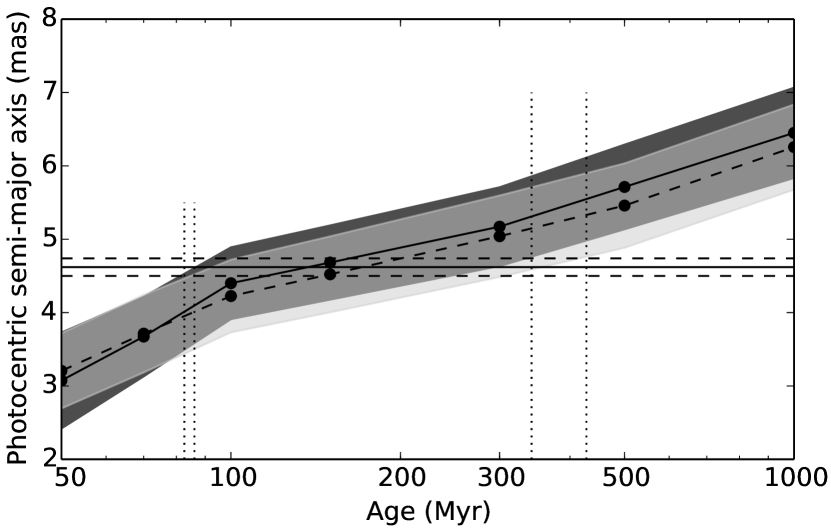
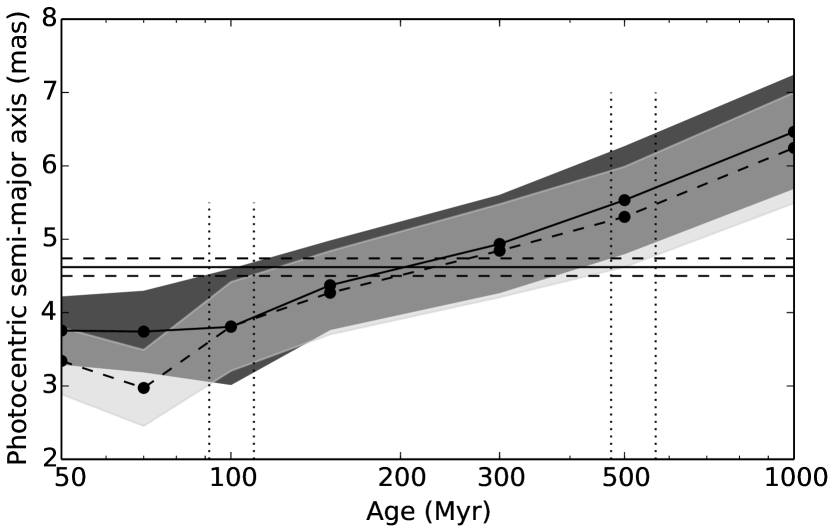
Figure 8 shows the estimated orbit size a function of age. Using the DUSTY models results in slightly larger values compared to the Saumon & Marley (2008) models. The measured orbit size yields an additional constraint on the system age. To address the effects of potential systematic differences between spectral type – effective temperate relations for young and normal sources, which could be relevant in the case of DE082349, we repeated this analysis using the bolometric luminosities to obtain theoretical masses, leading to similar results, see Figure 9.
Table 3 lists the numerical results for all configurations, which give an overall consistent picture of DE082349 with an age of 100–500 Myr, primary mass of , companion mass of , and a mass ratio . On average, the bolometric luminosity method yields a slightly older age range, but all results agree well with the upper age limit of 500 Gyr set by the Li i detection. A typical example of best-fit values is an age of Myr, masses of and , and a mass ratio of (obtained using Saumon & Marley (2008) and bolometric luminosities.) These age estimates are consistent with the INT-G surface gravity classification and the quality of gravity-sensitive features present in the near-infrared and optical spectra.
Finally, the age and mass parameters that we derived for DE082349 fall into a range where the results of Dupuy et al. (2014) suggest that theoretical models underpredict the luminosities of brown dwarfs. To quantify the effect that such systematic errors would have on our results, we introduced an 0.3 dex offset in the Saumon & Marley (2008) bolometric luminosities that would make a BD with given mass and age 2 times brighter in , an amplitude that corresponds to observations (Dupuy et al., 2009). When including the offset, the resulting acceptable age range of DE082349 is shifted to 150–860 Myr, but the component masses remain the same, see Table 3. Because an upper age limit is set by the Li i detection, we conclude that such a systematic model error has negligible effect on the age and mass properties we derive for DE082349.
3.5 Rotation
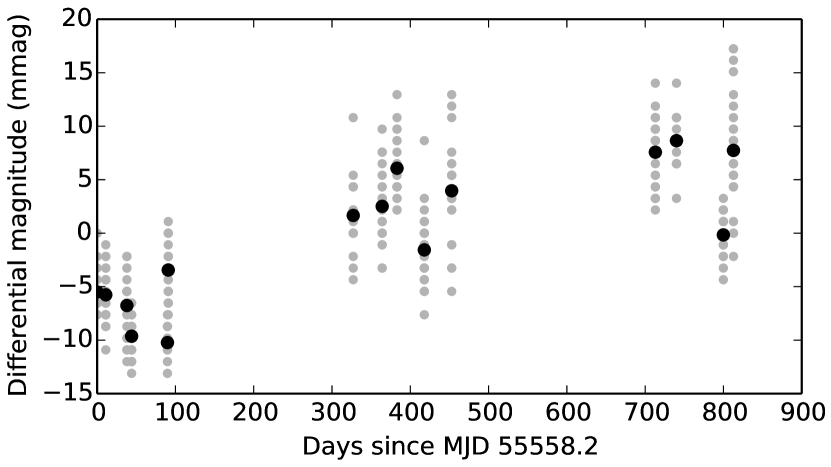
Using the NIRSPEC infrared spectra, we measured a mean projected rotational velocity of km s-1, which is comparable to that found for other field L1.5 dwarfs (Reiners & Basri, 2008). If the binary orbit orientation ( = 0.79) coincides with the spin axis of the primary, the actual rotational velocity is km s-1. We performed a periodogram analysis of the optical variability of DE082349 shown in Fig. 10, but found no evidence for periodic variations at correspondingly short rotation periods (3 h for a Jupiter-sized body). We only noticed a slight variation of 10 mmag over 800 days.
3.6 Radial velocity orbit
Figure 11 shows the radial velocity measurements (see Table 4) and the expected radial velocity curve of DE082349A shifted by the systemic velocity km s-1 that we modelled as a constant offset to the measurements. We assumed masses of and , but the curve is essentially the same for a younger or older configuration, e.g. and . The available measurements are compatible with the shown curve, which allows us to conclude that we resolved the ambiguity of 180° in inclination and longitude of ascending node, which means that the values reported in Table 1 are accurate. More radial velocity measurements would be needed to independently constrain the system parameters.


| Instr. | Date | Epoch | RV | |
|---|---|---|---|---|
| (MJD) | (km/s) | (km/s) | ||
| MagE | 2008-01-08 | 54838.21756 | ||
| UVES | 2013-10-07 | 56572.33321 | ||
| NIRSPEC | 2014-04-13 | 56760.22524 | ||
| NIRSPEC | 2014-12-08 | 56999.55533 |
4 Discussion
Young sources in the solar neighbourhood are often found in associations that have similar kinematic properties. Since all relevant quantities, i.e. coordinates, parallax, proper motions, and radial velocity, are now known for DE082349, we examined its potential membership in a young association using the BANYAN II web tool (Gagné et al., 2014). According to BANYAN II, DE082349 has a 100 % probability of belonging to the field population. The probability of belonging to one of the 7 young associations probed is reported as 0.00 %.
DE082349 thus appears isolated in terms of membership, although there may exist numerous very-low-mass few-member young associations that are not recognised yet in the solar neighbourhood. Searches for young very-low-mass stars outside star-forming regions indicate that they are typically near larger star-forming regions but not inside them (Martin & Kun, 1996; Valdivielso et al., 2009).
Another consequence of the new age estimate is related to the mass ratio () of the DE082349 binary that had a reported value of 0.36 derived under the assumption of a system age of 1 Gyr (Sahlmann et al., 2013). With the characterisation presented here, the primary mass is lower but the mass ratio is higher in the range of 0.66–0.74. This system appears now more similar to the bulk of known ultracool dwarf binaries, whose mass ratio distribution is dominated by systems with (Burgasser et al., 2007). However, its mass ratio is still uncommon and lies in the tail of the -distribution of field brown dwarf binaries (e.g. Liu et al., 2010). The estimated companion mass in this binary system remains in the range of 30 Jupiter masses, which corresponds to the most massive planets found around Sun-like stars (Sahlmann et al., 2011).
5 Conclusions
We have presented the detailed characterisation of the tight brown dwarf binary system DE082349. After the orbit discovery with optical ground-based astrometry, we obtained follow-up optical and infrared spectroscopy. The combination of spectral modelling with age indicators and evolutionary models leads us to the following conclusions:
-
•
DE082349 is a system composed of two brown dwarfs with spectral types of L1.50.6 and L5.51.1 that orbit each other in days.
-
•
The spectrum of this system is significantly better matched to a binary template than a single spectral template, providing an indirect detection of the companion in the near-infrared. Based on the classification of the templates, we infer the components’ effective temperatures to be K and K.
-
•
We estimate the age of the system to be in the range of 80–500 Myr, which is supported by the detection of Li i absorption in the optical spectrum and by the properties of the near-infrared spectrum. Refined upper and lower age bounds were derived from the measured photocentric orbit size and theoretical relationships between mass and effective temperature or bolometric luminosity.
-
•
DE082349 does not appear to belong to any of the known nearby young associations.
-
•
Evolutionary models predict component masses in the ranges of and with a mass ratio of . Both components are thus substellar objects below the lithium-burning mass limit and may have masses comparable to the most massive planets found around Sun-like stars.
At a distance of 20.7 pc, DE082349 is a rare example of a nearby brown dwarf binary with well-characterised orbit, component properties, and age.
Acknowledgements.
J.S. is supported by an ESA Research Fellowship in Space Science. A.J.B. acknowledges support by the Tri-continental Talent programme (CEI Canarias: Campus Atlántico Tricontinental). We thank our referee, T. Dupuy, for a thorough review of our work. This research made use of the databases at the Centre de Données astronomiques de Strasbourg (http://cds.u-strasbg.fr), NASA’s Astrophysics Data System Service (http://adsabs.harvard.edu/abstract_service.html), the paper repositories at arXiv, the M, L, T, and Y dwarf compendium housed at DwarfArchives.org, the SpeX Prism Spectral Libraries at http://www.browndwarfs.org/spexprism, and of Astropy, a community-developed core Python package for Astronomy (Astropy Collaboration et al., 2013). Portions of the data presented herein were obtained at the W. M. Keck Observatory, which is operated as a scientific partnership among the California Institute of Technology, the University of California and the National Aeronautics and Space Administration. The Observatory was made possible by the generous financial support of the W. M. Keck Foundation. The authors wish to recognise and acknowledge the very significant cultural role and reverence that the summit of Mauna Kea has always had within the indigenous Hawaiian community. We are most fortunate to have the opportunity to conduct observations from this mountain.References
- Allard et al. (2011) Allard, F., Homeier, D., & Freytag, B. 2011, in Astronomical Society of the Pacific Conference Series, Vol. 448, 16th Cambridge Workshop on Cool Stars, Stellar Systems, and the Sun, ed. C. Johns-Krull, M. K. Browning, & A. A. West, 91
- Allers & Liu (2013) Allers, K. N. & Liu, M. C. 2013, ApJ, 772, 79
- Appenzeller et al. (1998) Appenzeller, I., Fricke, K., Fürtig, W., et al. 1998, The Messenger, 94, 1
- Astropy Collaboration et al. (2013) Astropy Collaboration, Robitaille, T. P., Tollerud, E. J., et al. 2013, A&A, 558, A33
- Blake et al. (2010) Blake, C. H., Charbonneau, D., & White, R. J. 2010, ApJ, 723, 684
- Burgasser (2007) Burgasser, A. J. 2007, AJ, 134, 1330
- Burgasser (2014) Burgasser, A. J. 2014, in Astronomical Society of India Conference Series, Vol. 11, 7–16
- Burgasser et al. (2010) Burgasser, A. J., Cruz, K. L., Cushing, M., et al. 2010, ApJ, 710, 1142
- Burgasser et al. (2004) Burgasser, A. J., McElwain, M. W., Kirkpatrick, J. D., et al. 2004, AJ, 127, 2856
- Burgasser et al. (2007) Burgasser, A. J., Reid, I. N., Siegler, N., et al. 2007, Protostars and Planets V, 427
- Chabrier et al. (2000) Chabrier, G., Baraffe, I., Allard, F., & Hauschildt, P. 2000, ApJ, 542, 464
- Cruz et al. (2009) Cruz, K. L., Kirkpatrick, J. D., & Burgasser, A. J. 2009, AJ, 137, 3345
- Cruz et al. (2007) Cruz, K. L., Reid, I. N., Kirkpatrick, J. D., et al. 2007, AJ, 133, 439
- Cruz et al. (2003) Cruz, K. L., Reid, I. N., Liebert, J., Kirkpatrick, J. D., & Lowrance, P. J. 2003, AJ, 126, 2421
- Cushing et al. (2004) Cushing, M. C., Vacca, W. D., & Rayner, J. T. 2004, PASP, 116, 362
- Dekker et al. (2000) Dekker, H., D’Odorico, S., Kaufer, A., Delabre, B., & Kotzlowski, H. 2000, in SPIE, Vol. 4008, 534–545
- Dupuy & Liu (2012) Dupuy, T. J. & Liu, M. C. 2012, ApJS, 201, 19
- Dupuy et al. (2009) Dupuy, T. J., Liu, M. C., & Ireland, M. J. 2009, ApJ, 692, 729
- Dupuy et al. (2014) Dupuy, T. J., Liu, M. C., & Ireland, M. J. 2014, ApJ, 790, 133
- Famaey et al. (2008) Famaey, B., Siebert, A., & Jorissen, A. 2008, A&A, 483, 453
- Gagné et al. (2014) Gagné, J., Lafrenière, D., Doyon, R., Malo, L., & Artigau, É. 2014, ApJ, 783, 121
- Kendall et al. (2004) Kendall, T. R., Delfosse, X., Martín, E. L., & Forveille, T. 2004, A&A, 416, L17
- Kirkpatrick et al. (2008) Kirkpatrick, J. D., Cruz, K. L., Barman, T. S., et al. 2008, ApJ, 689, 1295
- Kirkpatrick et al. (2000) Kirkpatrick, J. D., Reid, I. N., Liebert, J., et al. 2000, AJ, 120, 447
- Kramida et al. (2012) Kramida, A., Ralchenko, Y., & Reader, J. 2012, in APS Division of Atomic, Molecular and Optical Physics Meeting Abstracts, D1004
- Lazorenko et al. (2014) Lazorenko, P. F., Sahlmann, J., Ségransan, D., et al. 2014, A&A, 565, A21
- Liu et al. (2010) Liu, M. C., Dupuy, T. J., & Leggett, S. K. 2010, ApJ, 722, 311
- Livingston & Wallace (1991) Livingston, W. & Wallace, L. 1991, An atlas of the solar spectrum in the infrared from 1850 to 9000 cm-1 (1.1 to 5.4 micrometer)
- Looper et al. (2008) Looper, D. L., Gelino, C. R., Burgasser, A. J., & Kirkpatrick, J. D. 2008, ApJ, 685, 1183
- Magazzu et al. (1993) Magazzu, A., Martin, E. L., & Rebolo, R. 1993, ApJ, 404, L17
- Martín et al. (1999) Martín, E. L., Delfosse, X., Basri, G., et al. 1999, AJ, 118, 2466
- Martín et al. (2006) Martín, E. L., Guenther, E., Zapatero Osorio, M. R., Bouy, H., & Wainscoat, R. 2006, ApJ, 644, L75
- Martin & Kun (1996) Martin, E. L. & Kun, M. 1996, A&AS, 116, 467
- McLean et al. (2000) McLean, I. S., Graham, J. R., Becklin, E. E., et al. 2000, in SPIE, Vol. 4008, 1048–1055
- Pavlenko et al. (2007) Pavlenko, Y. V., Jones, H. R. A., Martín, E. L., et al. 2007, MNRAS, 380, 1285
- Phan-Bao et al. (2008) Phan-Bao, N., Bessell, M. S., Martín, E. L., et al. 2008, MNRAS, 383, 831
- Rayner et al. (2003) Rayner, J. T., Toomey, D. W., Onaka, P. M., et al. 2003, PASP, 115, 362
- Reiners & Basri (2008) Reiners, A. & Basri, G. 2008, ApJ, 684, 1390
- Reiners & Basri (2009) Reiners, A. & Basri, G. 2009, ApJ, 705, 1416
- Sahlmann et al. (2014) Sahlmann, J., Lazorenko, P. F., Ségransan, D., et al. 2014, A&A, 565, A20
- Sahlmann et al. (2013) Sahlmann, J., Lazorenko, P. F., Ségransan, D., et al. 2013, A&A, 556, A133
- Sahlmann et al. (2011) Sahlmann, J., Ségransan, D., Queloz, D., et al. 2011, A&A, 525, A95+
- Saumon & Marley (2008) Saumon, D. & Marley, M. S. 2008, ApJ, 689, 1327
- Schmidt et al. (2010) Schmidt, S. J., West, A. A., Hawley, S. L., & Pineda, J. S. 2010, AJ, 139, 1808
- Seifahrt et al. (2010) Seifahrt, A., Reiners, A., Almaghrbi, K. A. M., & Basri, G. 2010, A&A, 512, A37+
- Vacca et al. (2003) Vacca, W. D., Cushing, M. C., & Rayner, J. T. 2003, PASP, 115, 389
- Valdivielso et al. (2009) Valdivielso, L., Martín, E. L., Bouy, H., et al. 2009, A&A, 497, 973