A2 Collaboration at MAMI
First measurement of target and beam-target asymmetries in the reaction
Abstract
The first data on target and beam-target asymmetries for the reaction at photon energies from 1050 up to 1450 MeV are presented. The measurements were performed using the Crystal Ball and TAPS detector setup at the Glasgow tagged photon facility of the Mainz Microtron MAMI. The general assumption that the reaction is dominated by the amplitude is confirmed. The data are in particular sensitive to small contributions from other partial waves.
pacs:
25.20.Lj, 13.60.Le, 14.20.GkI Introduction
Photoinduced production of pairs is a relatively new topic in particle physics. Nevertheless, since modern photon detectors in combination with high intensity photons beams have become available, a large amount of data, primarily angular and momentum distributions have been measured. The production of the meson pairs is sensitive to sequential decays of baryon resonances such as and . Hence, meson pair production is a complementary tool to study nucleon and excitation spectra providing additional information compared to single or photoproduction. Remarkably, till now no major disagreements between experimental data and state-of-the-art model predictions for the reaction have been observed. The main reason for this is due to the fact that this reaction seems to be dominated by just a single partial-wave amplitude. Several independent studies Doring ; HornEPJ ; Horn1940 ; FOT ; FKLO ; Aphi ; Anis12 ; W_LM ; Gutz2014 agree with the assumption that the reaction mainly proceeds via excitation of the amplitude with a moderate admixture of positive parity resonances and generally insignificant contributions from nonresonant Born terms. As a consequence, even though the models differ from each other in detail, they provide similar results for many observables. In order to disentangle small components in the reaction amplitude, it is therefore important to study spin observables which are especially sensitive to interference terms. The situation is similar to single photoproduction at energies up to , which is dominated by the magnetic multipole amplitudes due to the excitation of the resonance or single production close to threshold, which is dominated by the resonance.
The possibility of model independent partial-wave analysis of a so-called “complete” set of measurements is often one of the main motivations given for polarization measurements. Such a “complete experiment,” which is a complex and extensive task for single meson photoproduction, is even more difficult for reactions in which two mesons are emitted. However, in some cases it is possible to study the partial wave content using a restricted number of observables, making some physically reasonable general assumptions about the production mechanisms. Some polarization observables for were already measured and analyzed in earlier papers Aphi ; Ajaka ; Gutz1 ; Gutz2 ; DorMeiss . Here we report the first measurements of asymmetries obtained using a transversely polarized proton target. Our main objectives are to check the consistency of the experimental target and beam-target asymmetry data with the dominant production mechanism and to investigate small contributions from partial waves other than the dominant amplitude.
II General formalism
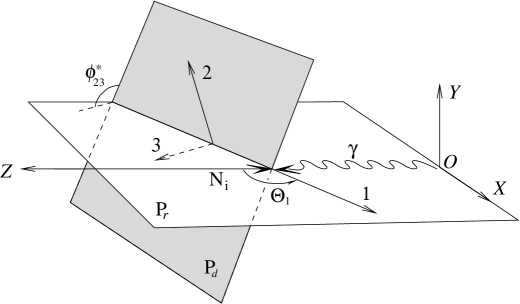
The general formalism for photoproduction of two pseudoscalar mesons on nucleons has been developed in Refs. RobertsOed and FiAr11 , where the formulas for different polarization observables are presented. In the expressions below, we denote the final state particles as 1, 2, and 3 and consider the particle selection , with reference to the coordinate system presented in Fig. 1. The results are presented for three independent particle sets, corresponding to the numbering , , and . In each case the axis is directed along the photon momentum. The and axes are chosen such that the momentum of particle 1 has a positive projection and is orthogonal to the axes. As independent kinematical variables we choose angles of particle 1 in the overall center-of-mass (cm) system, together with angles of particle 2 in the cm system of the pair and their corresponding invariant mass .
If the target nucleon is transversally polarized and the incident photon beam is circularly polarized, the cross section can be written in the form (see Eq. (57) of Ref. FiAr11 )
| (1) | |||
where and denote the degree of circular beam and transverse target polarization, is the beam helicity, and is the azimuthal angle of the target polarization vector in a coordinate frame fixed to the reaction plane. The unpolarized differential cross section is denoted as . The circular photon asymmetry has already been discussed in detail in Ref. Aphi . For the asymmetries we have used the notation of Ref. RobertsOed . As is evident from Eq. (II), for the totally exclusive fivefold cross section there are two independent transverse target asymmetries ( and ) and two independent beam-target asymmetries ( and ). Table 1 schematically explains how these asymmetries are separated by a proper variation of the photon and proton polarization parameters. The observables and are equivalent to the and asymmetries in single pseudoscalar meson photoproduction.
| Beam | Target | |
|---|---|---|
| x | y | |
III Model
For the interpretation of our results we adopted an isobar model approach as used, for example, for double pion photoproduction in Refs. Oset ; Laget ; Ochi ; Mokeev ; FA . The main ingredients are described in detail in Refs. FOT ; FKLO . Here we limit ourselves to a brief overview needed for the discussion below.
The reaction amplitude contains background and resonance terms
| (2) |
where each resonance state is determined by spin-parity and isospin .

The resonance sector [diagrams (g) and (h) in Fig. 2] includes only the states with isospin . As already noted, analysis of the existing data for is in general agreement with the assumption that in the energy region GeV the reaction is dominated by the partial wave. In the present model, the latter is populated by the and states. The resonance was introduced into the reaction in Ref. HornEPJ . In Ref. FKLO it was needed in order to maintain the importance of the wave at energies above 1.3 GeV, which otherwise would rapidly decrease with increasing energy. Other resonances entering the amplitude are , , , and .
According to the isobar model concept, each resonance state generates the final state via intermediate transitions to and configurations. In this respect the resonance terms in (2) are given by a coherent sum of two amplitudes,
| (3) |
where the isobars and are denoted as and , respectively. Each term in (3) has the form
| (4) |
with being the total center-of-mass energy. The quantities are helicity functions determining the transition . The propagators were calculated in the nonrelativistic form
| (5) |
The total energy dependent width is a sum of the partial decay widths in , and channels:
| (6) |
The latter two, and , were calculated with explicit inclusion of the finite widths of the and isobars. Finally, the functions in Eq. (III) depending on the three-momenta of the final particles describe decays of the resonances into the final state. As adjustable parameters the Breit-Wigner masses , as well as the products (), were used in FKLO . The total widths of resonances were not varied. The closeness of the resonances to the production threshold, especially of , results in rather weak sensitivity of the cross section to their widths. Therefore the values of the total widths at the resonance position were taken directly from the Particle Data Group (PDG) compilation PDG or from the references cited there. For the same reason, the masses of the resonances, rated by four or three stars, were varied around their PDG values.
The slowly varying background is presented in Fig. 2 by the diagrams (a) to (f). Only those diagrams were taken into account whose contribution is appreciable. We have omitted, for example, the terms with and isobars in the channel. The diagrams (b) and (c) contain the unknown coupling constants in the and vertices. Since the corresponding terms have rather small impact on the calculation results, these constants were not treated as adjustable parameters and just for simplicity were fixed according to the prescription
| (7) |
As the direct calculation in Doring ; FOT ; FKLO shows, the background terms do not contribute significantly to the cross section. The system is assumed not to resonate in the energy region considered. The validity of this assumption is confirmed by the results of Ref. HornEPJ where the contribution of the resonance at energies GeV is shown to be less than 1. Furthermore, the model does not contain relative phases in the electromagnetic couplings which are sometimes used in the multipole analyses. Although these phases allow one to make the phenomenological formulation more flexible, their inclusion leads to unnecessary increase of the number of adjustable parameters.
IV Experimental setup
The experiment was performed at the MAMI C accelerator in Mainz MAMIC using the Glasgow-Mainz tagged photon facility TAGGER . Bremsstrahlung photons were produced by scattering a longitudinally polarized electron beam with an energy of 1557 MeV and a polarization degree of 80% on a 10-m-thick copper radiator. The photons are energy tagged by momentum analysis of the scattered electrons in the dipole magnet spectrometer. The resulting energy-tagged photon beam covered an energy range from 450 to 1450 MeV with an average resolution of 4 MeV. The polarization degree of the electron beam was measured periodically using Mott scattering at the laser-driven source. The beam helicity was switched randomly, with a frequency of 1 Hz, during the experiment and the orientation of the polarization vector at the radiator position was checked using Moeller scattering. In the Bremsstrahlung process, the longitudinal polarization of the electrons is transferred to the circular polarization of the emitted photons Olsen . The degree of circular photon polarization depends on the photon energy and varied from 67% at 1050 MeV to 79% at 1450 MeV.
The reaction was measured using the Crystal Ball (CB) central spectrometer CB with TAPS TAPS as a forward angle spectrometer. The full detector setup is shown schematically in Fig. 3.
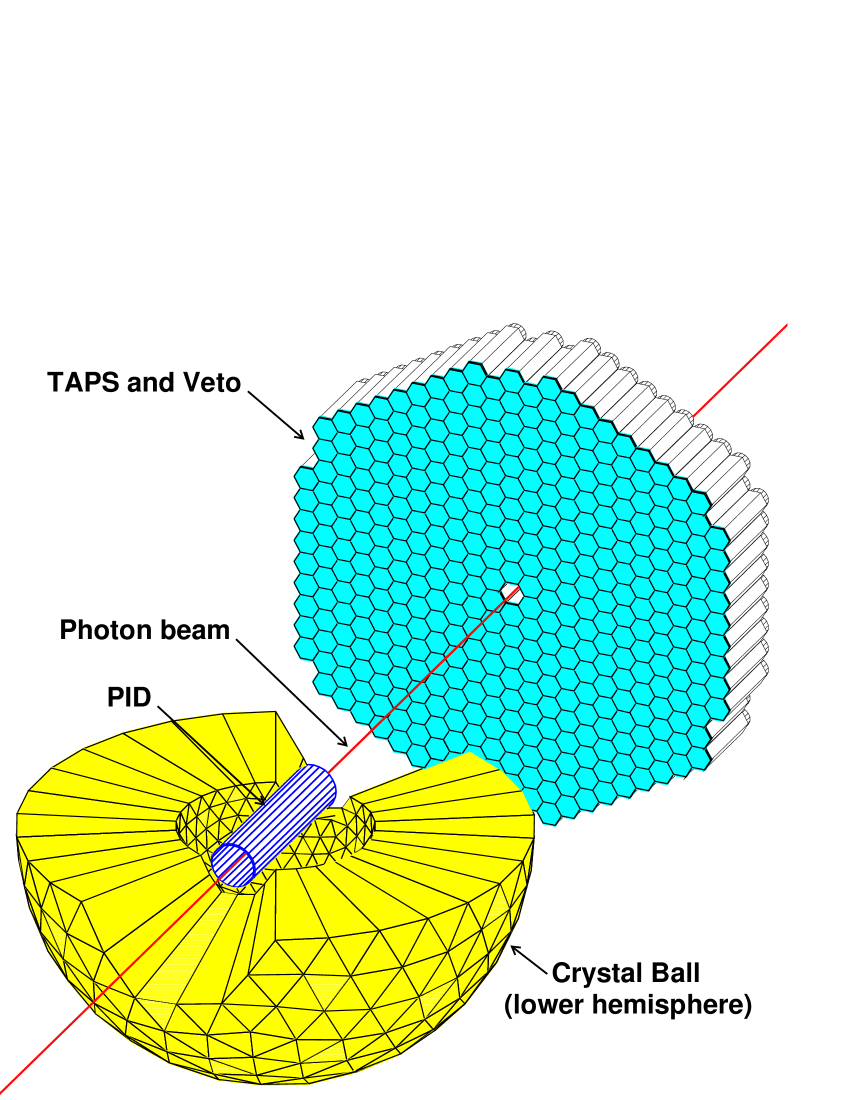
The spherical CB detector consisted of 672 optically insulated NaI(Tl) crystals with a thickness of 15.7 radiation lengths pointing towards the center of the sphere. The crystals were arranged in two hemispheres covering 93% of the full solid angle. Electromagnetic showers were reconstructed with an energy resolution of at 1 GeV. Shower directions were measured with a resolution of in the polar and in the azimuthal angle. For charged-particle identification via differential energy loss, a barrel of 24 thin scintillation detectors surrounding the target was used PID . The forward angular range was covered by the TAPS calorimeter TAPS , arranged as a planar configuration of 384 hexagonally shaped BaF2 detectors. Each detector had an inner diameter of 5.9 cm and was 25 cm long, which corresponds to 12 radiation lengths. The resolutions for the reconstruction of electromagnetic showers, were for the energy and for the direction. A 5-mm thick plastic scintillator in front of each module allows the separation of neutral and charged particles. Photons (or electrons) and hadrons can be separated by a pulse-shape analysis based on the properties of . The crystals have the fast and long components of the scintillation, the intensity of which depends on the incident particle nature. Analysis of these components gives us an additional method of particle identification. The best way to identify the charged particle species in TAPS is a time-of-flight versus cluster energy analysis. The solid angle of the combined Crystal Ball and TAPS detection system is nearly of sr.
The transversely polarized target protons were provided by a frozen-spin butanol () target Thomas . A four-layer saddle coil provided a 0.45 T holding field perpendicular to the beam axis at a current of 35 A. A dilution refrigerator keeps the target material at a temperature of 25 mK which corresponds to relaxations times of 1500 h. The 2-cm-long and 2-cm-diameter cylindrical target cell was filled with 2-mm-diameter butanol spheres with a packing fraction (filling factor) of . The target polarization was measured using the NMR techniques at the beginning and the end of each data taking period. The polarization was then calculated for each individual data file from the known exponential relaxation of the polarization. In order to reduce the systematic uncertainties, the direction of the target polarization vector was regularly reversed during the experiment. The average degree of polarization during the beam periods May-June 2010 and April 2011 was .
V Data analysis
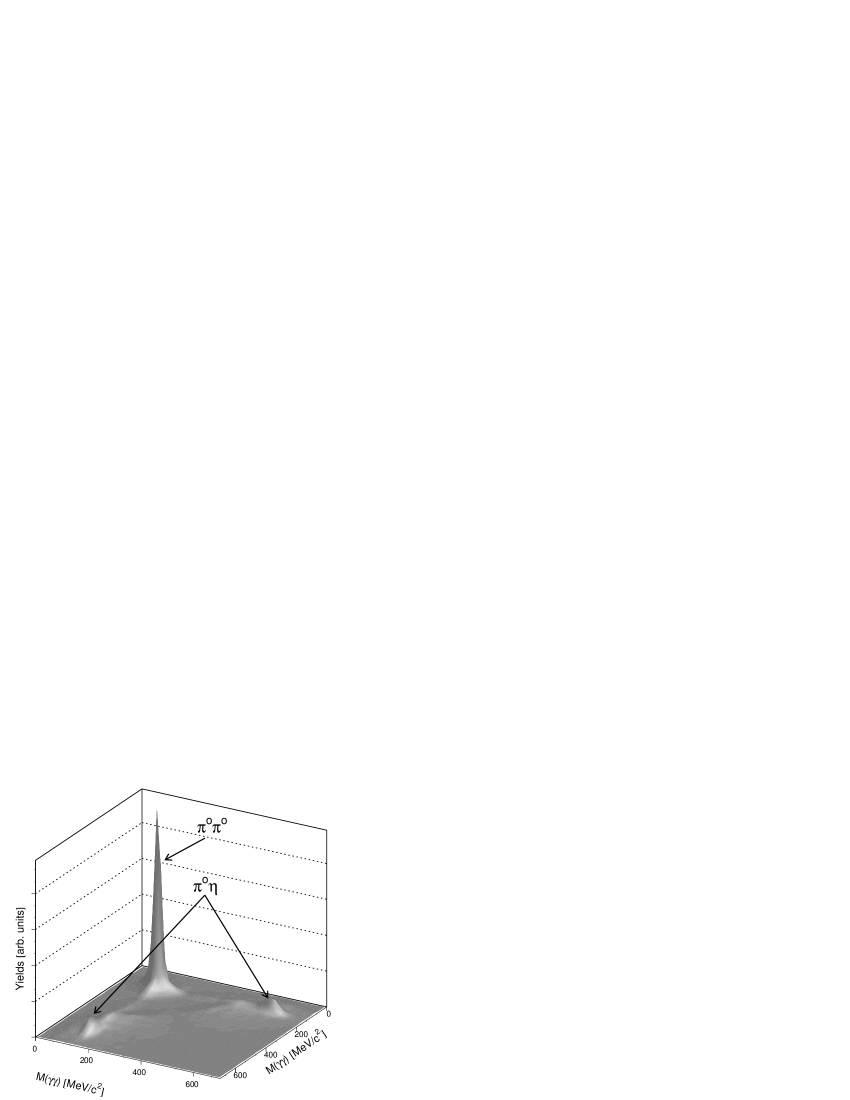
The reconstruction of the reaction is based on the two photon decays of the and the meson as described in detail in Ref. PiEtaEPJA . As a first step, events with four neutral and one or zero charged particles in the Crystal Ball and TAPS detectors were selected. The distribution of invariant masses, calculated from all possible combinations of the four neutral hits is shown in Fig. 4. As there are three independent combinations of possible pairs, this histogram has three entries per event. The distribution shows already large peak corresponding to the channel and two smaller ones from the final state. In the next step, a for both possible final states, and , was calculated for each possible permutation of the four neutral hits:
| (8) |
Here and are and masses and MeV and MeV are the corresponding invariant mass resolutions of the detector system. Each event was then assigned to either or production depending on the minimum of the values. Further selection is based on selections in the invariant mass distributions and the missing mass calculated with the assumption of a initial state and the reconstructed pair.
In principle, the polarization observables in Eq. (1) can be determined in each photon energy, angular or invariant mass bin as count rate asymmetries from the number of reconstructed events with different orientations of target spin and beam helicity:
| (9) |
| (10) |
| (11) |
| (12) |
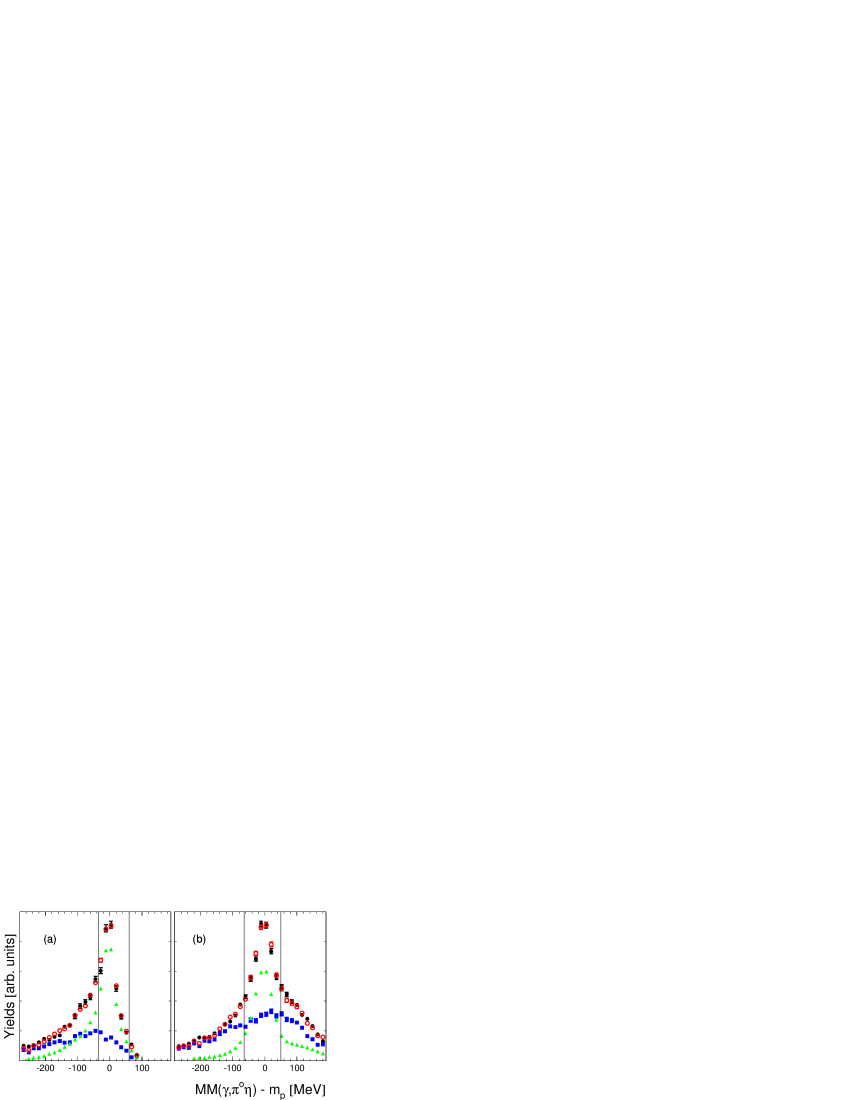
where denotes the orientation of the target polarization vector relative to the normal of the production plane and is given by the product of the beam helicity and the orientation of relative to the axis. In these asymmetries, systematic uncertainties related to the total photon flux normalization and the target filling factor cancel. However, using a butanol target has one essential disadvantage due to additional background from reactions on and nuclei. In the numerators of Eqs. (9)-(12), this background cancels because the nucleons bound in or are unpolarized. However, in order to determine the denominator, this contribution has to be taken into account. The detection of the outgoing protons and applying kinematic constraints already suppress this background significantly. In order to subtract the remaining background we analyzed photoproduction on pure carbon and liquid hydrogen targets. The corresponding distributions were scaled and added in order to fit the corresponding distribution obtained with the butanol target. Since the magnitude and the shape of the background depend on the initial beam energy and on the momenta of the final particles, this procedure was performed for each individual kinematical bin. This subtraction method is illustrated on Fig. 5 for two photon energies, which are typical for the presented data analysis. Missing mass spectra for the reaction with the butanol target are shown by the full black circles. Spectra measured with the hydrogen and carbon targets are represented by the green triangles and the blue squares respectively. Their absolute values were scaled to fit the butanol data. The red open circles represent the sum of the fitted hydrogen and carbon contributions. For further analysis only events around the proton peak, within the vertical lines, are used. The intervals were selected to optimize the signal-to-background ratio. Even in the distribution from the pure hydrogen (green triangles in Fig. 5 still some background remains. This is mainly due to misidentified reactions, split or overlapping photon clusters, and combinatoric mixing. This background is subtracted by fitting the missing mass distributions with the sum of a Gaussian and a third-order polynomial function. After subtracting the polynomial background, the distribution is found to be in excellent agreement with results of a Monte Carlo simulation of the reaction (see Fig. 4 in Ref. PiEtaEPJA ). The average detection efficiency for the reaction after all analysis steps is about 50% for beam energies from 1.05 to 1.45 GeV.
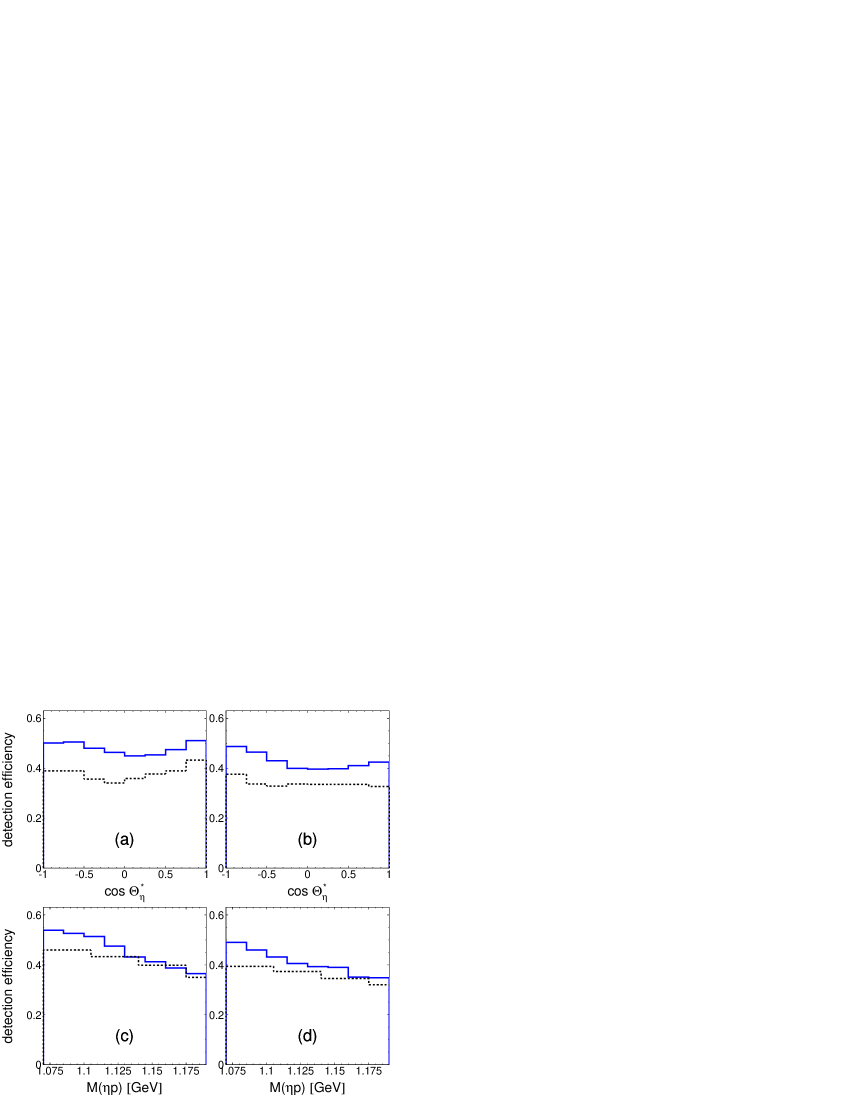
The asymmetries in each photon energy, angular or invariant mass bin were obtained as count rate asymmetries by integrating the reaction yields in Eqs. (9)-(12) over four remaining variables. This procedure is exactly valid if the acceptance does not depend on any of these variables. However, a small and smooth variation of the acceptance can be taken into account in the systematic uncertainties. Figure 6 shows as an example the efficiency as function of those kinematic variables where the strongest variation of the acceptance is observed. The typical variation is less then 3%. The influence of the acceptance variations and background subtraction on the asymmetries was estimated by varying the applied selection criteria. The observed changes in the asymmetries by 3%-6% were smaller than the statistical uncertainty. Other systematic uncertainties of the present measurement are related to the determination of the proton polarization (4%) and the beam polarization (2%). By adding all contributions in quadrature, a total systematic uncertainty of less than 8% was obtained.
VI Discussion of the results
Figures 7, 8, and 9 show the measured asymmetries as function of the various scattering angles and invariant mass combinations.
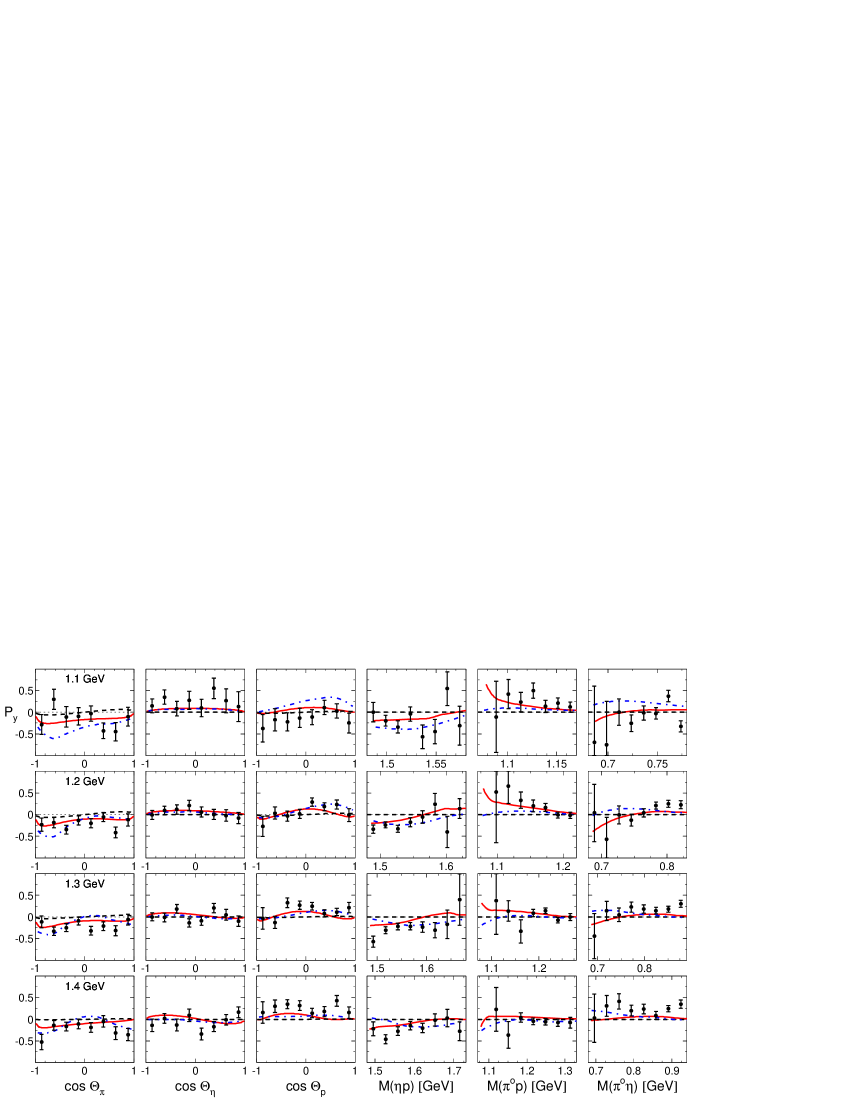
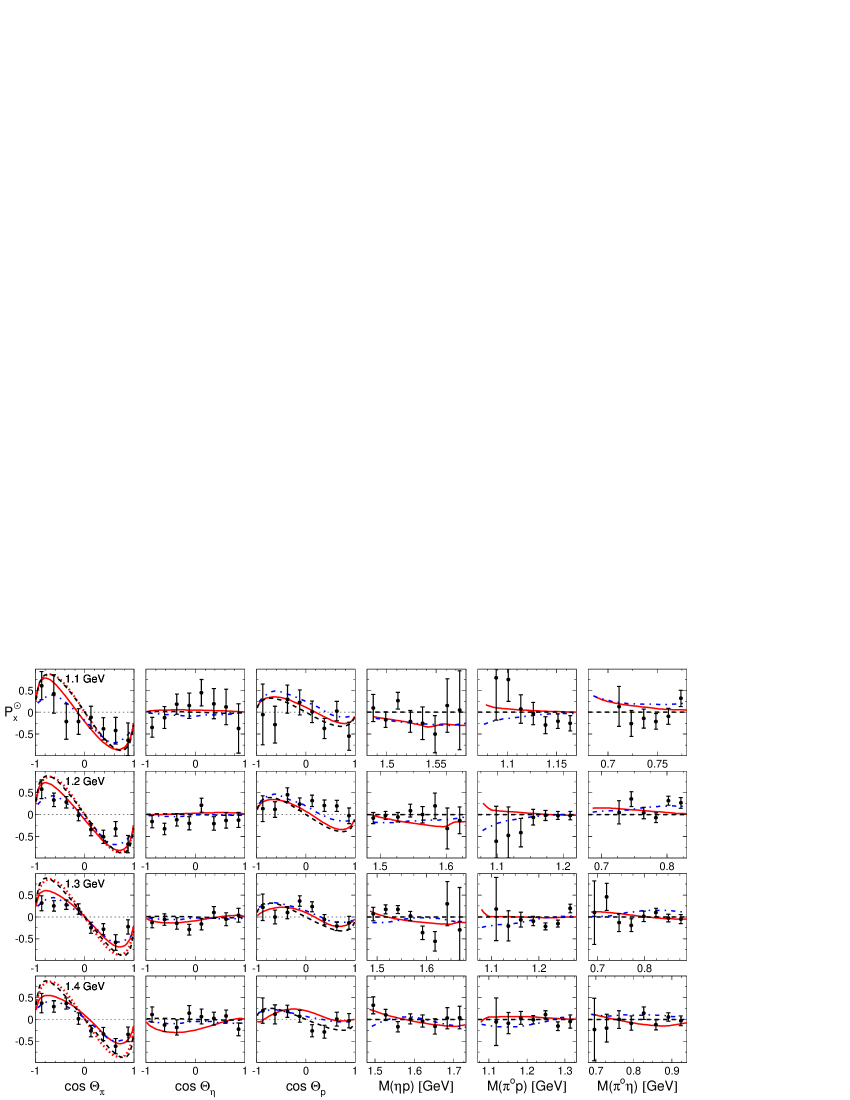
Data from the analysis are shown in columns 1 and 4. The and data are shown in columns and in columns , respectively. In this section we present a qualitative description of the reaction properties revealed by our data. A detailed partial wave analysis of the new data has started and will be published elsewhere.
As one can see in Figs. 7 and 8, both and have rather small values, except for which strongly varies with pion angle (see first column in Fig. 8). This dependence can be described to a good approximation by an odd function with a maximum amplitude of about 0.8. This peculiar behavior is a direct signature of -wave production of the configuration in the state. As noted in Sec. I this partial wave appears to dominate the reaction amplitude in a wide energy region from threshold to GeV Horn1940 ; FKLO . Assuming that the reaction proceeds exclusively via the formation of an intermediate pair in the partial wave, one obtains the following simple form for in the region of :
| (13) |
where () are the helicity amplitudes for the transition . If we further assume that PDG Eq. (13) reduces to the simpler approximation
| (14) |
The function (14) reaches its maximum value at , in general agreement with our data (see red dotted lines in the first column in Fig. 8).
It is also worth noting that, in the same -wave hypothesis of production, the behavior of should be similar (up to the possible change of sign) to that of the observable for single photoproduction in the resonance region. Indeed, assuming that the excitation is a pure magnetic dipole transition the distribution has the form
| (15) |
so that, as in the case of [see Eq. (13)], the angular dependence of is mainly governed by the factor .
Concerning the role of positive parity states, two important facts can be observed. First, the dependence of and on the invariant mass is determined exclusively by an interference of partial wave amplitudes with opposite parities. The simple model with only the amplitude therefore gives the trivial result
| (16) |
Second, if only the dominant wave is included, both and are odd functions of
| (17) |
and reach zero at . In this respect, the nonzero values of and at as well as of their distribution over the invariant mass may be viewed as a signature of the presence of partial waves with positive parity. However, as evident from Figs. 7 and 8 the deviation of the measured values from the simple rules (16) and (17) is small, indicating that the role of states besides is not large. This is in full agreement with our previous results for the unpolarized angular distribution W_LM as well as for the helicity beam asymmetry Aphi .
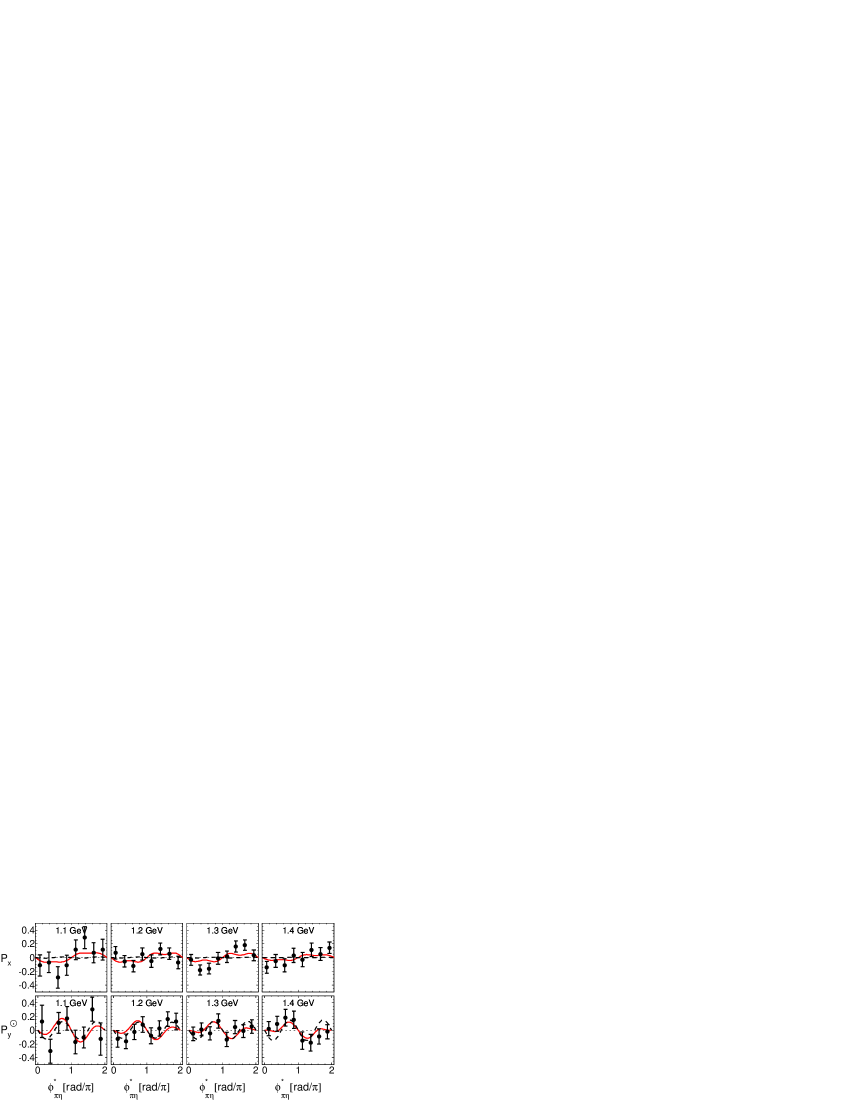
The solid lines in Figs. 7-9 show the prediction of the isobar model described in Sec. III. Here we use the parameter set (I) (see Table I in Ref. FKLO ) which was preferred since it gives the best description of the measured linear beam asymmetry Ajaka ; Gutz1 . This solution also reproduces the invariant mass distributions measured in Ajaka (see Fig. 9 in Ref. FKLO ) and describes reasonably well the data for the beam asymmetries , and presented in Refs. Aphi ; Gutz2 .
The dash-dotted lines in Figs. 7 and 8 show predictions of the Bonn-Gatchina multichannel fit Anis12 (solution BG2011-02). In contrast to FKLO , where only the data for were fitted, within the Bonn-Gatchina approach, the positions of resonances, their partial decay widths, and relative strengths were fitted simultaneously to the data sets in different channels, including single and double meson production as well as strangeness production. The application to the reaction is described in detail in Ref. HornEPJ . In this analysis some contributions from resonances, which do not enter the amplitude in FKLO , in particular the , are also included.
Both models describe the new data equally well. The present statistics do not allow any discrimination between the different model predictions in kinematic regions where they show small differences, e.g., at low values of .
The other two observables and contribute exclusively to the distribution of the cross section over the azimuthal angle and vanish in the distribution over and . In Fig. 9 we show data for the particle selection . As in Ref. Aphi the denominators of the asymmetries are averaged over the whole region. Parity conservation requires
| (18) |
Using angular momentum algebra it can be shown that if only the states with enter the amplitude (in our case resonances) the product , for both and , is proportional to and does not contain higher order harmonics. The presence of states with positive parity leads to a more complicated shape for these observables, as observed in our data.
VII Summary and conclusions
We have presented the first experimental results for the target and the beam-target asymmetries of the cross section obtained with circularly polarized photons and transversely polarized protons. The measurements were performed using Crystal Ball and TAPS spectrometers. We presented a qualitative analysis which shows that the new data for all four observables are in broad agreement with the dominance of the amplitude, confirming the theoretical interpretation of previous measurements Aphi ; W_LM and other analyses HornEPJ ; FKLO , in the region below GeV. However, the detailed distributions of the measured observables are sensitive to the contribution of small components in the reaction amplitude. Specifically an interference between and the positive parity amplitudes and is responsible for the nontrivial angular and energy dependence of the asymmetries presented.
Acknowledgments
The authors wish to acknowledge the excellent support of the accelerator group of MAMI. This material is based upon work supported by the Deutsche Forschungsgemeinschaft (SFB 443, SFB 1044); the European Community Research Activity under the FP7 program (Hadron Physics, Contract No. 227431); Schweizerischer Nationalfonds; the UK Sciences and Technology Facilities Council (STFC 57071/1, 50727/1); the U.S. Department of Energy (Offices of Science and Nuclear Physics, Grants No. DE-FG02-99-ER41110, No. DE-FG02-88ER40415, and No. DE-FG02-01-ER41194); the National Science Foundation (Grant No. PHY-1039130, IIA-1358175); NSERC (Canada); the Dynasty Foundation; TPU Grant No. LRU-FTI-123-2014; and the MSE Program “Nauka” (Project No. 3.825.2014/K).
References
- (1) M. Döring, E. Oset, and D. Strottman, Phys. Rev. C 73, 045209 (2006).
- (2) I. Horn et al., Eur. Phys. J. A 38, 173 (2008).
- (3) I. Horn et al., Phys. Rev. Lett. 101, 202002 (2008).
- (4) A. Fix, M. Ostrick, and L. Tiator, Eur. Phys. J. A 36, 61 (2008).
- (5) A. Fix, V. L. Kashevarov, A. Lee, and M. Ostrick, Phys. Rev. C 82, 035207 (2010).
- (6) V. L. Kashevarov et al., Phys. Lett. B 693, 551, (2010).
- (7) A. V. Anisovich, R. Beck, E. Klempt, V. A. Nikonov, A. V. Sarantsev, and U. Thoma, Eur. Phys. J. A 48, 88 (2012).
- (8) A. Fix, V. L. Kashevarov, and M. Ostrick, Nucl. Phys. A909, 1 (2013).
- (9) E. Gutz et al., Eur. Phys. J. A 50, 74 (2014).
- (10) J. Ajaka et al., Phys. Rev. Lett. 100, 052003 (2008).
- (11) E. Gutz et al., Eur. Phys. J. A 35, 291 (2008).
- (12) E. Gutz et al., Phys. Lett. B 687, 11 (2010).
- (13) M. Doring, E. Oset, and U.-G. Meissner, Eur. Phys. J. A 46, 315 (2010).
- (14) W. Roberts and T. Oed, Phys. Rev. C 71, 055201 (2005).
- (15) A. Fix and H. Arenhövel, Phys. Rev. C 83, 015503 (2011).
- (16) J. A. Gomez Tejedor and E. Oset, Nucl. Phys. A600, 413 (1996).
- (17) L. Y. Murphy and J. M. Laget, Daphnia Lab Report No.DAPHNIA/SPhN, 96-10, 1996 (unpublished).
- (18) K. Ochi, M. Hirata, and T. Takaki, Phys. Rev. C 56, 1472 (1997).
- (19) M. Ripani et al., Nucl. Phys. A672, 220 (2000).
- (20) A. Fix and H. Arenhövel, Eur. Phys. J. A 25, 115 (2005).
- (21) J. Beringer et al. [Particle Data Group Collaboration], Phys. Rev. D 86, 010001 (2012).
- (22) K. -H. Kaiser et al., Nucl. Instrum. Methods Phys. Res., Sect. A 593, 159 (2008).
- (23) J. C. McGeorge et al., Eur. Phys. J. A 37, 129 (2008); I. Anthony, J. D. Kellie, S. J. Hall, G. J. Miller, and J. Ahrens, Nucl. Instrum. Methods Phys. Res., Sect. A 301, 230 (1991); S. J. Hall, G. J. Miller, R. Beck, and P. Jennewein, ibid. 368, 698 (1996).
- (24) H. Olsen and L. C. Maximon, Phys. Rev. 114, 887 (1959).
- (25) A. Starostin et al., Phys. Rev. C 64, 055205 (2001).
- (26) R. Novotny, IEEE Trans. Nucl. Sci. 38, 379 (1991); A. R. Gabler et al., Nucl. Inst. Instrum. Methods Phys. Res., Sect. A 346, 168 (1994).
- (27) D. Watts, in Proceedings of the 11th International Conference on Calorimetry in Particle Physics, Perugia, Italy, 2004, World Scientific, Sigapore, 2005, p.560.
- (28) A. Thomas, Eur. Phys. J. Special Topics 198, 171 (2011).
- (29) V.L. Kashevarov et al., Eur. Phys. J. A 42, 141 (2009).