Order-disorder type critical behaviour at the magnetoelectric phase transition in multiferroic DyMnO3
Abstract
We present the results of detailed dielectric investigations of the relaxation dynamics in DyMnO3 multiferroic manganite. Strong low-frequency relaxation process near the paraelectric-ferroelectric phase transition is observed. We provide an experimental evidence that this relaxation mode corresponds to a chirality switching of the spin cycloid in DyMnO3. We demonstrate that the relaxation dynamics in DyMnO3 is typical for an order-disorder phase transition and may be understood within a simple model with a double well potential. These results suggest the interpretation of the paraelectric sinusoidal phase in manganites as a dynamical equilibrium of magnetic cycloids with opposite chiralities.
I Introduction
Multiferroic materials with a coupling of electric and magnetic degrees of freedom have attracted considerable interest after the discovery of a large magnetoelectric effect (ME) in several compounds Fiebig (2005); Ramesh and Spaldin (2007); Tokura (2006); Cheong and Mostovoy (2007). They are currently the subject of intensive study due to fascinating physical properties and potential for applications as multifunctional devices Spaldin and Fiebig (2005); Eerenstein et al. (2006). The rare-earth RMnO3 manganites (R=Gd, Tb, Dy, Eu/Y) with orthorhombically distorted perovskite structure have emerged as a new class of multiferroics with strongly coupled antiferromagnetic and ferroelectric properties Kimura et al. (2005); Hemberger et al. (2007). Several rare earth manganites orders antiferromagnetically below K into collinear paraelectric phaseKenzelmann et al. (2005) with sinusoidal modulations of spins. This phase is followed by a cycloidal spin order with nonzero electric polarization below K.
It should be noted that the Mn3+ atom is supposed Mochizuki and Furukawa (2009) to have a Heisenberg spin with a fixed length of . The purely sinusoidally modulated spin phase contradicts this property. Model calculations Mochizuki and Furukawa (2009) have obtained the sinusoidal order only as a time-space average of the simulated cluster. Thus, there is a possibility that a short-range dynamic order exists in the intermediate temperature range which is responsible for the “hidden” spin. As the magnetic order at low temperatures is spin cycloid, it is natural to assume that the dynamic short-range order is also a spin cycloid. This would imply that there are fluctuating ferroelectric regions in the sinusoidal phase and that the ferroelectric transition is actually of the order-disorder type. Such transition has been also suggested in Ref. [Schrettle et al., 2009] where a c-axis relaxation typical for the order-disorder type transitions has been investigated. The fact that the wave vector of the spin wave does not change at the transition temperature [Arima et al., 2006] is also an indirect evidence that the ferroelectric transition is not of the displacive type.
The data by terahertz spectroscopy Pimenov et al. (2008a, b) evidence the nonzero dielectric contribution of electromagnon in the sinusoidal phase. According to the commonly accepted mechanism of the electromagnon Aguilar et al. (2009); Lee et al. (2009), the majority of the spectral weight of this mode originates from exchange striction mechanism and can only exist in magnetic phases with non-collinear spin arrangement. These facts again favor the hypothesis of dynamical cycloidal spin order in the sinusoidal phase.
Recent theoretical analysis of the terahertz dynamics in the sinusoidal phase suggested an explanation based on anomalous magnetoelectric coupling. Investigations of the collinear sinusoidal phase in the diluted compounds TbMn1-xAlxO3 [Cuartero et al., 2012] and the observation of the memory effect in the low temperature sinusoidal phase in the multiferroic MnWO4 [Taniguchi et al., 2009] have suggested the presence of the nanosize ferroelectric domains and support relaxor order-disorder type transition.
In this work we present the analysis of the critical behavior of the low-frequency relaxation in DyMnO3. The observed critical behavior confirms that the sinusoidal to cycloidal phase transition is of the order-disorder type. Our model suggests the presence of the short-range cycloidal order in the collinear spin phase.
I.1 DyMnO3
In zero magnetic field, DyMnO3 undergoes an antiferromagnetic (AFM) transition with a temperature dependent modulation vector (0 1) around K. With further cooling, the value is locked at the transition temperature, K, and ferroelectric (FE) polarization appears simultaneously along the -axis. It is well established that the ferroelectric polarization in DyMnO3 is induced by a cycloidal magnetic order Kenzelmann et al. (2005); Arima et al. (2006); Mochizuki and Furukawa (2009) through the inverse Dzyaloshinskii-Moriya (DM) interaction Katsura et al. (2005); Mostovoy (2006); Sergienko and Dagotto (2006); Cheong and Mostovoy (2007) and it can be written as
| (1) |
where denotes the unit vector connecting the spins and , is a constant representing the exchange interaction and the spin-orbit interaction. Accordingly, the electric polarization, , is intimately linked to the chirality of the magnetic cycloid (clockwise respectively counterclockwise cycloidal magnetic ordering), that is, changing the direction of implies changing the rotation (chirality) of the magnetic cycloid. This was demonstratedFabrizi et al. (2009) by the asymmetry in the scattering of left-hand and right-hand circularly polarized x-rays by nonresonant magnetic x-ray diffraction for closely similar compound TbMnO3.
The unique cycloidal magnetic ordering below in RMnO3 perovsikes is assigned to the Mn-3d spins Kenzelmann et al. (2005); Voigt et al. (2007); Mannix et al. (2007); Kimura et al. (2003a); Goto et al. (2004); Kimura et al. (2003b, 2005) but ordering of the Dy-4f moments is also of interest Kenzelmann et al. (2005); Prokhnenko et al. (2007a, b). Although it is the magnetic structure of Mn subsystem that determines the emergence of ferroelectricity in rare-earth manganites Prokhnenko et al. (2007b), the mutual coupling of the Mn-3d and Dy-4f moments and, consequently, the ordering of the 4f moments in Dy causes a particular large polarization observed in this material Kimura et al. (2005); Aliouane et al. (2008); Schierle et al. (2010). In addition, the basal plane of the spin cycloid flops from the plane to the plane and rotates the polarization by applying a magnetic field along the -axis.
Concerning the temperature range , there have been a number of studies of the magnetic structure of DyMnO3 and the related material TbMnO3 using techniques such as neutron diffraction Quezel et al. (1977); Kenzelmann et al. (2005) and magnetic x-ray scattering Mannix et al. (2007); Wilkins et al. (2009). These studies have all shown that there is a long-range sinusoidal magnetic ordering of the Mn3+ ions in this temperature range, with the moments aligned parallel to the crystallographic axis, although Mannix et al. [Mannix et al., 2007] and Wilkins et al. [Wilkins et al., 2009], both show a small component of the moment is aligned with the axis.
II Experiment
DyMnO3 single crystals were grown in Ar flow by a floating-zone method with radiation heating Balbashov et al. (1996); Mori et al. (2000). Terahertz properties of the samples from the same batch have been presented previously Shuvaev et al. (2010a); Shuvaev et al. (2013). The complex dielectric constant was measured for electric field along the crystallographic -axis in the frequency range 0.1Hz-1MHz using a frequency response analyzer in magnetic fields 0-14 T and with -axis. We investigated the temperatures near the critical temperature of the paraelectric-ferroelectric phase transition (red circles in Fig. 2) with an increment of K by using a Physical Property Measurement System (PPMS). Silver paint contacts were applied to the sample forming a capacitor.
III Pseudo-Spin-Model
The theory of dynamic critical phenomena for a multivariable system can be formulated as a generalization of the single particle Langevin equation. The equation of motion for the time-dependent local configuration of the order parameter field is most conveniently given by the time-dependent Ginzburg-Landau equationNishimori and Ortitz (2011); Kardar (2007); Hohenberg and Halperin (1977).
| (2) |
Here, the order parameter is given by static electric polarization , is a dissipation parameter, and is a random noise simulating the effect of thermal excitation of the order parameter. In order to guarantee that the system reaches the canonical equilibrium probability distribution at long times, is a random Gaussian variable satisfying and [T uber, 2007], where is the diffusion coefficient. The crucial point is to find an expression for the free energy in Eq. (2). In the framework of the Landau theory for a second order phase transition, Smolenskii Smolenskii and Chupis (1982) introduced a bi-quadratic term (, magnetodielectric effect) into the free energy which accounts for the coupling between magnetization and electric polarization. Bi-quadratic terms are invariant to all symmetry operations and thus they are allowed in any material with coupled spin and charge degrees of freedom. Since the dielectric susceptibility is determined by taking the second derivative of the free energy with respect to the polarization, the dielectric constant will be proportional to the square of the order parameter, [Kimura et al., 2003c]. Describing magnetodielectric effects in antiferromagnetic materials, the expression is not sufficient since the magnetization, , remains zero in the ordered phase. In such a case, is replaced by the antiferromagnetic vector, . Here and are the magnetizations of two antiferromagnetic subsystems.
Within a more general model, Lawes Lawes et al. (2003, 2009) et al. proposed the coupling of the polarization to the -dependent magnetic correlation function . This coupling leads to a magnetodielectric term in the free energy , where is a -dependent coupling constant. The -dependence of the free energy via a spin-spin correlation function enables to apply it to very general forms of magnetic order, including ferromagnetic (FM) and antiferromagnetic (AFM) transitions. In order to obtain a microscopic theory for in systems with a strong spin-lattice interaction, the coupling between the polarization and the spin correlations arises from the coupling of magnetic fluctuations to the optical phonons. That is, the spin correlations perturb the optical phonon frequencies which in turn shift the dielectric constant through the spectral weight transfer and the Lyddane-Sachs-Teller relation. The model determines the coupling by expanding the exchange integral of neighboring spins in terms of the normal coordinates for the phonons. Physically, this procedure corresponds to a coupling between the magnetic correlation function and atomic displacements.
In multiferroic rare earth manganites, RMnO3, the electric polarization is directly linked to the chirality of the magnetic cycloid Cheong and Mostovoy (2007); Mostovoy (2006). Based on this fact, we propose that the polarization in the ferroelectric phase in DyMnO3 is proportional to the difference of opposite chiralities of Mn3+ magnetic cycloids. Here we assume an order-disorder type phase transition between paraelectric and ferroelectric states. Similar analysis in a triangular lattice antiferromagnet RbFe(MoO demonstrated a proportionality between polarization in the multiferroic phase and the chirality difference of the magnetic structure Kenzelmann et al. (2007).
In the present model the following assumptions for the phase transition in DyMnO3 are imposed: (i) A disorder between clockwise and counterclockwise -cycloidal order of the Mn3+ magnetic moments is assumed, (ii) The electric dipole moments are associated with the displacement of the O2- ions due to inverse DM interaction Cheong and Mostovoy (2007); Mostovoy (2006), (iii) The direction of the electric dipoles depend on the chirality of the magnetic order, (iv) Two possible direction of the electric dipoles are energetically separated by an energy barrier, (v) Similar to LawesLawes et al. (2003, 2009) et al. we propose a coupling of the magnetic correlation function and the correlation of O2- atomic displacements. Thus we assume that we can describe the ordering of the magnetic sublattice by the ordering process of the O2- ions.
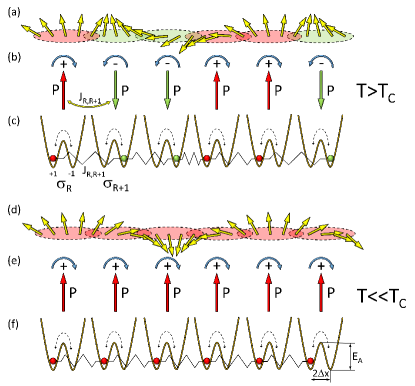
A useful tool for studying phase transitions is provided by the unidimensional single ion model Bruce and Cowley (2007); Giddy et al. (1989); Salje (1991); Padlewski et al. (1992); Radescu et al. (1995). This model contains an array of atoms linked by harmonic forces, with one atom in each unit cell (Fig.1). Each atom is located in its local double-well potential which represents the rest of the crystal.
Assuming order-disorder limit ( [Dove, 1997; Aubry, 1975]) the system can be described by the pseudo spin formalism and thus the model Hamiltonian is essentially governed by an Ising type interaction in combination with an interaction of dipoles with a homogeneous electric field Dove (1997); Aubry (1975); Strukov and Levanyuk (1998)
| (3) |
where is the displacement of the O2- ion, is the coupling constant between O2- ions at position and , is a time dependent homogeneous electric field, is the charge of the oxygen ion, and is the pseudo spin at position with which can take the values +1 and -1.
Introducing a statistical mean value of the spin variable, , with and being the occupation numbers of O2- ions in +1 und -1 state respectively, and neglecting fluctuations of correlations, the free energy of the system with polarization is given byStrukov and Levanyuk (1998)
| (4) |
where is the dipole density and represents the coupling constant characterizing the interaction of an O2- ion at position with another O2- ion at position located within an interaction radius. Since the first term in Eq. (3) is bilinear in the displacements of O2- ions it corresponds to a electric dipole-dipole interaction.
Expanding with respect to and and taking the functional derivative of with respect to , leads to an equation of motion of the homogeneous order parameter:
| (5) |
Here is the damping parameter.
According to Landau theoryLandau and Lifshitz (1975) the phase transitions takes place when the term in Eq. (5) linear in vanishes. This determines the phase transition temperature as . Substituting and [Lines and Glass, 1977], where is the static electric polarization, and comparing the relaxation rate in a single double well potentialStrukov and Levanyuk (1998); F. Kremer (2002); Gonzalo (2006) we get an expression for the relaxation strength and the relaxation time in close agreement with Lines and Glass [Lines and Glass, 1977] and Blinc and Žekš [Blinc and Žekš, 1974] as
| (6) |
| (7) |
Here is the attempt frequency and is the energy barrier separating two local minima (Fig. 1).
Equations (6) and (7) correspond to an order parameter which is homogeneous throughout the entire volume of the crystal. For a spatially dependent order parameter, , and assuming the Gaussian approximation, the relaxation time in Fourier-space becomes Nishimori and Ortitz (2011); Kardar (2007),
| (8) |
where , is a constant and is the wave vector. As a consequence, we see that each Fourier component of the order parameter behaves as an independent particle connected to a spring Kardar (2007) and the fluctuations in each mode decay with a different relaxation time. Only in the long wavelength limit, , the relaxation time in Eq. (8) is equal to that in Eq. (7).
In the opposite (displacive) limit of the model, , the well-known expressions of Ginsburg-Landau mean-field theory are obtained for :
| (9) |
| (10) |
Here , , and are constants of the displacive limit; , and are microscopic parameters characterizing the nature of the potential in the single ion model Bruce and Cowley (2007); Giddy et al. (1989); Salje (1991); Padlewski et al. (1992); Radescu et al. (1995). Nota bene, in canonical ferroelectrics the ferroelectric phase transition of the displacive type is accompanied by softening of a characteristic phonon. In the long wavelength limit an overdamped softening mode is characterized according to Eq. (9) and Eq. (10)Blinc and Žekš (1974); M. (2010). Recently, a critical slowing down at the ferroelectric phase transition has been observed in a chiral multiferroic MnWO4 [Niermann et al., 2015]. This behaviour has been attributed to a overdamped softening of an electromagnon modePimenov et al. (2006); Shuvaev et al. (2010b) obeying the temperature characteristic given in Eq. (9) and Eq. (10) with a critical exponent larger than 1.
IV Results and Discussion
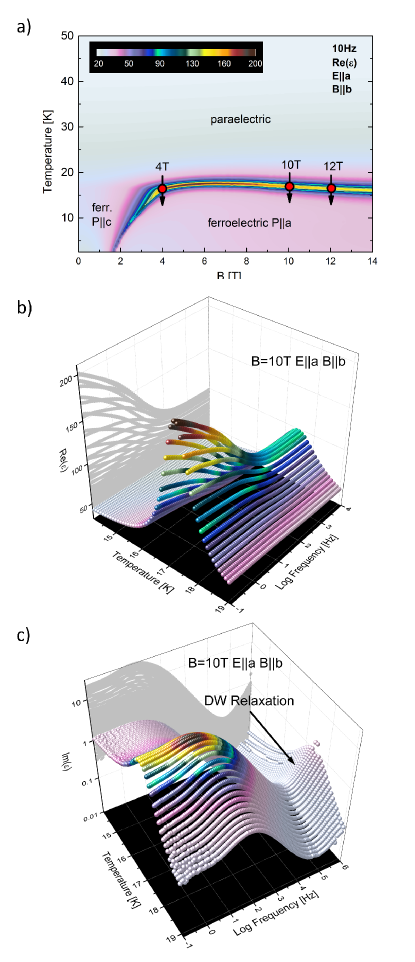
As demonstrated in Fig. 2a, the dielectric permittivity closely follows the known phase diagram of DyMnO3 for -axisKimura et al. (2005). The changes in the dielectric permittivity are especially strong at the transition to the ferroelectric state with (Fig. 2b). In addition a well pronounced absorption is observed in the close vicinity of (Fig. 2c) Detailed analysis of the low-frequency dielectric relaxation is presented for magnetic fields of 4T,10T and 12T corresponding to the transition from the sinusoidal paraelectric to the -axis ferroelectric phase.
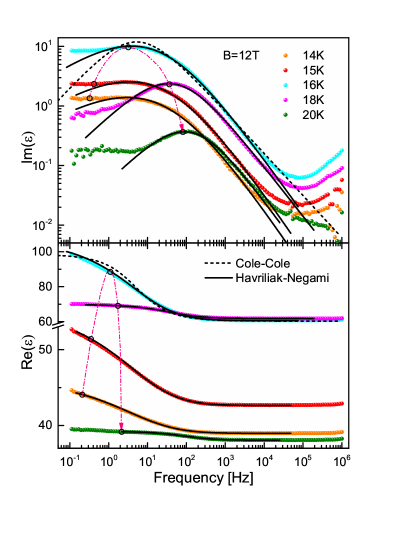
Figure 3 shows typical dielectric spectra of DyMnO3 close to the ferroelectric transition temperature K. The spectra below the megahertz range are dominated by two relaxation processes. Only a wing of the high-frequency relaxation is seen in our spectra because the characteristic frequency of this mode is far above 1 MHz. According to previous dielectric studies, the high-frequency mode can be attributed to the relaxation of the domain walls Kagawa et al. (2009, 2011) in DyMnO3.
In the following we concentrate the analysis on an absorption peak observed for frequencies below 1 kHz. As seen already in the spectra in Fig. (3,2b,2c), this peak grows in magnitude with decreasing temperature, reaches a maximum value at , and decreases again after passing the critical temperature. The observed dielectric relaxation is slightly assymmetrical with broadening towards low-frequencies.
To obtain quantitative information of the origin of the low-frequency mode the spectra were fitted to the phenomenological Havriliak-Negami equationF. Kremer (2002):
| (11) |
Here is the relaxation strength, is the high frequency limit of the dielectric constant, is the characteristic relaxation time, and are the width and asymmetry parameters, respectively. A simple Debye behaviour in Eq. (11) would corresponds to and . Values of and results in broadened asymmetric loss peaks with power laws of and as the low- and high-frequency asymptotic behaviour, respectively.
Since the symmetric Cole-Cole function given by
| (12) |
is intensively used as a fitting function to describe permittivity data of conventional materials as well as magnetoelectric materials Schrettle et al. (2009); Niermann et al. (2015), we demonstrated by the dashed line in Fig. 3 for the K data, that the symmetric Cole-Cole function results in a worse fit to the data compared to the Havriliak-Negami expression. Therefore, the subsequent analysis within the present work has been done according to Eq. (11). Most probably, a fitting procedure using the Cole-Cole function would lead to qualitatively similar behaviour of the relaxation time and dielectric strength.
The deviations from a Debye spectral shape of the relaxation are commonly ascribed to a distribution of relaxation times. According to Eq. (8), this can be caused by fluctuations of the order parameter near the phase transition temperature. The mean logarithmic relaxation time is related to the characteristic relaxation time by Zorn (2002)
| (13) |
where is the digamma function and is the Euler constant. The width of a non-Debye relaxation is defined as the variance, , of the distribution of logarithmic relaxation times and for a Havriliak-Negami function is given byZorn (2002)
| (14) |
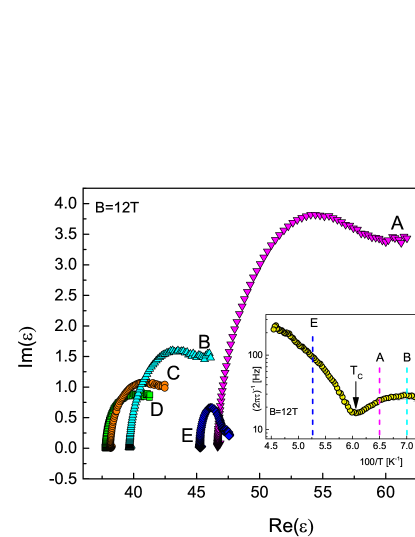
In present work we do not consider the relaxations by the domain walls. Compared to fluctuations on the atomic level, ferroelectric domains are typically Fiebig (2005) of m size and they are responsible for the high-frequency dielectric relaxation Kagawa et al. (2009, 2011). Further two arguments are in favor of nanosize origin of the relaxation discussed here: (i) the low frequency relaxation (Fig. 3) is well pronounced below and above , and (ii) no signature of thermally activated creep motion of domain walls is evident in the Cole-Cole plots (Fig. 4). In the latter case a linear relationship between the imaginary and real part of the permittivity with Im()Re() and is expected Braun et al. (2005); Kleemann et al. (2002, 2006).
IV.1 Relaxation Strength
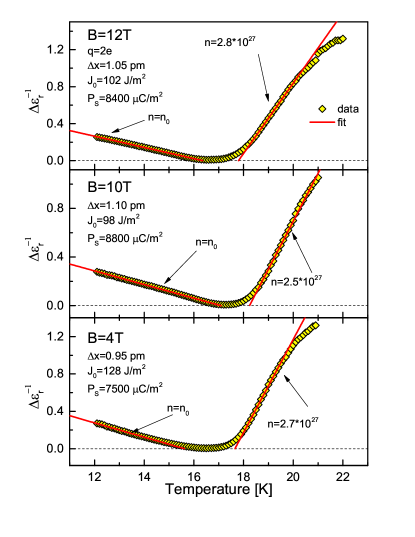
The temperature dependence of the inverse relaxation strength of the low frequency mode is presented in Fig. 5. Dielectric permittivity diverges as the temperature approaches . At the ferroelecric transition temperature DyMnO3 undergoes a phase transition accompanied by a minimum in at . As predicted by Eq. (6), close to transition shows the regions of linear dependence. This behaviour demonstrates critical dynamics characteristic for order-disorder phase transitions.
A significant rounding near is attributed to fluctuations of the order parameter and to limitation of the correlation length close to [Lines and Glass, 1977] . In addition, the straight lines of the model fits cross the x-axis at temperatures deviating by about one Kelvin. These effects are not accounted within the present simple model since it implies a molecular field approach and neglects fluctuations. Alternatively, a narrow temperature range near may be analyzed using the formalism of critical exponents . Such analysis (not shown) reveals critical exponents for the relaxation strength of the low frequency mode near between and depending on the magnetic field. These rather high values of the critical exponents may also be seen as an evidence for a order-disorder type phase transitions Luban et al. (1970).
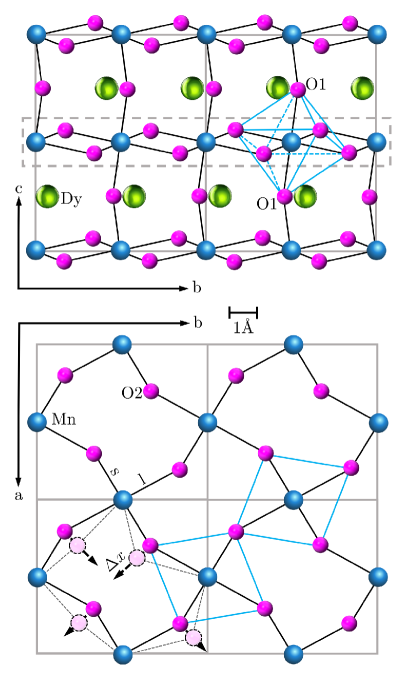
The electric dipole moment is generated by the displacements of the O2- ions and only the ions labeled as O2 in Fig. 6 generate a static electric polarization along the -axis. Therefore, we assume an electric dipole density in DyMnO3 equal to of the density of O2- ions in the unit, , [Muthu et al., 2012; Alonso et al., 2000] and a charge of , where is the elementary charge. According to Eq. (6), the slope of is inversely proportional to with static electric polarization along the a-axis . The factor appears to to 45∘ degree misalinement between the oxygen displacement and the a-axis (Fig. 6). Hence, for from the slopes of we may directly estimate the static electric polarization. The microscopic parameters of the model, and are obtained from the values of the static polarization and from . These parameters are given in Fig. 5. Taking into account the simplicity of the model, the obtained values of the electric polarization agree reasonably well with directly measured data Kimura et al. (2005) . In addition, the obtained coupling constant coincide with the classical electric dipole energy in the Mn-O-Mn chains along the b-axis (Fig. 6) with and being the long and short bond distances Alonso et al. (2000) .
The temperature dependence of the inverse relaxation strength becomes steeper in the paraelectric phase although the model predicts an opposite behavior. This effect is evidently not captured within the assumptions of present simple model. Two possible explanations for this behaviour may be suggested in present stage: (i) Change in effective dipole density at the phase transition. In the disordered state a large portion of the magnetic cycloid is distorted and is included into the border regions between the left- and right-rotating cycloids. The oxygen ions in these regions are effectively excluded from the relaxation process thus reducing the effective dipole density of the model. This explanation has been used in the fits to the data in Fig. 5 and the effective dipole density for is indicated at the fit lines. (ii) The model can be modified to account for higher order terms Cano (2015); Cano and Levanyuk (2010). A coupling term between the polarization and magnetization may me explicitly included into the free energy expansion, Eq. (5). The term of which is always allowed by symmetry is . Thus the free energy expansion near , Eq. (4), can be written as
| (15) |
where , and , and are the constants of the model. In these modification, has to be understood as the amplitude of the transverse component of the spin-cycloidal . Applying Eq. (15) to Eq. (2) leads to
| (16) |
With and and assuming that below and above the relaxation strength and relaxation time becomes
| (17) |
| (18) |
IV.2 Relaxation Time
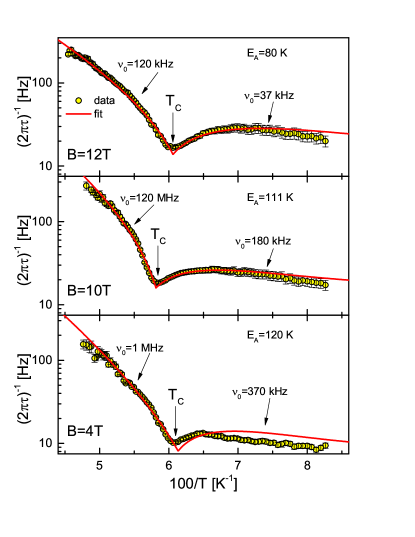
The inverse relaxation time of the low frequency mode obtained from the spectral analysis is shown in Fig. 7. On cooling from the paraelectric phase the inverse relaxation time decreases toward . Below , shows a broad characteristic maximum and decreases again for low temperatures. Qualitatively, the temperature behavior of the relaxation time can be explained as a superposition of two processes: (i) Activated behaviour with a characteristic energy of K and (ii) Critical slowing down of the relaxation in the vicinity of . This observation is typical for order-disorder phase transitions involving shallow double well potentials Staresinic et al. (2006); Lines and Glass (1977); Gonzalo (2006).
Both processes determining the temperature evolution of the relaxation time are qualitatively well captured within the present simple model. The temperature activated behaviour, expressed by the exponential factor in Eq. (7), prevails for temperatures far from and, therefore, causes an overall decrease of the relaxation time for decreasing temperature. Qualitatively similar behaviour of the relaxation time was foundSchrettle et al. (2009) for a c-axis relaxation () in DyMnO3 for a transition to a -cycloidal magnetic ordering. The -axis state is achieved in Dy for cooling in zero external magnetic field. It seem to be plausible that the c-axis relaxation in multiferroic manganites may be explained by the present model as well.
In case of inverse relaxation time the suggested model gives a qualitative explanation of the observed data. Eq. (7) contains two temperature-dependent factors, Arrhenius term and the critical-slowing term . These two terms qualitatively explain the temperature dependence of the relaxation time close to phase transition. In order to obtain reasonable fits to the critical behavior of the relaxation time, different values of the attempt frequency above and below have been used as well as a constant was added to Eq. (7). Nota bene, accounting magnetodielectric effects the slope of the inverse relaxation time is not necessarily 2, see Eq. (18). Thus the values of the attempt frequency above and below can take the same value. Eventually, in addition to magnetodielectric effects, the distribution of relaxation times plays also an role to explain that feature.
The ratio of is a further evidence of an order-disorder type phase transitionDove (1997) and is in contrast to a displacive type phase transition where holds. Furthermore, K corresponds well to a characteristic energy of the magnetic order as determined by Néel temperature of K [Aubry, 1975].
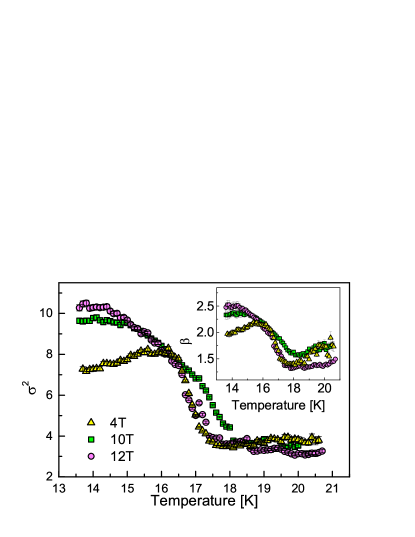
Finally, Fig. 8 shows the width of the low-frequency dielectric relaxation in DyMnO3, obtained via Eq. (14). The increase of the characteristic width below K is clearly seen. In the ordered magnetic state the effective length of the elementary cycloids increases thus leading to broader length distribution. Most probably, this also leads to the observed broadening of the dielectric relaxation.
V Discussion
The analysis of the low-frequency dielectric relaxation demonstrates an overlap of two processes: critical dynamics close to and activation behavior in the broader frequency range. This observation may be reasonably explained using a simple model of an order-disorder phase transition with a double well potential. This potential reflects a dynamical switching between cycloids of the opposite chirality. Several parameters of the model correlate well with physical properties of DyMnO3. Thus, the characteristic energies of magnetic ordering and the value of the static electric polarization are in agreement with known values. We note that present experiments could be analyzed up to K only. Strictly speaking, the dynamical behaviour of the cycloids still may change close to .
Most importantly, the present experimental data and the simple model suggest to explain the paraelectric sinusoidal phase in rare-earth manganate as a dynamical equilibrium of cycloids with opposite chiralities. In addition to the dielectric results, this hypothesis resolve several experimental constraints which contradicted the concept of static sinusoidally modulated magnetic phase.
VI Conclusions
Low-frequency relaxation mode is observed in dielectric properties of DyMnO3 multiferroic manganite and it reveals critical behaviour at ferroelectric transition temperature, K. Together with temperature-activated relaxation rate, the observed mode may be qualitatively explained within a model for order-disorder phase transition. The model assume a switching between magnetic cycloids with opposite chirality and correlates well with known physical properties of DyMnO3.
Combining present results with several other experiments on multiferroics we suggest that the paramagnetic sinusoidal phase should be explained as a dynamical equilibrium between the clockwise and counterclockwise cycloidal magnetic orders. The short range order in the paraelectric phase is transformed to a long-range cycloid at the ferroelectric transition temperature.
Acknowledgements
This work was supported by by the Austrian Science Funds (I815-N16, W1243).
References
- Fiebig (2005) M. Fiebig, J. Phys. D: Appl. Phys. 38, R123 (2005), URL http://stacks.iop.org/0022-3727/38/R123.
- Ramesh and Spaldin (2007) R. Ramesh and N. A. Spaldin, Nat. Mater. 6, 21 (2007), URL http://dx.doi.org/10.1038/nmat1805.
- Tokura (2006) Y. Tokura, Science 312, 1481 (2006), eprint http://www.sciencemag.org/cgi/reprint/312/5779/1481.pdf, URL http://www.sciencemag.org.
- Cheong and Mostovoy (2007) S.-W. Cheong and M. Mostovoy, Nat. Mater. 6, 13 (2007), URL http://dx.doi.org/10.1038/nmat1804.
- Spaldin and Fiebig (2005) N. A. Spaldin and M. Fiebig, Science 309, 391 (2005), eprint http://www.sciencemag.org/content/309/5733/391.full.pdf, URL http://www.sciencemag.org/content/309/5733/391.short.
- Eerenstein et al. (2006) W. Eerenstein, N. D. Mathur, and J. F. Scott, Nature 442, 759 (2006), URL http://dx.doi.org/10.1038/nature05023.
- Kimura et al. (2005) T. Kimura, G. Lawes, T. Goto, Y. Tokura, and A. P. Ramirez, Phys. Rev. B 71, 224425 (2005).
- Hemberger et al. (2007) J. Hemberger, F. Schrettle, A. Pimenov, P. Lunkenheimer, V. Y. Ivanov, A. A. Mukhin, A. M. Balbashov, and A. Loidl, Phys. Rev. B 75, 035118 (2007), URL http://link.aps.org/doi/10.1103/PhysRevB.75.035118.
- Kenzelmann et al. (2005) M. Kenzelmann, A. B. Harris, S. Jonas, C. Broholm, J. Schefer, S. B. Kim, C. L. Zhang, S.-W. Cheong, O. P. Vajk, and J. W. Lynn, Phys. Rev. Lett. 95, 087206 (2005).
- Mochizuki and Furukawa (2009) M. Mochizuki and N. Furukawa, Phys. Rev. B 80, 134416 (2009), URL http://link.aps.org/doi/10.1103/PhysRevB.80.134416.
- Schrettle et al. (2009) F. Schrettle, P. Lunkenheimer, J. Hemberger, V. Y. Ivanov, A. A. Mukhin, A. M. Balbashov, and A. Loidl, Phys. Rev. Lett. 102, 207208 (2009).
- Arima et al. (2006) T. Arima, A. Tokunaga, T. Goto, H. Kimura, Y. Noda, and Y. Tokura, Phys. Rev. Lett. 96, 097202 (2006), URL http://link.aps.org/doi/10.1103/PhysRevLett.96.097202.
- Pimenov et al. (2008a) A. Pimenov, A. M. Shuvaev, A. A. Mukhin, and A. Loidl, J. Phys.: Condens. Matter 20, 434209 (2008a), URL http://stacks.iop.org/0953-8984/20/434209.
- Pimenov et al. (2008b) A. Pimenov, A. Loidl, A. A. Mukhin, V. D. Travkin, V. Y. Ivanov, and A. M. Balbashov, Phys. Rev. B 77, 014438 (pages 7) (2008b), URL http://link.aps.org/abstract/PRB/v77/e014438.
- Aguilar et al. (2009) R. V. Aguilar, M. Mostovoy, A. B. Sushkov, C. L. Zhang, Y. J. Choi, S.-W. Cheong, and H. D. Drew, Phys. Rev. Lett. 102, 047203 (pages 4) (2009), URL http://link.aps.org/abstract/PRL/v102/e047203.
- Lee et al. (2009) J. S. Lee, N. Kida, S. Miyahara, Y. Takahashi, Y. Yamasaki, R. Shimano, N. Furukawa, and Y. Tokura, Phys. Rev. B 79, 180403 (pages 4) (2009), URL http://link.aps.org/abstract/PRB/v79/e180403.
- Cuartero et al. (2012) V. Cuartero, J. Blasco, J. A. Rodriguez-Velamazan, J. Garcia, G. Subias, C. Ritter, J. Stankiewicz, and L. Canadillas-Delgado, Phys. Rev. B 86, 104413 (2012), URL http://link.aps.org/doi/10.1103/PhysRevB.86.104413.
- Taniguchi et al. (2009) K. Taniguchi, N. Abe, S. Ohtani, and T. Arima, Phys. Rev. Lett. 102, 147201 (2009), URL http://link.aps.org/doi/10.1103/PhysRevLett.102.147201.
- Katsura et al. (2005) H. Katsura, N. Nagaosa, and A. V. Balatsky, Phys. Rev. Lett. 95, 057205 (2005).
- Mostovoy (2006) M. Mostovoy, Phys. Rev. Lett. 96, 067601 (pages 4) (2006), URL http://link.aps.org/abstract/PRL/v96/e067601.
- Sergienko and Dagotto (2006) I. A. Sergienko and E. Dagotto, Phys. Rev. B 73, 094434 (pages 5) (2006), URL http://link.aps.org/abstract/PRB/v73/e094434.
- Fabrizi et al. (2009) F. Fabrizi, H. C. Walker, L. Paolasini, F. de Bergevin, A. T. Boothroyd, D. Prabhakaran, and D. F. McMorrow, Phys. Rev. Lett. 102, 237205 (2009), URL http://link.aps.org/doi/10.1103/PhysRevLett.102.237205.
- Voigt et al. (2007) J. Voigt, J. Persson, J. W. Kim, G. Bihlmayer, and T. Brückel, Phys. Rev. B 76, 104431 (2007), URL http://link.aps.org/doi/10.1103/PhysRevB.76.104431.
- Mannix et al. (2007) D. Mannix, D. F. McMorrow, R. A. Ewings, A. T. Boothroyd, D. Prabhakaran, Y. Joly, B. Janousova, C. Mazzoli, L. Paolasini, and S. B. Wilkins, Phys. Rev. B 76, 184420 (2007), URL http://link.aps.org/doi/10.1103/PhysRevB.76.184420.
- Kimura et al. (2003a) T. Kimura, T. Goto, H. Shintani, K. Ishizaka, T. Arima, and Y. Tokura, Nature 426, 55 (2003a), URL http://dx.doi.org/10.1038/nature02018.
- Goto et al. (2004) T. Goto, T. Kimura, G. Lawes, A. P. Ramirez, and Y. Tokura, Phys. Rev. Lett. 92, 257201 (2004).
- Kimura et al. (2003b) T. Kimura, S. Ishihara, H. Shintani, T. Arima, K. T. Takahashi, K. Ishizaka, and Y. Tokura, Phys. Rev. B 68, 060403 (2003b).
- Prokhnenko et al. (2007a) O. Prokhnenko, R. Feyerherm, E. Dudzik, S. Landsgesell, N. Aliouane, L. C. Chapon, and D. N. Argyriou, Phys. Rev. Lett. 98, 057206 (2007a), URL http://link.aps.org/doi/10.1103/PhysRevLett.98.057206.
- Prokhnenko et al. (2007b) O. Prokhnenko, R. Feyerherm, M. Mostovoy, N. Aliouane, E. Dudzik, A. U. B. Wolter, A. Maljuk, and D. N. Argyriou, Phys. Rev. Lett. 99, 177206 (2007b), URL http://link.aps.org/doi/10.1103/PhysRevLett.99.177206.
- Aliouane et al. (2008) N. Aliouane, O. Prokhnenko, R. Feyerherm, M. Mostovoy, J. Strempfer, K. Habicht, K. C. Rule, E. Dudzik, A. U. B. Wolter, A. Maljuk, et al., J. Phys.: Cond. Matter 20 (2008), ISSN 0953-8984.
- Schierle et al. (2010) E. Schierle, V. Soltwisch, D. Schmitz, R. Feyerherm, A. Maljuk, F. Yokaichiya, D. N. Argyriou, and E. Weschke, Phys. Rev. Lett. 105, 167207 (2010), URL http://link.aps.org/doi/10.1103/PhysRevLett.105.167207.
- Quezel et al. (1977) S. Quezel, F. Tcheou, J. Rossat-Mignod, G. Quezel, and E. Roudaut, Physica B+C 86-88, 916 (1977), URL http://www.sciencedirect.com/science/article/B6X43-46T39RN-59/2/118c954db48dd835705ac490081a1292.
- Wilkins et al. (2009) S. B. Wilkins, T. R. Forrest, T. A. W. Beale, S. R. Bland, H. C. Walker, D. Mannix, F. Yakhou, D. Prabhakaran, A. T. Boothroyd, J. P. Hill, et al., Phys. Rev. Lett. 103, 207602 (2009), URL http://link.aps.org/doi/10.1103/PhysRevLett.103.207602.
- Balbashov et al. (1996) A. M. Balbashov, S. G. Karabashev, Y. M. Mukovskiy, and S. A. Zverkov, Journal of Crystal Growth 167, 365 (1996), URL http://www.sciencedirect.com/science/article/B6TJ6-3VXHJMK-4G/2/5926884bb96c3625e9617660445953bb.
- Mori et al. (2000) T. Mori, K. Aoki, N. Kamegashira, T. Shishido, and T. Fukuda, Materials Letters 42, 387 (2000), ISSN 0167-577X, URL http://www.sciencedirect.com/science/article/pii/S0167577X99002165.
- Shuvaev et al. (2010a) A. M. Shuvaev, J. Hemberger, D. Niermann, F. Schrettle, A. Loidl, V. Y. Ivanov, V. D. Travkin, A. A. Mukhin, and A. Pimenov, Phys. Rev. B 82, 174417 (2010a), URL http://link.aps.org/doi/10.1103/PhysRevB.82.174417.
- Shuvaev et al. (2013) A. Shuvaev, V. Dziom, A. Pimenov, M. Schiebl, A. A. Mukhin, A. C. Komarek, T. Finger, M. Braden, and A. Pimenov, Phys. Rev. Lett. 111, 227201 (2013), URL http://link.aps.org/doi/10.1103/PhysRevLett.111.227201.
- Nishimori and Ortitz (2011) H. Nishimori and G. Ortitz, Oxford University Press (2011).
- Kardar (2007) M. Kardar, Cambridge University Press (2007).
- Hohenberg and Halperin (1977) P. C. Hohenberg and B. I. Halperin, Rev. Mod. Phys. 49, 435 (1977), URL http://link.aps.org/doi/10.1103/RevModPhys.49.435.
- T uber (2007) U. C. T uber, Cambridge University Press (2007).
- Smolenskii and Chupis (1982) G. A. Smolenskii and I. E. Chupis, Sov. Phys. Usp. 25, 475 (1982), URL http://stacks.iop.org/0038-5670/25/i=7/a=R02.
- Kimura et al. (2003c) T. Kimura, S. Kawamoto, I. Yamada, M. Azuma, M. Takano, and Y. Tokura, Phys. Rev. B 67, 180401 (2003c), URL http://link.aps.org/doi/10.1103/PhysRevB.67.180401.
- Lawes et al. (2003) G. Lawes, A. P. Ramirez, C. M. Varma, and M. A. Subramanian, Phys. Rev. Lett. 91, 257208 (2003), URL http://link.aps.org/doi/10.1103/PhysRevLett.91.257208.
- Lawes et al. (2009) G. Lawes, T. Kimura, C. M. Varma, M. A. Subramanian, N. Rogado, R. J. Cava, and A. P. Ramirez, Progr. Sol. State Chem. 37, 40 (2009), ISSN 0079-6786.
- Kenzelmann et al. (2007) M. Kenzelmann, G. Lawes, A. B. Harris, G. Gasparovic, C. Broholm, A. P. Ramirez, G. A. Jorge, M. Jaime, S. Park, Q. Huang, et al., Phys. Rev. Lett. 98, 267205 (2007), URL http://link.aps.org/doi/10.1103/PhysRevLett.98.267205.
- Bruce and Cowley (2007) A. D. Bruce and R. A. Cowley, Taylor and Frencis, London (2007).
- Giddy et al. (1989) A. P. Giddy, M. T. Dove, and V. Heine, J. Phys. Cond. Matter 1, 8327 (1989), ISSN 0953-8984.
- Salje (1991) E. K. H. Salje, Acta Cryst. A 47, 453 (1991), ISSN 0108-7673.
- Padlewski et al. (1992) S. Padlewski, A. Evans, C. Ayling, and V. Heine, J. Phys. Cond. Matter 4, 4895 (1992), ISSN 0953-8984.
- Radescu et al. (1995) S. Radescu, I. Etxebarria, and J. M. Perezmato, J. Phys. Cond. Matter 7, 585 (1995), ISSN 0953-8984.
- Dove (1997) M. T. Dove, Am. Mineralogist 82, 213 (1997), ISSN 0003-004X.
- Aubry (1975) S. Aubry, J. Chem. Phys. 62, 3217 (1975), ISSN 0021-9606.
- Strukov and Levanyuk (1998) B. A. Strukov and A. P. Levanyuk, Ferroelectric Phenomena in Crystals (Springer, Berlin, 1998), 1st ed., ISBN 3540631321, URL http://www.amazon.com/gp/product/3540631321.
- Landau and Lifshitz (1975) L. D. Landau and E. M. Lifshitz, Statistical Physics, Third Edition, Part 1: Volume 5 (Course of Theoretical Physics, Volume 5) (Butterworth-Heinemann, Oxford, 1975), 3rd ed., ISBN 0750633727, URL http://www.amazon.com/gp/product/0750633727.
- Lines and Glass (1977) M. E. Lines and A. M. Glass, Principles and Applications of Ferrorelectrics and Related Phenomena (Oxford University Press, Oxford, 1977), 1st ed., ISBN 0198512864, URL http://www.amazon.com/gp/product/0198512864.
- F. Kremer (2002) A. S. F. Kremer, Springer, Berlin (2002), URL http://dx.doi.org/10.1134/S0021364007100074.
- Gonzalo (2006) J. A. Gonzalo, Effective Field Approach to Phase transitions and Some Applications to Ferroelectrics (World Scientific, Ney Jersey, 2006), 2nd ed., ISBN 9812568751, URL http://www.amazon.com/gp/product/9812568751.
- Blinc and Žekš (1974) R. Blinc and B. Žekš, Soft modes in ferroelectrics and antiferroelectrics (North-Holland Publishing, Amsterdam, 1974).
- M. (2010) F. M., The Physics of Structural Phase Transitions (Springer, 2010), 2nd ed., ISBN 1441923497, URL http://www.amazon.com/gp/product/1441923497.
- Niermann et al. (2015) D. Niermann, C. P. Grams, P. Becker, L. Bohatý, H. Schenck, and J. Hemberger, Phys. Rev. Lett. 114, 037204 (2015), URL http://link.aps.org/doi/10.1103/PhysRevLett.114.037204.
- Pimenov et al. (2006) A. Pimenov, A. A. Mukhin, V. Y. Ivanov, V. D. Travkin, A. M. Balbashov, and A. Loidl, Nat. Phys. 2, 97 (2006), URL http://dx.doi.org/10.1038/nphys212.
- Shuvaev et al. (2010b) A. M. Shuvaev, J. Hemberger, D. Niermann, F. Schrettle, A. Loidl, V. Y. Ivanov, V. D. Travkin, A. A. Mukhin, and A. Pimenov, Phys. Rev. B 82, 174417 (2010b), URL http://link.aps.org/doi/10.1103/PhysRevB.82.174417.
- Kagawa et al. (2011) F. Kagawa, Y. Onose, Y. Kaneko, and Y. Tokura, Phys. Rev. B 83, 054413 (2011), URL http://link.aps.org/doi/10.1103/PhysRevB.83.054413.
- Kagawa et al. (2009) F. Kagawa, M. Mochizuki, Y. Onose, H. Murakawa, Y. Kaneko, N. Furukawa, and Y. Tokura, Phys. Rev. Lett. 102, 057604 (2009).
- Zorn (2002) R. Zorn, The Journal of Chemical Physics 116, 3204 (2002), URL http://scitation.aip.org/content/aip/journal/jcp/116/8/10.1063/1.1446035.
- Braun et al. (2005) T. Braun, W. Kleemann, J. Dec, and P. A. Thomas, Phys. Rev. Lett. 94, 117601 (2005), URL http://link.aps.org/doi/10.1103/PhysRevLett.94.117601.
- Kleemann et al. (2002) W. Kleemann, J. Dec, S. Miga, T. Woike, and R. Pankrath, Phys. Rev. B 65, 220101 (2002), URL http://link.aps.org/doi/10.1103/PhysRevB.65.220101.
- Kleemann et al. (2006) W. Kleemann, J. Dec, S. A. Prosandeev, T. Braun, and P. A. Thomas, FERROELECTRICS 334, 3 (2006), ISSN 0015-0193.
- Luban et al. (1970) M. Luban, N. Wiser, and A. J. Greenfield, Journal of Physics C: Solid State Physics 3, 1 (1970), URL http://stacks.iop.org/0022-3719/3/i=1/a=001.
- Muthu et al. (2012) D. V. S. Muthu, A. E. Midgley, P. R. Scott, M. B. Kruger, J. R. Sahu, A. K. Sood, and C. N. R. Rao, Journal of Physics: Conference Series 377, 012025 (2012), URL http://stacks.iop.org/1742-6596/377/i=1/a=012025.
- Alonso et al. (2000) J. A. Alonso, M. J. Martínez-Lope, M. T. Casais, and M. T. Fernández-Díaz, Inorganic Chemistry 39, 917 (2000), pMID: 12526369, eprint http://dx.doi.org/10.1021/ic990921e, URL http://dx.doi.org/10.1021/ic990921e.
- Cano (2015) A. Cano, Private communication (2015).
- Cano and Levanyuk (2010) A. Cano and A. P. Levanyuk, Phys. Rev. B 81, 172105 (2010), URL http://link.aps.org/doi/10.1103/PhysRevB.81.172105.
- Staresinic et al. (2006) D. Staresinic, K. Biljakovic, P. Lunkenheimer, and A. Loidl, Solid State Communications 137, 241 (2006), ISSN 0038-1098, URL http://www.sciencedirect.com/science/article/pii/S0038109805009567.