2015 Vol. X No. XX, 000–000
22institutetext: Department of Physics & Astronomy, Georgia State University, 25 Park Place, Atlanta, GA 30303, USA; 33institutetext: Department of Astrophysics, Division of Physical Sciences, American Museum of Natural History, Central Park West at 79th Street, New York, NY 10024, USA; 44institutetext: City University of New York, The Graduate Center, 365 Fifth Avenue, New York, NY 10016, USA; 55institutetext: Key Laboratory of Optical Astronomy, National Astronomical Observatories, Chinese Academy of Sciences, Beijing 100012, China 66institutetext: Nanjing Institute of Astronomical Optics & Technology, National Astronomical Observatories, Chinese Academy of Sciences, Nanjing 210042, China
The M-giant star candidates identified in the LAMOST data release 1 ∗ 00footnotetext: Supported by the National Natural Science Foundation of China.
Abstract
We perform a discrimination procedure with the spectral index diagram of TiO5 and CaH2+CaH3 to separate M giants from M dwarfs. Using the M giant spectra identified from the LAMOST DR1 with high signal-to-noise ratio (SNR), we have successfully assembled a set of M giant templates, which show more reliable spectral features.Combining with the M dwarf/subdwarf templates in Zhong et al. (2015), we present an extended M-type templates library which includes not only M dwarfs with well-defined temperature and metallicity grid but also M giants with subtype from M0 to M6. Then, the template-fit algorithm were used to automatically identify and classify M giant stars from the LAMOST DR1. The result of M giant stars catalog is cross-matched with 2MASS JHKs and WISE W1/W2 infrared photometry. In addition, we calculated the heliocentric radial velocity of all M giant stars by using the cross-correlation method with the template spectrum in a zero-velocity rest frame. Using the relationship between the absolute infrared magnitude MJ and our classified spectroscopic subtype, we derived the spectroscopic distance of M giants with uncertainties of about 40%. A catalog of 8639 M giants is provided. As an additional search result, we also present 101690 M dwarfs/subdwarfs catalog which were classified by our classification pipeline.
keywords:
stars: fundamental parameters — stars: late-type — catalogs — surveys1 Introduction
M giants are red-giant-branch (RGB) stars with low surface temperature ( 4000 K) and high luminosity (log 3-4) in the late-phase of stellar evolution. Its luminous nature allows us to use these stars as good tracers to study the outer Galactic halo and distant substructures. By selecting the M giant candidates from the Two Micron All Sky Survey (2MASS), Majewski et al. (2003) mapped out the first global view of Sagittarius dwarf galaxy all over the sky and found that a significant fraction of halo M giants in the Milky Way were contributed by the Sagittarius Dwarf Galaxy; Sharma et al. (2010) identified 16 candidate stellar halo structures at high Galactic latitude, of which 6 are new. To explore the distant region of our Galaxy’s outer halo, 404 M giants were identified from the UKIRT Infrared Deep Sky Survey (UKIDSS; Lawrence et al. 2007), and the kinematic analysis indicated that the M giant candidates can be used to constrain the number of Sagittarius accretion event (Bochanski et al. 2014a). Moreover, two extremely distant giants have been confirmed by spectroscopy with distance of 240-270 kpc, almost beyond the virial radius of our Galaxy (Bochanski et al. 2014b).
Until currently, most of M giant candidates are selected from the photometric database, only a small fraction of them obtained via visible/infrared spectra (Fluks et al. 1994; Danks & Dennefeld 1994; Allen & Strom 1995; Montes et al. 1999; Lançon & Wood 2000; Mann et al. 2012). In the Sloan Digital Sky Survey (SDSS; York et al. 2000), the M giants fraction in the M-type spectroscopic sample is about 0.5-1.0 (West et al. 2011; Covey et al. 2008), corresponding to several hundred giant spectra. As an alternative efficient spectroscopic survey, the LAMOST Galactic survey project observed more M giant candidates than SDSS. In the LAMOST pilot survey, Yi et al. (2014) present 58,360 M dwarf candidates and estimate the M giants contamination as about 4 by using the J-H color criteria (Bessell & Brett 1988). Comparing with the SDSS survey, the high spectrum acquiring rate and high giant fraction observing rate indicate the great potential of LAMOST survey program to establish the largest M giant spectroscopic sample for future research.
In Zhong et al. (2015, here after Z15), we have performed a spectral classification of all M dwarf stars in the LAMOST commissioning data. Using the template-fit method, 2612 spectra with relatively high SNR were positively identified as M dwarf spectra. By examining some outliers in the spectral index distribution, we found a few spectra in our sample are more likely belong to M giants instead of M dwarfs. As we pointed out in the Z15, the giants misclassification are mainly caused by the lack of giant templates in our automated classification pipeline. Although the giants contamination is not significant in the commissioning survey, it is necessary to fix the shortcoming in our pipeline since the giants fraction is largely increased in the pilot survey and regular survey. Our effort of assembling the M giant templates will be devoted to well classify the M-type stars including the M dwarfs/subdwarfs and M giants.
In this paper, a brief description of the LAMOST DR1 is given in section 2. In section 3, we mainly introduce our effort to establish the M giant spectral templates, including the luminosity discrimination and the temperature classification. Combining with the M giant and dwarf templates, we used the revised classification pipeline to classify M giant stars with different subtype in LAMOST DR1, the analyses and results of our classification are presented in section 4. In the last section, a brief conclusion and discussion is provided.
2 The LAMOST DR1 data
The LAMOST survey is a spectroscopic survey for stars and extra-galaxies. Based on the quasi-meridian reflecting Schmidt telescope(Cui et al. 2012) of 4 meters effective aperture and 4000 optical fibers, the LAMOST survey become a most ambitious spectroscopic observation program to acquire over 10 million spectra of stars and galaxies in five years (Zhao et al. 2012). At present, the LAMOST survey has gone through the commissioning phase (2009-2011), the pilot survey (2011-2012), the first year (2012-2013) and the second year (2013-2014) regular survey.
The LAMOST Data Release One (DR1) includes the pilot survey and the first year regular survey data, with totally of 2,204,860 spectra(Luo et al. 2015a). Most of these spectra are observed with an implementing of the LAMOST Experiment for Galactic Understanding and Exploration (LEGUE) survey (Deng et al. 2012). For all 1,944,406 stellar spectra in DR1, the SNR are greater than 10 in the SDSS g or r band. A subset of about 1.1 million stellar spectra (AFGK stars) with relatively high SNR provides the stellar parameters like the effective temperature (Teff), surface gravity (Logg), metallicity (Fe/H]) and radial velocity (RV).
The LAMOST spectra are first reduced by the LAMOST 2D pipeline over the vacuum-wavelength scale from 3800 to 9000 , which mainly include the processes of bias subtraction, flat correction, skyline substraction, wavelength calibration and flux calibration (Luo et al. 2012). The extracted spectra are then passing through the 1D pipeline to classifying the spectral type and calculating the radial velocity and redshift(Luo et al. 2015b).
3 M-giant spectral templates
3.1 Luminosity class
To determine the luminosity class of M type stars, specialized discrimination-methods have been developed over the years which are based on the colors, proper motions and spectral indices. The color discrimination-method was first introduced by Bessell & Brett (1988). They show that M giants and M dwarfs distribute on the different locus in the [J-H, H-K] color-color diagram, which are mainly caused by the opacity differences of molecular bands of H2O (Bessell et al. 1998). Since M giants and M dwarfs occupied distinct loci, with the giants group having relatively large distant and small proper motion, Lépine & Gaidos (2011) developed a robust method using reduced proper motions ( HV) to separate the two luminosity classes of M type stars. According to the comparison of M giant and M dwarf spectra, Mann et al. (2012) suggested a spectroscopic luminosity class algorithm using several gravity-sensitive molecular and atomic spectral indices. In addition, the Mg2 versus was also used as an effective method for discrimination (Covey et al. 2008).
Since the surface gravity are totally different for giant and dwarf, one can use the spectral features as gravitational indicators to determine the luminosity class. For late-type stars, the comparison of giant and dwarf spectra with similar effective temperature shows that at least six molecular and atomic spectral indices in the optical wavelength bands are sensitive to gravity (Mann et al. 2012), such as Na i (5868-5918 Å), Ba ii/Fe i/Mn i/Ti i (6470-6530 Å), CaH2 (6814-6846 Å), CaH3 (6960-6990 Å), TiO5 (7126-7135 Å), K i (7669-7705 Å), Na i (8172-8197 Å), Ca ii (8484-8662 Å). In our work, considering the narrow wavelength region for atomic spectral indices and possible skylines contamination in red region around 8000 Å, the molecular spectral indices of TiO and CaH were used to separate M giants from dwarfs in the LAMOST DR1 data.
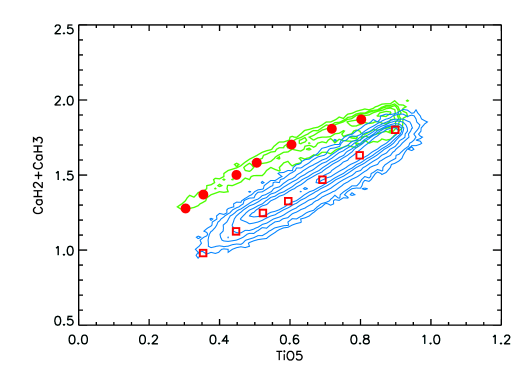
First, we used the template-fit method (Z15) to select M-type spectra which positively present the characteristic molecular features, e.g., TiO, VO and CaH. Then the spectral indices of TiO5, CaH2 and CaH3, as defined by Reid et al. (1995) and Lépine et al. (2007), were calculated. Figure 1 shows the spectral indices diagram for all M type stars we identified in the LAMOST DR1. Two populations are clearly distinguishable in this spectral indices diagram. Giants with weaker CaH molecular bands are located on the upper branch, which are consistent with the giant/dwarf discrimination by Mann et al. (2012). The number of giant candidates in the upper branch are about 10,000.

3.2 Temperature type
As shown in Covey et al. (2007), the SDSS color for late-type stars has shown good relationship with the Morgan-Keenan (MK) spectral subtypes, which spans about 2 mag from M0 to M10. To provide spectral subtypes along the temperature sequence for M giants, we choose the SDSS color as an indicator to classify M giant subtypes.
In order to select high quality LAMOST spectra as training spectra for each spectral subtype grid, we first cross-matched the giant candidates with SDSS DR9 photometric database. Because a large number of LAMOST stars are located in the Galactic anti-center region, only about 3600 candidates have the SDSS photometry information. Next, to reduce the extinction effect and to select reliable photometry, a giant candidate has to meet the following criteria:
(1) The band extinction on the Schlegel’s Galactic extinction map (Schlegel et al. 1998) must be less than 0.2.
(2) The fphotoflags in SDSS photometry must include BRIGHT flag=0, EDGE flag=0, (BLENDED flag NODEBLEND flag)=0, COSMICRAY flag=0 and SATURATED flag=0.
(3) The , color band must distribute on the M type star’s locus with 1.0 1.4 mag and 0.5 2.8 mag.
Upon these criteria, the training sample was cut down from 3600 to 600. Then the remaining giant candidates were confirmed by manual inspection. Giant spectra which are suffer from sky lines contaminations, serious reddening, low signal-to-noise ratio or displaying the characteristic of binary spectrum, were excluded from the training sample. Finally, approximately 200 high quality giant spectra with good photometry in SDSS were left as the training spectra to assemble a grid of temperature sequence.
Table 1 list the color ranges for MK spectral subtype grid, which mainly based on Covey et al. (2007). Since in our sample there is no giant candidate with color greater than 2.0 mag, the synthetic M giant templates span the spectral subtypes from M0 to M6. For spectra with overlapping colors between two spectral type bins, we manually assigned the spectra by eyes and make sure that the difference in spectral type is 1 subtype.
| Spectral Type | |
|---|---|
| M0………….. | 0.50-0.65 |
| M1………….. | 0.58-0.80 |
| M2………….. | 0.70-0.95 |
| M3………….. | 0.90-1.10 |
| M4………….. | 1.00-1.35 |
| M5………….. | 1.30-1.70 |
| M6………….. | 1.60-2.00 |
3.3 Radial velocity correction
To correct the radial velocity for each training spectrum, we manually used the IRAF/rv.rvidlines package to measure the wavelength correction to the zero-velocity rest-frame. Since most of atomic lines in the optical band are weak in the M giant spectrum, the near-infrared calcium (Ca ii) triplet at 8498, 8542, and 8662 Å were predominantly measured as reference-wavelength. In addition, we also used Hα (6563 Å) absorption line to calibrate early type M giants (earlier than M4), which display significant Hα absorption feature. After measuring the wavelength correction, the training spectra were shifted toward blue or red to the zero-velocity rest frame according to their correction. The maximum radial velocity correction in our training sample is approximately equal to 200 km/s. Then the corrected spectra were measured and shifted again. This procedure was repeated until the measured radial velocity for each corrected training spectrum is less than 5 km s-1.
3.4 Template spectra

The wavelength corrected spectra were used to assemble the template spectra before normalizing at 8350 Å (Bochanski et al. 2007). For each spectral subtype bin, at least five training spectra were combined to create the synthetic template spectra.
Figure 2 present the M giant template spectra from M0 to M6, which were assembled by the LAMOST DR1 spectra. From top to bottom, the spectra were presented along their temperature sequence.
To verify the reliability of our subtype classification, we calculate sets of molecular spectral indices in the synthetic template spectra as giants temperature indicators. Figure 3 shows the variations of different spectral indices as a function of our subtype classification. The M giants and dwarfs distribution shown in Figure 1 were represented as green contour and blue contour, respectively. The indices of M giant templates are shown as red dots. From right to left, the template subtypes are from M0 to M6, which means the CaH and TiO molecular absorption bands of late-type template are stronger than the early-type template. As a comparison, we also plot the M dwarf templates indices distribution, which are shown as red squares. The spectral indices distribution of giant templates shows that our template spectra are consist with the M giants branch, and also define a reliable temperature grid.
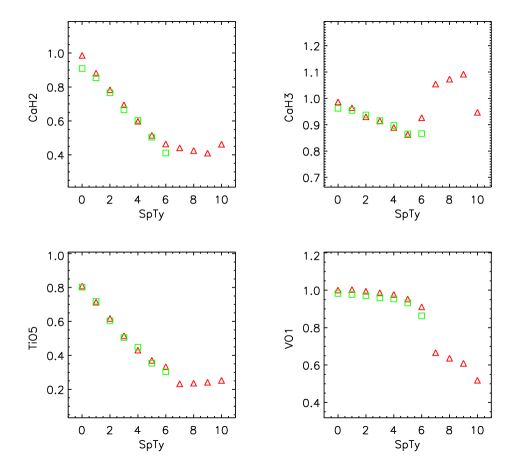
In particular, we compare our M giant templates with Fluks’s templates (Fluks et al. 1994). Figure 4 shows the comparison results of four spectral indices, including CaH2, CaH3, TiO5 and VO1, which were defined in Lépine et al. (2013). The templates of Fluks et al. (1994) were shown as red dots. These intrinsic spectra were derived from 97 very bright M giant stars in the solar neighbourhood, with spectral subtype range from M0 to M10 and wavelength range from 3800 to 9000 . Our templates were shown as green squares. The consistency of spectral indices for early type templates (M0-M5) also indicate the reliability of our classification grid. For late type spectrum M6, there are relatively large difference between two templates. We choose to adopt our template which come from observational spectra assembling rather than interpolated spectra in Fluks et al. (1994).
4 Spectral analyses and classification results
4.1 Spectral classification
In our previous work (Z15), a set of M dwarf templates have been developed as references for automatically identifying and classifying the M dwarfs in the LAMOST spectroscopic data. Our M dwarf templates were assembled from the M dwarf catalog in the SDSS DR7 (West et al. 2011). Based on the spectral index method (Lépine, Rich, & Shara 2003, 2007), we re-classified the M dwarfs into a tentative temperature-metallicity grid with over 18 elements resolution in temperature (K7.0-M8.5) and 12 elements resolution in metallicity (dMr-usdMp). With these well defined M dwarf templates, the template-fit method was used to determine the spectral type of LAMOST stars.
As we described in Z15, although our M dwarf templates provide more reliable estimate of spectral classification by using the template-fit method, because of lacking the M giant templates in our templates library, a fraction of M giants are mis-classified as M dwarfs. To solve this problem, we created a new M-type spectral templates library by combining the M dwarf/subdwarf templates in Z15 and the M giants templates we described above. In the whole M type templates, there are M dwarf templates with temperature from K7.0 to M8.5 and metallicity from dMr to usdMp, and the M giant templates from M0 to M6. The total number of M type templates is 223.
Based on the M-type templates, we re-run our spectral classification pipeline (Z15) to automatically identify and classify M-type stars with spectra from the LAMOST DR1 data source. In order to avoid the additional reddening effect, both template spectra and the LAMOST spectrum were flux-normalized by a pseudo-continuum (See more details in Z15). In the classification pipeline, the template-fit method is used by calculating the chi-square values between the LAMOST spectrum and each of the template spectra. Then, the template spectrum which has the minimum chi-square value is considered as the best-fit, and its spectral subtype is used to mark the corresponding LAMOST spectrum.
After passing through the 2,204,696 LAMOST DR1 spectra to our spectral classification pipeline, we identified 8639 M giants and 101690 M dwarfs/subdwarfs. The excluded spectra were marked as non-M type spectra of which most are earlier type objects like AFGK stars, and a small fraction of spectra were too noisy to be classified.
4.2 Radial velocity
To calculate the radial velocities of all M-type stars in our sample by using the template spectra, the radial velocity correction was applied to shift the templates into a zero-velocity rest frame as much as possible. For the M dwarf templates, the red lines of K i doublet (7667 Å and 7701 Å) and Na i doublet (8185 Å and 8197 Å) were measured. For the M giant templates, we mainly use the Ca ii triplet lines (8498, 8542, and 8662 Å) as reference for correction (see Section 3 for more details). For each template spectrum, the corrected radial velocity is less than 5 km s-1, which is small enough to be considered as the zero-velocity for low resolution spectrum.
After justifying the template spectra to the rest frame, the cross-correlation method were used to calculate the radial velocity of each M giant spectrum in LAMOST DR1. Since the characteristic molecular bands (TiO, CaH, VO) and atomic lines (Ki, Nai, Caii) of M-type stars are mainly distributed in the red part, the rectification area for normalization and cross-correlation is between 6800 Å and 8800 Å, which covers most of characteristic wavelength range in M-type stars. Then, the best-fit template which is determined by the classification pipeline was used to calculate the radial velocity of LAMOST stars.
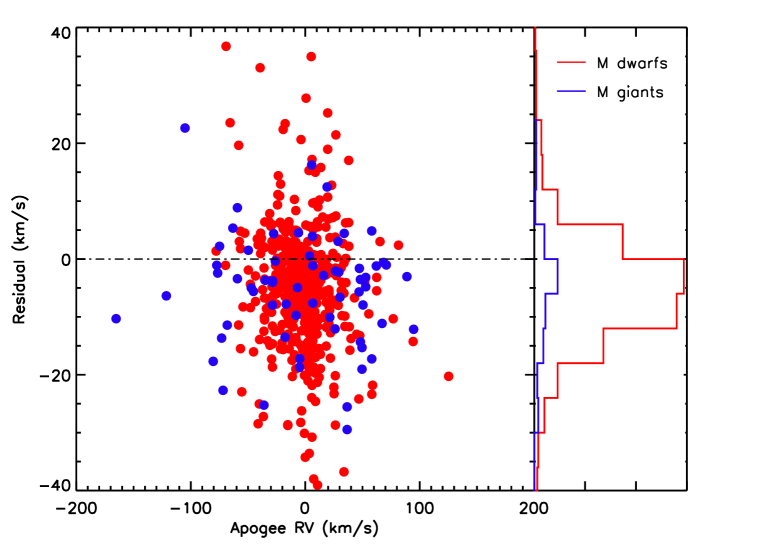
To verify the reliability of our radial velocity measurement, we cross-matched our M-type stars catalog with the APOGEE stellar parameters catalog in DR10. The radial velocity uncertainty in APOGEE data are less than 100 m s-1, which can be considered as standard values. Most of stars in LAMOST DR1 are located at the Galactic Anti-center, there are about 67 giants and 575 dwarfs matched in the LAMOST DR1. We exclude common stars which have low SNR in the LAMOST spectra ( SNR 10 ) or very strange outlier values ( the total numbers are less than 20 ). Finally, we calculate the RV residual values ( RVLAMOST-RVAPOGEE) of 59 common giants and 416 common dwarfs. The RV residual distribution of M giants and M dwarfs are shown in Figure 5. The mean and standard deviation of RV errors in Gaussian fitting are -5.0 8.4 km s-1 for giants and-5.3 6.9 km s-1 for dwarfs. When the SNR criteria of common stars is increased to 30, which reduce the number of giants to 39 and dwarfs to 157, we find that the mean and standard deviation of RV errors are -4.4 8.1 km s-1 and -5.8 6.5 km s-1, corresponding to the M giants and M dwarfs respectively.
4.3 Estimation of the spectroscopic distance
To estimate the distances of M-type stars in our sample, we mainly used two independent relationship between the absolute infrared magnitude (MJ) and the spectroscopic type (SpTy). For M dwarfs, the relationship function was derived by nearby M dwarfs with both spectral types and parallax measurements (Z15). Since most of M dwarfs in our sample are distributed in the solar vicinity, their extinction correction are negligible in the near infrared J band. For M giants, the relationship was referred to the flux calibration and absolute magnitude calculation in the 2MASS system (Covey et al. 2007). Considering that most of M giants are distributed in the distant region, the M giants sample are corrected for extinction using the dust map from Schlegel et al. (1998) and the extinction law from Li et al.(2015, in preparation). This extinction law suggest that the extinction coefficients are correlated with Galactic latitude, which is believed to be more reliable in the extinction calculation, especially in the low Galactic latitude. The extinction coefficients toward the Galactic Anti-center are provided in the Appendix of Li et al.(2015, in preparation). Considering the magnitude and extinction uncertainties of 2MASS, the distance accuracy of M dwarfs/giants sample were estimated as 40%.
4.4 Catalog description
In our M-type stars catalog, the proper motion came from the cross-matching with PPMXL catalog (Roëser et al. 2010), the infrared photometric information are from the 2MASS catalog (Skrutskie et al. 2006) for JHKs band and WISE catalog (Wright et al. 2010) for W1 and W2 band. The M giant and M dwarf candidates are listed in Table 2, each of them with ten targets as examples. The completed M giant and M dwarf stars catalog are provided in the electronic version, including the designation in the LAMOST DR1 catalog, the celestial coordinates in epoch 2000, the proper motions and their measurement errors, the infrared photometric magnitudes, the radial velocity measured by our spectral template, the spectroscopic distance we estimated and the spectral subtypes which were classified by our classification pipeline.
Based on our classification, M giants are classified along the temperature sequence, labeled as [gM0.0, gM1.0, gM2.0, gM3.0, gM4.0, gM5.0, gM6.0]. Following the M dwarfs classification in Z15, M dwarfs are classified in the temperature-metallicity grid, which shows [dMr, dMs, dMp, sdMr, sdMs, sdMp, esdMr, esdMs, esdMp, usdMr, usdMs, usdMp] in metallicity and [ K7.0, K7.5, M0.0, M0.5, M1.0, M1.5, M2.0, M2.5, M3.0, M3.5, M4.0, M4.5, M5.0, M5.5, M6.0, M6.5, M7.0, M7.5, M8.0, M8.5] in temperature ( See more details in Z15).
| Designation | Ra | Dec | J | H | Ks | W1 | W2 | RV | Dist | SpTy | ||
| deg | deg | mas yr-1 | mas yr-1 | mag | mag | mag | mag | mag | km s-1 | kpc | ||
| J040505.40+285943.6 | 61.27254 | 28.995465 | 4.0 5.0 | -6.7 5.0 | 10.488 | 9.479 | 9.230 | 9.118 | 9.243 | -4.3 | 5.16 | gM0.0 |
| J040611.64+261916.6 | 61.54850 | 26.321288 | -2.7 4.4 | -4.9 4.4 | 9.529 | 8.624 | 8.382 | 8.279 | 8.441 | 28.4 | 3.54 | gM0.0 |
| J041023.67+272143.6 | 62.59864 | 27.362117 | 0.0 5.2 | -2.9 5.2 | 10.595 | 9.734 | 9.480 | 9.358 | 9.479 | -19.6 | 5.30 | gM0.0 |
| J040325.49+293108.0 | 60.85623 | 29.518914 | -0.6 5.2 | -4.9 5.2 | 8.485 | 7.501 | 7.141 | 6.985 | 7.169 | 28.4 | 1.83 | gM5.0 |
| J040329.01+263653.4 | 60.87091 | 26.614842 | -7.7 4.4 | -4.9 4.4 | 8.661 | 7.676 | 7.316 | 7.197 | 7.330 | 60.4 | 1.95 | gM5.0 |
| J070225.22+282327.1 | 105.60509 | 28.390873 | 5.7 5.1 | -4.7 5.1 | 9.909 | 8.928 | 8.656 | 8.535 | 8.615 | 22.1 | 3.60 | gM4.0 |
| J065424.57+303015.0 | 103.60241 | 30.504168 | -5.9 4.1 | 1.4 4.1 | 11.229 | 10.433 | 10.197 | 10.126 | 10.246 | 4.0 | 7.71 | gM0.0 |
| J065153.21+290913.0 | 102.97172 | 29.153617 | -0.7 4.9 | -0.2 4.9 | 10.897 | 10.065 | 9.856 | 9.778 | 9.911 | 5.9 | 6.89 | gM0.0 |
| J065849.31+303318.9 | 104.70546 | 30.555272 | 3.7 5.1 | -6.5 5.1 | 11.062 | 10.197 | 9.972 | 9.891 | 10.030 | 19.1 | 7.32 | gM1.0 |
| J065708.89+303001.0 | 104.28708 | 30.500294 | 0.3 5.0 | -9.4 5.0 | 10.900 | 10.063 | 9.830 | 9.722 | 9.850 | 13.5 | 6.42 | gM0.0 |
| J072547.23+300200.1 | 111.44681 | 30.033388 | -2.3 3.9 | -12.9 3.9 | 15.062 | 14.371 | 14.251 | 14.140 | 14.122 | -8.4 | 0.78 | dMr0.0 |
| J072602.89+303838.5 | 111.51205 | 30.644054 | 9.4 3.8 | -22.1 3.8 | 14.648 | 14.013 | 13.732 | 13.682 | 13.586 | -9.9 | 0.37 | dMp1.5 |
| J072724.80+305120.1 | 111.85334 | 30.855586 | 18.8 3.9 | -12.5 3.9 | 14.817 | 14.227 | 14.125 | 13.963 | 13.954 | -98.9 | 0.58 | dKp7.5 |
| J072650.49+293305.8 | 111.71040 | 29.551627 | -7.1 3.8 | -18.7 3.8 | 14.473 | 13.830 | 13.687 | 13.554 | 13.526 | 56.4 | 0.45 | sdMr0.0 |
| J072621.99+302531.5 | 111.59163 | 30.425433 | 0.7 3.9 | -4.9 3.9 | 14.976 | 14.332 | 14.278 | 14.062 | 14.142 | 18.2 | 0.75 | sdKr7.5 |
| J071731.61+322753.9 | 109.38173 | 32.464975 | -8.0 4.0 | -29.5 4.0 | 12.833 | 12.206 | 11.927 | 11.827 | 11.683 | -86.2 | 0.10 | dMr4.0 |
| J072423.08+285503.2 | 111.09618 | 28.917578 | -2.9 4.0 | -6.9 4.0 | 15.037 | 14.425 | 14.213 | 14.163 | 14.266 | -212.8 | 0.77 | dKs7.0 |
| J072557.18+291137.1 | 111.48827 | 29.193658 | 9.1 3.8 | -10.1 3.8 | 14.300 | 13.648 | 13.431 | 13.371 | 13.290 | 18.6 | 0.35 | dMr1.5 |
| J072106.54+284001.0 | 110.27729 | 28.666959 | -5.4 3.9 | -23.0 3.9 | 14.347 | 13.670 | 13.462 | 13.460 | 13.526 | 6.5 | 0.56 | dKr7.5 |
| J072037.71+292324.7 | 110.15716 | 29.390220 | 1.1 3.9 | -3.1 3.9 | 14.565 | 13.855 | 13.617 | 13.561 | 13.495 | 8.5 | 0.43 | dMp0.5 |
| Notes: Designation is from the LAMOST DR1; cos() and are poper motions from the PPMXL; J, H, and are 2MASS near infrared magnitude; W1 and W2 are WISE | ||||||||||||
| infrared magnitude; RV is the radial velocity we measured from the LAMOST spectra; Dist is the spectroscopic distance based on the Mj magnitude; SpTy is the spectral subtype | ||||||||||||
| classified by our template fit pipeline. The entire table is in its electric form. | ||||||||||||
5 Conclusions and discussion
We have successfully assembled a set of M giant templates from M0 to M6 by using the LAMOST DR1 spectra. After combining the M giant templates and M dwarf/subdwarf templates as a new M-type spectral library, we re-run the updated classification pipeline to identify and classify M-type stars in the LAMOST DR1. The 8639 M giants and the 101690 M dwarfs/subdwarfs are cataloged. We present the information of celestial coordinates, JHKs infrared magnitudes in 2MASS, spectral subtypes, radial velocity and derived spectroscopic distance.
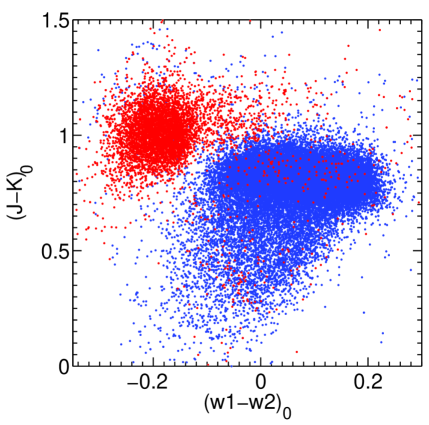
Based on our M-type stars catalog, Li et al. (2015,in preparation) developed a new photometric method to separate M giants from M dwarfs catalog. The WISE bands are found to be more efficient to separate M giants and dwarfs than the 2MASS bands. Figure 6 shows the distribution of our M giants and dwarfs catalog in [J-Ks,W1-W2] color-color diagram. Two colors represent M giants (red dots) and dwarfs (blue dots) sample which were classified by our spectral classification pipeline. As expected, there are significant difference between the giants and dwarfs in the infrared colors. By using the criteria of mean SNR greater than 5, the M dwarf contamination rate is about 4.7 % in our giant sample and the M giant contamination rate is about 0.2 % in our dwarf sample. By increasing the SNR criteria of our sample, the contamination rate will be smaller.
In Figure 6, we note that there is a tail in the giants sample, from -0.1 to 0.1 in the (W1-W2)0 and 0.9 to 1.3 in the (J-Ks)0. We carefully examine these tail stars and believe that they are more likely to be metal poor stars ( see more details in Li et al.2015,in preparation).
Although the different locations of M giants and M dwarfs sample in Figure 6 clearly shows that our classification pipeline separate the two stellar populations more efficiently, a small number of outliers in the giant sample are located on the dwarf region (-0.1 (W1-W2)0 0, 0 (J-Ks)0 0.7). After checking these stars by their spectra, we find that the possible contamination are including late K-type dwarfs, early M dwarfs, binaries as well as some low S/N spectra.
Acknowledgements.
We thank Guhathakurta Puragra and Katie Hamren for helpful information and comments. This research was supported by ‘973 Program’ 2014 CB845702, the Strategic Priority Research Program ”The Emergence of Cosmological Structures” of the Chinese Academy of Sciences, Grant No. XDB09000000, and the National Science Foundation of China (NSFC) under grants 11173044 (PI:Hou), by the Shanghai Natural Science Foundation 14ZR1446900 (PI:Zhong), by the Key Project 10833005 (PI:Hou), and by the Group Innovation Project NO.11121062. Guoshoujing Telescope (the Large Sky Area Multi-Object Fiber Spectroscopic Telescope LAMOST) is a National Major Scientific Project built by the Chinese Academy of Sciences. Funding for the project has been provided by the National Development and Reform Commission. LAMOST is operated and managed by the National Astronomical Observatories, Chinese Academy of Sciences.References
- Allen & Strom (1995) Allen, L. E., & Strom, K. M. 1995, AJ, 109, 1379
- Bessell & Brett (1988) Bessell, M. S., & Brett, J. M. 1988, PASP, 100, 1134
- Bessell et al. (1998) Bessell, M. S., Castelli, F., & Plez, B. 1998, A&A, 333, 231
- Bochanski et al. (2007) Bochanski, J. J., West, A. A., Hawley, S. L., & Covey, K. R. 2007, AJ, 133, 531
- Bochanski et al. (2014a) Bochanski, J. J., Willman, B., West, A. A., Strader, J., & Chomiuk, L. 2014a, AJ, 147, 76
- Bochanski et al. (2014b) Bochanski, J. J., Willman, B., Caldwell, N., et al. 2014b, ApJ, 790, L5
- Chen et al. (2012) Chen, L., Hou, J.-L., Yu, J.-C., et al. 2012, Res. Astron. Astrophys., 12, 805
- Covey et al. (2007) Covey, K. R., Ivezić, Ž., Schlegel, D., et al. 2007, AJ, 134, 2398
- Covey et al. (2008) Covey, K. R., Hawley, S. L., Bochanski, J. J., et al. 2008, AJ, 136, 1778
- Cui et al. (2012) Cui, X.-Q., Zhao, Y.-H., Chu, Y.-Q., et al. 2012, Research in Astronomy and Astrophysics, 12, 1197
- Deng et al. (2012) Deng, L. C., Newberg, H. J., Liu, C., et al. 2012, Res. Astron. Astrophys., 12, 735
- Danks & Dennefeld (1994) Danks, A. C., & Dennefeld, M. 1994, PASP, 106, 382
- Fluks et al. (1994) Fluks, M. A., Plez, B., The, P. S., et al. 1994, A&AS, 105, 311
- Lançon & Wood (2000) Lançon, A., & Wood, P. R. 2000, A&AS, 146, 217
- Lawrence et al. (2007) Lawrence, A., Warren, S. J., Almaini, O., et al. 2007, MNRAS, 379, 1599
- Lépine, Rich, & Shara (2003) Lépine, S., Rich, R. M., & Shara, M. M. 2003, AJ, 125, 1598
- Lépine et al. (2007) Lépine, S., Rich, R. M., & Shara, M. M. 2007, ApJ, 669, 1235
- Lépine, Rich, & Shara (2007) Lépine, S., Rich, R. M., & Shara, M. M. 2007, ApJ, 669, 1235
- Lépine & Gaidos (2011) Lépine, S., & Gaidos, E. 2011, AJ, 142, 138
- Lépine et al. (2013) Lépine, S., Hilton, E. J., Mann, A. W., et al. 2013, AJ, 145, 102
- Luo et al. (2012) Luo, A., Zhang, H., Zhao, Y., Zhao, G., Cui, X., Li, G., Chu, Y., et al. 2012, Res. Astron. Astrophys., 12, 1243
- Luo et al. (2015a) Luo A.-L. et al., 2015a, RAA, in press
- Luo et al. (2015b) Luo A.-L. et al., 2015b, RAA, in press
- Mann et al. (2012) Mann, A. W., Gaidos, E., Lépine, S., & Hilton, E. J. 2012, ApJ, 753, 90
- Majewski et al. (2003) Majewski, S. R., Skrutskie, M. F., Weinberg, M. D., & Ostheimer, J. C. 2003, ApJ, 599, 1082
- Majewski et al. (2011) Majewski, S. R., Zasowski, G., & Nidever, D. L. 2011, ApJ, 739, 25
- Montes et al. (1999) Montes, D., Ramsey, L. W., & Welty, A. D. 1999, ApJS, 123, 283
- Reid et al. (1995) Reid, I. N., Hawley, S. L., & Gizis, J. E. 1995, AJ, 110, 1838
- Roëser et al. (2010) Roëser S., Demleitner M., & Schilbach E. 2010, AJ, 139, 2440
- Skrutskie et al. (2006) Skrutskie, M. F., Cutri, R. M., Stiening, R., et al. 2006, AJ, 131, 1163
- Schlegel et al. (1998) Schlegel, D. J., Finkbeiner, D. P., & Davis, M. 1998, ApJ, 500, 525
- Sharma et al. (2010) Sharma, S., Johnston, K. V., Majewski, S. R., et al. 2010, ApJ, 722, 750
- West et al. (2011) West, A. A., Morgan, D. P., Bochanski, J. J., et al. 2011, AJ, 141, 97
- Wright et al. (2010) Wright, E. L., Eisenhardt, P. R. M., Mainzer, A. K., et al. 2010, AJ, 140, 1868
- York et al. (2000) York, D. G., Adelman, J., Anderson, J. E., Jr., et al. 2000, AJ, 120, 1579
- Yi et al. (2014) Yi, Z., Luo, A., Song, Y., et al. 2014, AJ, 147, 33
- Zhao et al. (2012) Zhao, G., Zhao, Y.-H., Chu, Y.-Q., Jing, Y.-P., & Deng, L.-C. 2012, Research in Astronomy and Astrophysics, 12, 723
- Zhong et al. (2015) Zhong, J. et al. 2015, AJ, submitted (arXiv:1505.01592)