Widespread Galactic CF+ absorption:
detection toward W49 with the Plateau de Bure Interferometer
Abstract
Aims. To study the usefulness of CF+ as a tracer of the regions where C+ and coexist in the interstellar medium.
Methods. We used the Plateau de Bure Interferometer to synthesize CF+ J=1-0 absorption at 102.6 GHz toward the core of the distant HII region W49N at l = 43.2o, b=0.0o, and we modeled the fluorine chemistry in diffuse/translucent molecular gas.
Results. We detected CF+ absorption over a broad range of velocity showing that CF+ is widespread in the -bearing Galactic disk gas.
Conclusions. Originally detected in dense gas in the Orion Bar and Horsehead PDR, CF+ was subsequently detected in absorption from diffuse and translucent clouds seen toward BL Lac and 3C111. Here we showed that CF+ is distributed throughout the diffuse and translucent molecular disk gas with N(CF+)/N() , increasing to N(CF+)/N() in one cloud at 39 km s-1 having higher N() . Models of the fluorine chemistry reproduce the observed column densities and relative abundance of HF, from which CF+ forms, but generally overpredict the the column density of CF+ by factors of 1.4-4. We show that a free space photodissociation rate , comparable to that of CH, might account for much of the discrepancy but a recent calculation finds a value about ten times smaller. In the heavily blended and kinematically complex spectra seen toward W49, CF+ absorption primarily traces the peaks of the distribution.
Key Words.:
interstellar medium – abundances1 Introduction
Recent advances in mm- and sub-mm astronomical spectroscopy open the possibility of tracing in interstellar gas over a much wider range of column density and -fraction, even when carbon monoxide, the usual surrogate tracer of is not observed. One new -tracer is HF (Sonnentrucker et al., 2010; Gerin et al., 2012; Sonnentrucker et al., 2015) which is predicted to contain much or most of the gas-phase fluorine even when the -fraction is small (Neufeld & Wolfire, 2009). The abundance of fluorine in diffuse neutral gas is well-established (Snow et al., 2007) and the HF/ ratio is relatively insensitive to physical conditions, so that N(HF) is a useful estimator of N().
Ground-state absorption from HF is observed at 1.2 THz. Observing this is a challenge now, but HF forms the basis for an observable fluorine chemistry that is accessible at mm-wavelengths via CF+ (Neufeld et al., 2006; Guzmán et al., 2012a, b) whose ground state J=1-0 rotation transition is at 102.6 GHz. CF+ is an immediate descendant of HF, formed in the reaction C+ + HF CF+ + H and destroyed by recombination with electrons (Neufeld & Wolfire, 2009). Because C+ is the dominant form of gas-phase carbon well beyond AV = 1 mag (Sofia et al., 2004; Burgh et al., 2010), and because the CF+/HF and CF+/ ratios are easily modelled, CF+ may also be a useful tracer of molecular gas where C+ is abundant. It thus has the potential to identify the fraction of C+ arising in molecular gas.
CF+ was discovered in a targeted observation of the Orion Bar (Neufeld et al., 2006), subsequently detected in a 3mm spectral sweep of the Horsehead PDR (Guzmán et al., 2012a) and then detected in a 3mm spectral sweep of the absorption spectra of diffuse and translucent clouds occulting BL Lac and 3C111 (Liszt et al., 2014). Fechtenbaum et al. (2015) recently detected CF+ emission toward a high-mass protostar in a similar spectral sweep and used it to infer a source of carbon ionization in the collapsing protostellar envelope.
Here we show that CF+ is observable in gas seen along the line of sight to the giant HII region W49N at o, o at a distance of 11.1 kpc (Zhang et al., 2013) and more generally in the gas that gathers near the terminal velocity at v km s-1 due to velocity-crowding (Burton, 1971). As a result, CF+ is clearly established as a commonly-distributed species in diffuse molecular gas.
The structure of this work is as follows. In Sect. 2 we describe the new and existing observational material that is discussed. In Sect. 3 we present the detection spectrum of CF+ toward W49N and compare its kinematics and column densities with those of other species seen in absorption along the same sightline. In Sect. 4 we compare the column densities of HF and CF+ with models of the fluorine chemistry in diffuse/translucent clouds and Sect. 5 is a summary.
2 Observations and data reduction
2.1 PdBI absorption measurements toward W49N
We observed the CF+ J=1-0 line at 102.587 GHz (Table 1) with the Plateau de Bure Interferometer during 34 hours of telescope time, corresponding to 9.3 hours of on-source time scaled to a six antenna array, after filtering out low-quality visibilities. The observations were carried out in August and September 2013 in the D configuration, achieving a spatial resolution of 5.95′′ 4.72′′ so that 1 Jy/beam is equivalent to 4.14 K. The typical precipitable water vapor amounted to 6 mm with a typical system temperature of 150 K. The bright quasars 3C454.3 and 3C279 were used to calibrate the bandpass. The phase and amplitude temporal variations were calibrated by regularly observing two nearby quasars (1827062 and 1923210). The absolute flux scale was derived from observations of MWC349. The calibration and imaging of the PdBI data was done with the GILDAS111See http://www.iram.fr/IRAMFR/GILDAS for more information about the GILDAS software (Pety, 2005)./CLIC and MAPPING software. The data were gridded onto a 1.24′′pixel spatial map with rms noise 0.0105 Jy/beam in spectral channels of width, spacing and resolution 78.1 kHz or 0.228 km s-1.
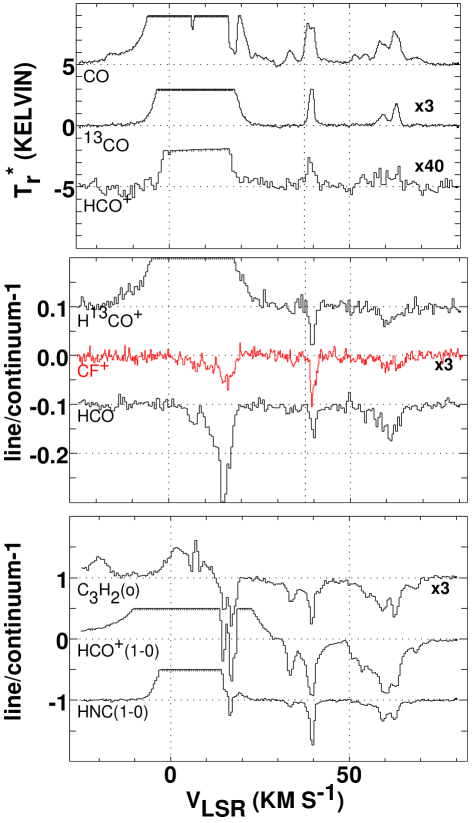
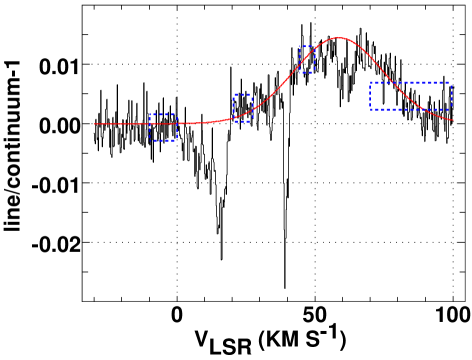
The 3mm continuum peaked at (J2000) = 19h10m13.45s, (J2000) = 9o06′13.2′′ or o, o in Galactic coordinates, with a flux of 3.59 Jy/beam. The CF+ absorption line profile was extracted at a position with a cleaner spectral baseline that was displaced one pixel to the West and South having a flux of 3.47 Jy/beam, leading to a channel-channel rms line/continuum ratio of . The CF+ spectrum is shown in the middle panel of Fig. 1. The CF+ absorption is overlain by the emission profile of an H66 recombination line from the ionized gas and the procedure for extracting the CF+ absorption profile in the presence of the recombination line is described in Appendix A.
2.2 Other absorption profiles toward W49N
For comparison with other species observed in the 3mm band we used the absorption profiles of HNC and taken at the IRAM 30m telescope by Godard et al. (2010), along with similar profiles of C3H2, C2H (Gerin et al., 2011) and H13CO+. These spectra have 39 kHz channel spacing and 78 kHz spectral resolution equivalent to 0.117 km s-1 spacing at 100 GHz. The HCO spectrum shown in Fig. 1 is from Liszt et al. (2014), shown at 0.270 km s-1 channel spacing and resolution. For CH we used the hyperfine-deconvolved 532 GHz absorption profile from Gerin et al. (2010) at 0.135 km s-1 spacing and resolution, for HF the profile of Sonnentrucker et al. (2010) at 0.141 km s-1 spacing and resolution and for C+ a smoothed absorption spectrum from Gerin et al. (2015) at 0.63 km s-1 spacing and resolution. The sub-mm profiles were taken as as part of the Herschel PRISMAS Project. The 3mm profiles are shown in Fig. 1 and with the spectrum of CH in Fig. 2. Profiles of the C+ and HF absorption lines can be seen in Fig. 4. Line frequencies and optical depth-column density conversions for these species are given in Table 3.
When profiles are compared on a channel-by-channel basis the narrower of the two was convolved to the spectral resolution of the other using a gaussian kernel and then regridded using cubic splines to create a common velocity axis.
2.3 CO and J=1-0 emission
The emission profiles shown in the top panel of Fig. 1 were acquired at the original ARO 12m telescope during April of 2011 by position switching against a distant off position whose spectrum was determined by position switching against another similarly distant off-position and added back to the data. The beamwidth of this antenna was 1′ at 110 GHz, scaling inversely with frequency. The temperature scale of the ARO 12m telescope, like that of the NRAO 12m telescope before it, was T, approximately 0.85 Tmb. The emission spectra have spectral resolution and channel spacing 48.8 kHz. The spectrum shown in Fig. 1 is the average of four spectra taken at positions displaced ′ to the East and North, to avoid contamination of the very weak emission by absorption. The CO profiles were taken directly toward the continuum, as the W49N continuum was a small fraction of a Kelvin at the ARO 12m antenna. Reliably observing carbon monoxide in absorption toward W49N would require spatial resolution and resolved flux substantially exceeding those achieved in the PdBI synthesis of CF+ here, for which the peak flux of 3.6 Jy/beam was equivalent to 15 K. This is not so much larger than the 4 K emission brightness of CO that a pure absorption spectrum could be acquired.
2.4 Optical depths, error estimates, upper limits and column density conversions
The spectroscopic parameters of the observed CF+ transitions are given in Table 1 and optical depth integrals for CF+ and other species discussed here are given in Table 2. Quantities in parentheses in Table 2 are 1 rms errors in the tabulated quantities determined from the rms noise level at zero absorption but accounting for the saturation in the absorption line profile. Where the integrated optical depth was detected at a level well below the integral is shown as zero and upper limits are plotted in the various Figures.
In the present experiment the hyperfine structure of CF+ was unresolved and the integrated optical depth is 50% larger than if the stronger component had been observed alone. Hence N(CF+) is derived from the integrated optical depth in Table 2 using N(CF+) = with the optical depth integral expressed in km s-1. Conversion factors between integrated optical depth and column density are given separately in Table 3, assuming excitation in equilibrium with the cosmic microwave background.
3 The line of sight toward W49N
3.1 Line profiles
3mm line profiles observed toward W49N are shown in Fig. 1. Emission lines from dense gas in the W49N complex peak at 0 - 15 km s-1 but may have broad wings extending well beyond this range: CF+ and HCO are notable exceptions because they do not appear in emission at the PdBI. When the emission is not too broad the continuum and the source emission profiles are noticeably absorbed at 5-20 km s-1. Much of this absorption is due to gas within and on the near-side of the W49N complex itself: The relationship between emission and absorption profiles of HCO and H13CO+ as seen by the PdBI toward W49N is shown in Fig. 4 of Liszt et al. (2014). Interstellar absorption from gas lying closer to the Sun must also be present at v 20 km s-1 but is masked by the contribution from W49N. As shown in Appendix B, the velocity range v 20 km s-1 corresponds to the nearest 1.75 kpc along the line of sight.
At bottom in Fig. 1 are strong interstellar absorption lines of HNC, and C3H2, representing three distinct chemical families. (Lucas & Liszt, 1996) and the hydrocarbons CH (Gerin et al., 2010), C2H and C3H2 (Lucas & Liszt, 2000; Gerin et al., 2011) are especially ubiquitous and show the widest range of absorption. The hydrocarbons and have rather stable abundances with respect to , which we use to derive column densities of using X(CH) = N(CH)/N() (Sheffer et al., 2008) toward W49N and X() (Table 4 and Liszt et al. (2010)) for quasar lines of sight where CH was not observed. Scatter in the CH- relationship, uncorrected for measurement errors, is a factor 1.6 as employed in Fig. 5. The column densities of CN, HNC and HCN vary together in fixed proportion but only achieve high abundance relative to at higher N() (Liszt & Lucas, 2001; Godard et al., 2010) and presumably at somewhat higher number density as well. For this reason they have more limited absorption profiles but serve to distinguish the more diffuse molecular gas.
In the middle panel of Fig. 1 are profiles of three weaker-lined species including the detection spectrum of CF+. With sufficient sensitivity the interstellar H13CO+ and absorption profiles would presumably be identical in shape. With the present sensitivity all of these species show absorption over only a limited range, most notably in the 40 km s-1 cloud feature, but also in the terminal-velocity ridge above 60 km s-1.
At top in Fig. 1 are J=1-0 emission profiles of CO (12CO), and . It is notable that CO emission is detected at all velocities at which absorption is observed in the hydrocarbons and . is detected over a more limited range, in part due to considerations of signal/noise for the weaker line. The emission at 33 km s-1 has a very high ratio of CO to emission, presumably reflecting optically thin emission and a small CO column density.
3.2 Line of sight kinematics
The kinematic characteristics of the absorption profiles toward W49N result from several influences as illustrated in Fig. B.1 and discussed in Appendix B. W49N is 11.10.8 kpc distant from the Sun (Zhang et al., 2013), hence at galactocentric radius R = 7.6 kpc, just inside the Solar Circle on the other side of the Galaxy for a Sun-center distance of 8.5 kpc. Hence lines originating within the W49N complex are closest to 0-velocity because of its inadvertent proximity to the Solar Circle on the far side of the Galaxy. The highest velocities appearing in emission or absorption in Fig. 1 correspond quite well to the maximum velocity predicted for a flat rotation curve with R0 = 8.5, = 220 km s-1 as shown in Fig. B.1. An apparent concentration of gas arises at the high-velocity end of the line profiles as the result of velocity-crowding (Burton, 1971), as the slope of the velocity-distance relationship approaches 0 at the so-called sub-central point where the line of sight passes nearest to the center of the Galaxy. Gas is concentrated into the velocity range 30 - 40 km s-1, with notable gaps at higher and lower velocity, owing to sharp changes in the velocity-distance relationship resulting from spiral-arm streaming. This has not been extensively modeled for W49N but a detailed discussion of the influence of spiral arm streaming along the sightline toward W43 is given in Liszt et al. (1993).
3.3 Column densities and cloud properties
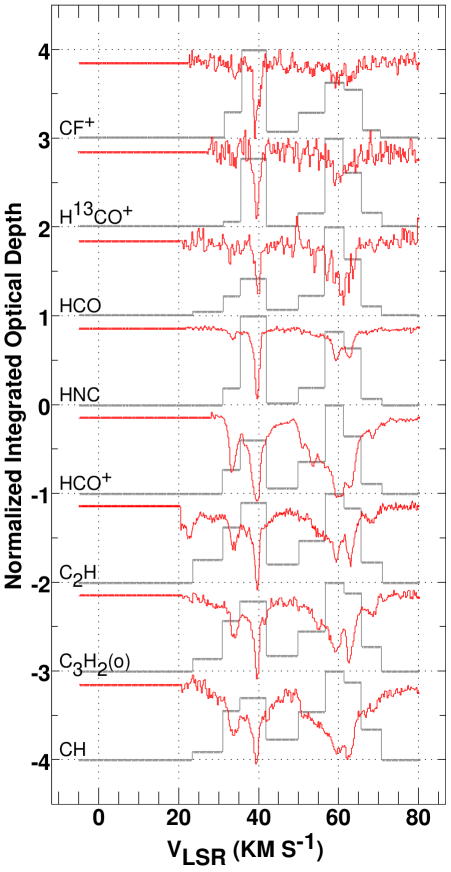
To give a broad characterization of the properties of the gas lying along the sightline to W49N we divided the velocity range of the interstellar absorption into a set of intervals based on the apparent features in the absorption profiles, and we calculated the integrated absorption optical depth for a variety of molecules shown in Fig. 1 and 2, as given in Table 2. It is tempting to identify narrow-lined spectral features with individual clouds, especially at 39 km s-1, but there is severe blending at all velocities. The species in Table 2 include the three hydrocarbons CH, C2H and C3H2 that are known to track each other (Gerin et al., 2011) and to trace , and that also has a relatively stable relative abundance with respect to . The hydrocarbons and have much more broadly distributed absorption than HNC, for instance, even though the peak absorption is not much different.
The results are shown graphically in Fig. 2 where the histograms of integrated optical depth and the line profiles are shown superposed. In each case the histogram is normalized to have a unit peak. Species which most closely track the total column density of without regard to the number or column densities of individual regions (the hydrocarbons and ) have higher column density over the terminal velocity ridge around v = 60 km s-1. The hydrocarbons and also have a relatively high ratio of absorption at 33 km s-1 compared to that at 39 km s-1. HNC, which is known to be more abundant in individual clouds of higher column density (Liszt & Lucas, 2001), behaves oppositely to the hydrocarbons and . HCO is an extreme example of a species appearing preferentially in the more diffuse gas in the terminal velocity ridge. CF+ is clearly most similar to HNC, which is something of a surprise given its origin in HF, which tracks , and C+ that is ubiquitous (see Sect. 4 and Fig. 4).
The optical depth integrals in Table 2 are converted to relative abundance N(X)/N() in Table 4 using the column density-optical depth conversion factors given in Table 3 to form the ratio N(X)/N(CH) and N(CH)/N() . Shown at the bottom of Table 4 are two summary quantities: the mean relative abundance found by integrating over the profiles of the species listed relative to the total CH column density, and the mean and rms of the individual entries in the Table, for those intervals where the species in question was detected. As noted by Gerin et al. (2011) the hydrocarbons have quite stable abundances relative to each other: C2H and C3H2 have rms of 20% or less of their mean table entries. HF is also relatively stable with respect to CH, with a fractional rms of 23%. The fractional rms of and HCO are intermediate, 42%, and those of CF+ and HNC are the largest, 48% and 69%, respectively. The overall average abundance X() = is consistent with the value X() = derived from quite other considerations by Liszt et al. (2010).
In all, the results in Table 4 shows an impressive consistency of the diffuse cloud chemistry over the Galactic disk, and validates the empirical methods that have been used across many spectral domains to extract molecular column densities and relative abundances.
4 The abundance and chemistry of CF+
4.1 N(CF+) and chemical relationships
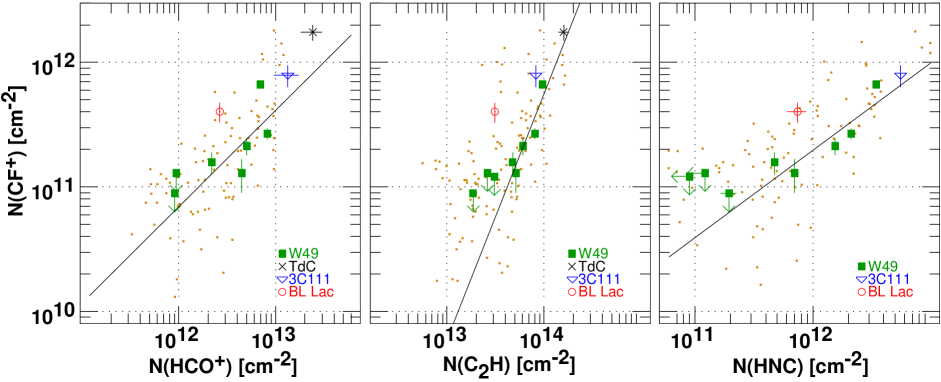
Extending the analysis in Liszt et al. (2014), Fig. 3 shows the CF+ column density with respect to , C2H and HNC for W49N and for the sightlines observed toward compact extragalactic continuum sources BL Lac and 3C111, as well as data taken toward the Horsehead PDR. Shown for W49N are the integrals tabulated in Table 2 and the cloud of channel-by-channel datapoints equally scaled in both dimensions so as to overlay the datapoints while preserving the slope. Shown in each panel is a regression line fit to the W49N detections alone. The slopes of these fits are for , for C2H and for HNC.
The velocity ranges chosen toward W49N have column densities of , C2H and HNC overlapping those seen toward BL Lac and 3C111 and the regression line fits show a high degree of consistency between the W49N sightline, 3C111 and, where possible, the Horsehead PDR. The line of sight toward BL Lac is an obvious outlier, with 2-3 times more CF+ compared to the other datapoints. The 39 km s-1 cloud toward W49N is a lesser outlier with respect to .
A striking aspect of Fig 3 is the quadratic slope of the CF+-C2H relationship as compared with the much slower than linear variation with respect to HNC. This is indicative of a rapid variation of N(HNC) with N(C2H), as was in fact shown in Fig. 3 of Liszt & Lucas (2001): N(HNC) increases abruptly by about a factor 100 in individual cloud features for N(C2H) , and also for N() . By contrast, CF+ has a faster than linear variation only with C2H.
| Frequency | F′ - F | J′ - J | AF′,F | N(X)/ |
|---|---|---|---|---|
| MHz | 10-6s-1 | |||
| 102587.189 | 1/2-1/2 | 1-0 | 4.82 | |
| 102587.533 | 3/2-1/2 | 1-0 | 4.82 |
a Spectroscopic data from Guzmán et al. (2012b) and www.splatalogue.net
b Assuming excitation in equilibrium with the cosmic microwave background
4.2 Modelling the fluorine chemistry
The fluorine chemistry of diffuse and translucent gas has been summarized by Neufeld & Wolfire (2009). It is dominated by the formation of HF, which is expected to contain much or most of the free gas-phase fluorine in regions where the fraction is appreciable. However, as noted by Sonnentrucker et al. (2015), the rate constant for the primary reaction governing the formation of HF, F + HF + H, has recently been found to be rather smaller at low temperature than previously believed (Tizniti et al., 2014). This complicates discussion of the fluorine chemistry because the HF/ ratio is more variable, and generally smaller, than in the models of Neufeld & Wolfire (2009), see Sonnentrucker et al. (2015).
HF is also formed in a minor way by the reaction of neutral fluorine atoms with CH, OH, and, more slowly, with water. In diffuse gas, HF is destroyed in reaction with C+ (the primary process, forming CF+), in reaction with He+ (created by cosmic-ray ionization) and by photodissociation. CF+ is destroyed only by electron recombination in the chemical model of Neufeld & Wolfire (2009) that was adopted here. Because C+ usually dominates both the formation and destruction of CF+ in diffuse gas, the CF+/HF ratio is generally insensitive to the number density as long as C+ is the dominant form of gas-phase carbon and provides the majority of free electrons.
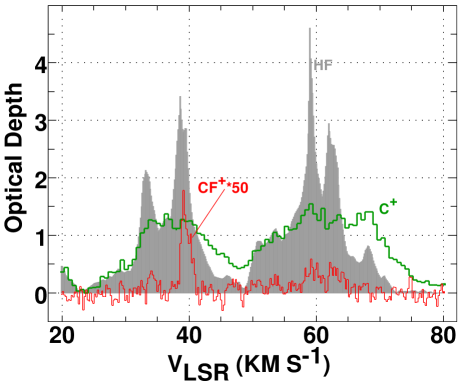
The species involved in the CF+ formation chemistry are observable and Fig. 4 shows the optical depth profiles (equivalently the profiles of column density or column density per unit velocity) of C+, HF and CF+. Because it is so widespread and so heavily blended, and to some extent because it was observed with some three times lower velocity resolution, the C+ profile varies little across the peaks in HF and CF+. The optical depth of CF+ varies more strongly than that HF or the product (C+)*(HF).
To model the CF+ chemistry we adopted a very slightly simplified version of the fluorine chemistry of Neufeld & Wolfire (2009) using the new HF formation rate of Tizniti et al. (2014) and fixed gas-phase elemental abundances [C]/[H] = (Sofia et al., 2004), [F]/[H] = (Snow et al., 2007). We held fixed the empirically determined molecular abundances X(CH) = , X(OH) = (Weselak et al., 2010) and X(O) = (Sonnentrucker et al., 2015) and embedded this chemistry in models of the heating and cooling of uniform density gas spheres, such as were recently used to calculate abundances of , HD and CO, etc. (Liszt, 2007, 2015): these use standard values of the radiation field and photodissocation rates, etc. We adopted a constant gas-phase abundance of fluorine as in (Sonnentrucker et al., 2015) and did not include a progressive freeze-out of gas-phase fluorine, which apparently occurs only at higher values of the hydrogen column density than are encountered in this work, see Fig. 5 and the discussion below.
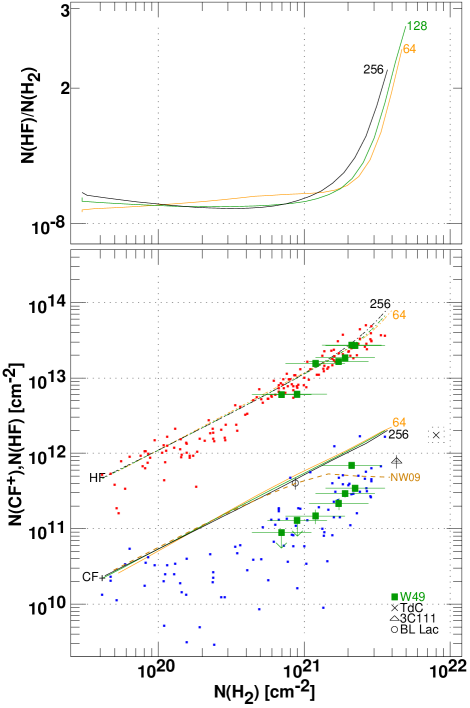
Model results for HF and CF+ are shown in Fig. 5 for three densities n(H) = 64, 128 and 256 : the proportions of atomic and molecular hydrogen are calculated inside the models self-consistently. The results plotted are integrated over the central line of sight toward models with varying N(H) following the H- transition across 128 equi-spaced radial shells. X(HF) , independent of n(H) for N() or AV mag. At higher N() carbon recombines to neutral carbon and CO and the photodissociation rate of HF decreases, allowing X(HF) to increase to the point where HF consumes all of the free gas-phase fluorine (see also the models of Sonnentrucker et al. (2015)). X(CF+) remains nearly constant as the decrease in C+ is compensated by falling electron density. The HF/CF+ ratio increases, which we have traced in the models to falling temperature and faster CF+ recombination.
Shown for comparison is the earlier prediction for N(CF+) of Neufeld & Wolfire (2009), which includes progressive freeze-out of the gas-phase fluorine. Agreement of the two predictions for CF+ is surprisingly good considering the differences in the underlying HF chemistry. The HF column densities in Neufeld & Wolfire (2009) are about 50% higher than here at N() .
4.3 Model and observed results for HF
Shown in Fig. 5 are HF and CF+ column densities over the velocity intervals tabulated in Table 2 and 4, and the clouds of channel by channel optical depths scaled to fit in the plot area. As noted in Sect. 2, N() is approximated as N() = N(CH)/, here shown with an assigned error in N() of a factor 1.6 corresponding to the scatter in the empirical CH- correlation of Sheffer et al. (2008). Also shown in Fig. 5 are our measurements of CF+, along with prior measurements in the Horsehead PDR (Guzmán et al., 2012a) and in absorption toward BL Lac and 3C111 (Liszt et al., 2014). The quasar absorption datapoints were placed horizontally by assuming a relative abundance N()/N() (see Liszt et al. (2010) and Table 4).
The results for HF are well explained by the models, and have a nearly constant abundance relative to at N() , X(HF) = in agreement with the results of Indriolo et al. (2013) and Sonnentrucker et al. (2015). As sampled in HF, whose abundance with respect to remains steady up to the highest inferred values of N(), freeze-out of the fluorine and/or collapse of the carbon ionization to CO and neutral carbon must occur at values of N() beyond those encountered along the line of sight to W49N. The absorption line of HF becomes heavily saturated at higher column densities, see Sonnentrucker et al. (2010)
4.4 Model and observed results for CF+
The predicted value over the range of N() observed toward W49 is X(CF+) X(HF)/20. This can be understood simply by comparing the rate of CF+ formation from C++ HF CF+ + H and the rate of CF+ recombination in a gas at 75 K (the mean temperature of (Rachford et al., 2002)) in which C+provides 7/8 of the ambient electrons as determined from detailed examination of the internal structure of the models.
The ratios N(CF+)/N() observed in absorption toward W49N (Table 4) are for the gas around 39 km s-1 and for the other four velocity intervals in which CF+ was detected. The smaller of the observed relative abundances is about a factor four below the model prediction while that at 39 km s-1 is about 40% too small. The line of sight toward BL Lac was already cited as an outlier in the discussion of Fig. 3. The CF+ abundance along the line of sight through the translucent gas toward 3C111 is consistent with the smaller of the CF+ abundances toward W49N.
Agreement of the model and observed results for HF implies that the ratio of HF formation and destruction rates is correct under the assumption of equilibrium of the chemical rate equations. Given that the formation rate using the recently measured reaction rates of Tizniti et al. (2014) should be secure and the H- transition is modelled in detail, it follows that the destruction rate of HF should also be correct. Therefore the formation rate of CF+ is also correct to the extent that formation of CF+ dominates the destruction of HF. This implies that small CF+ abundances arise from the absence of some important CF+ destruction mechanism in the models, and perhaps that this mechanism is suppressed in the 39 km s-1 gas toward W49N and toward BL Lac.
4.5 A role for CF+ photodissociation?
We considered that this could point to a role for photodissociation, which was not incorporated in the underlying chemical model given the rapidity with which CF+ recombines. Guzmán et al. (2012a) noted that even a relatively large free-space photodissociation rate was too slow to affect the abundances seen in the Horsehead nebula and they neglected it in their calculation of the CF+ column density.
To clarify this matter we examined our models to see what were the actual rates of photodissociation of CF+. The ranges of recombination rates in the models averaged along the line of sight were and with the higher values at the smallest N() and vice versa. Thus a free space photodissociation rate would have a very noticeable effect on X(CF+), introducing number and column density dependences beyond the very small ones in the models shown here. This is a relatively high rate, but not higher than that for CH (Van Dishoeck & Black, 1986) which is quoted in the UFDA database (McElroy et al., 2013) as However, we subsequently learned that the free-space photodissociation rate of CF+ has recently been calculated to be s-1 (Dayou and Roueff, in preparation), effectively eliminating photodissociation as a practical solution to the discrepancy between the calculated and observed CF+/HF ratio.
In closing we note that some uncertainties remain regarding the underlying chemistry. The adopted CF+ recombination rate was measured in a gas of rotationally-warm CF+, and may need refinement. Moreover, the assumed formation rate for CF+ by reaction of C+ with HF has not yet been measured in the laboratory; here, we simply adopted the capture rate computed by NW09, assuming - in effect - that every capture results in a reaction. In reality, the CF+ formation could be significantly smaller than what we have assumed, providing an alternative explanation for the lower-than-predicted CF+ abundances reported here.
5 Summary
CF+, formed in the reaction C+ + HF CF+ + H, was originally detected in the Orion Bar and subsequently detected in the Horsehead PDR and then in diffuse/translucent molecular clouds occulting BL Lac and 3C111 and in a massive protostellar envelope. In this work we detected the 102.6 GHz J=1-0 lines of CF+ (Table 1) in absorption from gas lying in the galactic plane toward W49N , a giant HII region at a distance of 11.1 kpc from the Sun at o, o. As detailed in Appendix A the CF+ profile was extracted in the presence of an overlying H66 recombination line. As shown in Fig. 1 and 2 and summarized in Tables 2 and 4, narrow absorption was seen in features at 33 and 40 km s-1 corresponding to well-known discrete diffuse/translucent molecular gas clouds lying in the Galactic plane. But absorption from more diffuse material was also observed at intermediate velocities and in the terminal-velocity ridge at v km s-1 caused by velocity crowding of unrelated gas parcels as the line of sight velocity gradient approaches zero at the sub-central point (see Appendix B and Fig. B.1). This establishes CF+ as a fairly commonly-distributed species in diffuse and translucent molecular gas.
In Fig. 2 (see Table 2) we broadly compared the velocity distribution of CF+ with those of several hydrocarbons and tracing the total column density, with HNC that appears strongly only when the number and column densities are higher locally, and with HCO, an interface species that is known not to penetrate dense gas. The hydrocarbons and have higher integrated opacity on the high-velocity side of the profiles where column density aggregates as the result of velocity-crowding in portions of the line of sight at the smallest galactocentric radii. HNC behaves oppositely, peaking in the 40 km s-1 feature which is the strongest individual cloud feature seen along the line of sight. In this regard, CF+ most closely resembles HNC.
In Fig. 3 we compared the column densities of CF+, , C2H and HNC more quantitatively along all the sightlines where CF+ has been observed in absorption. The 33 km s-1 cloud toward W49N has molecular column densities most nearly similar to the sightline toward BL Lac at AV = 1 mag, but only 40% as much CF+. The 39 km s-1 feature toward W49N is similar to the higher-column density translucent sightline toward 3C111 (AV mag), including CF+. N(CF+) shows a quadratic dependence on N(C2H) and most closely resembles HNC in its detailed behaviour.
As shown in Table 4 the relative abundance X(CF+) = N(CF+)/N() observed in absorption toward W49N are for the gas around 39 km s-1 and for the other four velocity intervals in which CF+ was detected. To interpret these results we embedded the fluorine chemistry in a model of the heating, cooling and and CO formation in diffuse and translucent gas using a recent remeasurement of the F HF + H formation reaction. Using CH as a surrogate for with X(CH) = the models correctly reproduce the observed column density and relative abundance of HF with X(HF) = N(HF)/N() . However, they also predict N(CF+)/N() and N(CF+)/N(HF) which is too large by factors of four for CF+ seen over most of the velocity range seen toward W49, or by 40% for the feature around 39 km s-1.
Given the correctness of the predictions for HF, we hypothesized that the discrepancy in the predicted CF+ abundance and CF+/HF ratio in the models results from the absence of a significant CF+ destruction process. This process is presumably suppressed when the CF+ relative abundance is unusually high. We surmised that photodissociation of CF+ is important and we showed, by examination of the recombination rates in the models, that a photodissociation rate s-1(comparable to that of CH) could cause a substantial decrease in the CF+ abundance, introducing number and column density dependences that otherwise are largely absent. However, the free space photodissocation rate has recently been calculated and found to be s-1, far too small to explain the observed discrepancies. In any case, uncertainties remain in the adopted CF+ formation and recombination rates, which may need revision.
In Fig. 4 we compared the optical depth profiles of C+ and HF, the species that form CF+, with that of CF+ itself. The profile of (C+) varies little across the peaks in (HF) and (CF+), owing to blending of atomic and molecular gas and somewhat poorer velocity resolution, with, perhaps, a decreased C+ fraction in the high-column density cloud. If C+ is the dominant form of gas-phase carbon it dominates both the formation and destruction of CF+, leaving CF+ to trace N(HF) and N(). In this experiment along the complex and heavily-blended low-latitude line of sight to W49N, CF+ signaled the coexistence of C+ and HF, but primarily traced the peaks of the distribution.
| Vel. range | C3 | HNC | red CF+ | HCO | H13CO+ | CH | |
|---|---|---|---|---|---|---|---|
| km s-1 | km s-1 | km s-1 | km s-1 | km s-1 | km s-1 | km s-1 | km s-1 |
| 23.9..31.3 | 0.520(0.040) | — | 0.000(0.017) | 0.0000(0.0027) | 0.0000(0.0121) | — | 0.035(0.019) |
| 31.6..35.7 | 1.380(0.040) | 1.950(0.018) | 0.270(0.018) | 0.0110(0.0024) | 0.0540(0.0096) | 0.0000(0.0112) | 1.144(0.014) |
| 35.7..42.0 | 3.140(0.070) | 6.210(0.074) | 1.970(0.036) | 0.0514(0.0029) | 0.1322(0.0115) | 0.1240(0.0140) | 2.040(0.019) |
| 42.1..50.0 | 0.660(0.040) | 0.840(0.016) | 0.000(0.023) | 0.0000(0.0032) | 0.0325(0.0126) | 0.0000(0.0154) | 0.861(0.017) |
| 50.0..56.8 | 1.570(0.045) | 3.980(0.025) | 0.400(0.022) | 0.0161(0.0030) | 0.0867(0.0118) | 0.0000(0.0144) | 1.660(0.017) |
| 56.8..61.5 | 2.780(0.054) | 7.270(0.070) | 1.200(0.023) | 0.0255(0.0026) | 0.2410(0.0102) | 0.1234(0.0123) | 2.150(0.018) |
| 61.5..66.1 | 2.370(0.053) | 4.490(0.036) | 0.880(0.021) | 0.0218(0.0025) | 0.1410(0.0097) | 0.0649(0.0118) | 1.830(0.017) |
| 66.1..70.3 | 0.628(0.330) | 0.810(0.013) | 0.110(0.017) | 0.0000(0.0024) | 0.0275(0.0095) | 0.0000(0.0113) | 0.670(0.013) |
a Quantities in parenthesis are statistical error estimates, see Sect. 2
| C3 | HNC | CF+ | HCO | H13CO+ | C2H | HF | C+ | CH | ||
|---|---|---|---|---|---|---|---|---|---|---|
| frequencya | 85.339 | 89.189 | 90.664 | 102.588 | 86.671 | 86.754 | 87.317 | 1232.476 | 1900.537 | 532.774 |
| factorb | 4.36E12 | 1.12E12 | 1.76E12 | 1.35E13 | 2.26E13 | 1.13E12 | 6.52E13 | 2.404E12 | 1.40E17 | 3.64E13 |
a GHz
b units for all entries are (km s-1)-1
| Vel. range | C3 | HNC | CF+ | HCO | C2H | HF | |
| km s-1 | |||||||
| 31.6..35.7 | 1.48E-09 | 1.84E-09 | 3.99E-10 | 1.25E-10 | 5.08E-11 | 3.99E-08 | 1.30E-08 |
| 35.7..42.1 | 1.66E-09 | 3.28E-09 | 1.63E-09 | 3.26E-10 | 6.98E-11 | 4.56E-08 | 1.29E-08 |
| 42.0..50.0 | 1.03E-09 | 1.05E-09 | 1.36E-10 | 1.44E-10 | 4.07E-11 | 2.89E-08 | 6.77E-09 |
| 50.0..56.8 | 1.23E-09 | 2.58E-09 | 4.08E-10 | 1.26E-10 | 5.62E-11 | 2.97E-08 | 9.57E-09 |
| 56.8..61.5 | 1.45E-09 | 3.64E-09 | 9.45E-10 | 1.54E-10 | 1.21E-10 | 3.60E-08 | 1.20E-08 |
| 61.5..66.1 | 1.43E-09 | 2.64E-09 | 8.14E-10 | 1.54E-10 | 8.30E-11 | 3.17E-08 | 9.68E-09 |
| 66.1..70.3 | 1.25E-09 | 1.30E-09 | 2.78E-10 | 1.39E-10 | 4.42E-11 | 2.66E-08 | 8.59E-09 |
| Sumb | 1.41E-09 | 2.66E-09 | 7.89E-10 | 1.57E-10 | 7.43E-11 | 3.54E-08 | 1.08E-08 |
| Meanc | 1.36E-09(0.21) | 2.33E-09(0.98) | 7.46E-10(5.05) | 1.77E-10(0.85) | 6.65E-11(2.82) | 3.41E-08(0.68) | 1.04E-08(0.24) |
a Quantities tabulated are N(X)/N() where N() = N(CH)/
b Entries labelled Sum are ratios of the total column density over all intervals to the total CH
c Entries labelled Mean are the average(rms) of the detections in the body of the table.
Appendix A Extraction of the CF+ line profile
As noted in Sect. 2.1, We extracted the CF+ profile in the presence of an overlying H66 recombination line. We have confidence in the identification of this extraneous feature by comparison with maps we made of the more isolated H53 line, whose 38 km s-1 linewidth is the same as that of the gaussian profile fitted to extract the CF+ profile.
Shown in Fig A.1 is the observed continuum-subtracted profile, as derived from a linear fit to the spectral baseline well outside the velocity interval shown. A gaussian profile with FWHM 38.2 km s-1was fit to the spectrum using spectral channels within velocity intervals chosen to coincide with regions of weak HF absorption, in order to avoid removing any broad underlying component of CF+ absorption. The fitted gaussian is shown in red and the velocity intervals used for fitting are outlined as blue dashed rectangles. The sum of the gaussian and linear fits was then used to derive the final continuum-subtracted profile from the original data. The continuum flux at the observed position was 3.47 Jy and the rms line/continuum noise at zero-absorption in the final continuum-subtracted spectrum was .
We tested the reliability of the fit by adding to the data varying amounts of absorption mimicking the optical depth spectrum of HF (Gerin et al., 2012), to which CF+ is closely related, and then observing whether the added absorption was present in the derived CF+ profile after gaussian decomposition. This was the case as long as the velocity intervals used in the profile decomposition were those in which HF absorption toward W49N is weak. We are confident that no broad component of CF+ absorption was removed by the profile decomposition, although such a feature may be well be present below the levels of detectability of the experiment.
Appendix B Line of sight kinematics
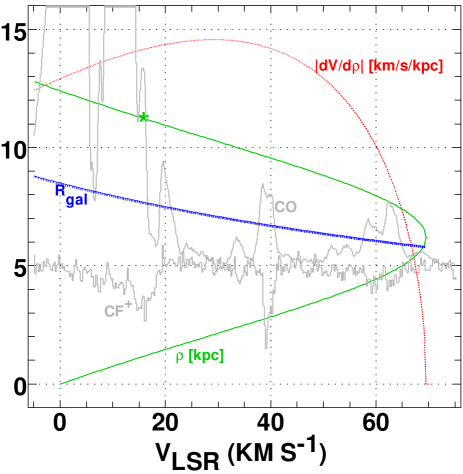
The line of sight kinematics toward W49 are illustrated in very compact form in Fig. B.1 for a flat rotation curve, as noted in the figure caption. W49N is at the far kinematic distance only slightly inside the Solar Circle so the same path is sampled in both emission and absorption. The maximum velocities of features observed in emission and absorption correspond well to that expected from the model velocity field. The so-called terminal velocity feature at km s-1 occurs as material over a wide range of line of sight distance collects in a narrowed velocity range owing to the smaller line of sight velocity gradient. The velocity range up to +20 km s-1 includes the nearest 1.5 kpc along the line of sight and constrains the absorption to arise inward of 7.5 kpc in galactocentric distance..
Acknowledgements.
The National Radio Astronomy Observatory is a facility of the National Science Foundation operated under cooperative agreement by Associated Universities, Inc. IRAM is operated by CNRS (France), MPG (Germany) and IGN (Spain). This work was supported by the CNRS program “Physique et Chimie du Milieu Interstellaire” (PCMI). PG acknowledges funding by the European Research Council (Starting Grant 3DICE, grant agreement 336474, PI: V. Wakelam). We thank Fabrice Dayou and Evelyne Roueff for communicating the result of their calculation of the CF+ photdissociation rate prior to publication.References
- Burgh et al. (2010) Burgh, E. B., France, K., & Jenkins, E. B. 2010, Astroph. J., 708, 334
- Burton (1971) Burton, W. B. 1971, A&A, 10, 76
- Fechtenbaum et al. (2015) Fechtenbaum, S., Bontemps, S., Schneider, N., Csengeri, T., Duarte-Cabral, A., Herpin, F., & Lefloch, B. 2015, A&A, 574, L4
- Gerin et al. (2010) Gerin, M., de Luca, M., Goicoechea, J. R., Herbst, E., Falgarone, E., Godard, B., Bell, T. A., Coutens, A., Kaźmierczak, M., Sonnentrucker, P., Black, J. H., Neufeld, D. A., Phillips, T. G., Pearson, J., Rimmer, P. B., Hassel, G., Lis, D. C., Vastel, C., Boulanger, F., Cernicharo, J., Dartois, E., Encrenaz, P., Giesen, T., Goldsmith, P. F., Gupta, H., Gry, C., Hennebelle, P., Hily-Blant, P., Joblin, C., Kołos, R., Krełowski, J., Martín-Pintado, J., Monje, R., Mookerjea, B., Perault, M., Persson, C., Plume, R., Salez, M., Schmidt, M., Stutzki, J., Teyssier, D., Yu, S., Contursi, A., Menten, K., Geballe, T. R., Schlemmer, S., Morris, P., Hatch, W. A., Imram, M., Ward, J. S., Caux, E., Güsten, R., Klein, T., Roelfsema, P., Dieleman, P., Schieder, R., Honingh, N., & Zmuidzinas, J. 2010, A&A, 521, L16
- Gerin et al. (2011) Gerin, M., Kaźmierczak, M., Jastrzebska, M., Falgarone, E., Hily-Blant, P., Godard, B., & de Luca, M. 2011, A&A, 525, A116
- Gerin et al. (2012) Gerin, M., Levrier, F., Falgarone, E., Godard, B., Hennebelle, P., Le Petit, F., De Luca, M., Neufeld, D., Sonnentrucker, P., Goldsmith, P., Flagey, N., Lis, D. C., Persson, C. M., Black, J. H., Goicoechea, J. R., & Menten, K. M. 2012, Royal Society of London Philosophical Transactions Series A, 370, 5174
- Gerin et al. (2015) Gerin, M., Ruaud, M., Goicoechea, J. R., Gusdorf, A., Godard, B., de Luca, M., Falgarone, E., Goldsmith, P., Lis, D. C., Menten, K. M., Neufeld, D., Phillips, T. G., & Liszt, H. 2015, A&A, 573, A30
- Godard et al. (2010) Godard, B., Falgarone, E., Gerin, M., Hily-Blant, P., & de Luca, M. 2010, A&A, 520, A20
- Guzmán et al. (2012a) Guzmán, V., Pety, J., Gratier, P., Goicoechea, J. R., Gerin, M., Roueff, E., & Teyssier, D. 2012a, A&A, 543, L1
- Guzmán et al. (2012b) Guzmán, V., Roueff, E., Gauss, J., Pety, J., Gratier, P., Goicoechea, J. R., Gerin, M., & Teyssier, D. 2012b, A&A, 548, A94
- Helfer & Blitz (1997) Helfer, T. T. & Blitz, L. 1997, Astroph. J., 478, 233
- Indriolo et al. (2013) Indriolo, N., Neufeld, D. A., Seifahrt, A., & Richter, M. J. 2013, Astroph. J., 764, 188
- Liszt & Lucas (2001) Liszt, H. & Lucas, R. 2001, A&A, 370, 576
- Liszt (1995) Liszt, H. S. 1995, Astroph. J., 442, 163
- Liszt (2007) —. 2007, A&A, 476, 291
- Liszt (2015) —. 2015, Astroph. J., 799, 66
- Liszt et al. (1993) Liszt, H. S., Braun, R., & Greisen, E. W. 1993, Astron. J., 106, 2349
- Liszt et al. (2014) Liszt, H. S., Pety, J., Gerin, M., & Lucas, R. 2014, A&A, 564, A64
- Liszt et al. (2010) Liszt, H. S., Pety, J., & Lucas, R. 2010, A&A, 518, A45+
- Lucas & Liszt (1996) Lucas, R. & Liszt, H. S. 1996, A&A, 307, 237
- Lucas & Liszt (2000) —. 2000, A&A, 358, 1069
- McElroy et al. (2013) McElroy, D., Walsh, C., Markwick, A. J., Cordiner, M. A., Smith, K., & Millar, T. J. 2013, A&A, 550, A36
- Neufeld et al. (2006) Neufeld, D. A., Schilke, P., Menten, K. M., Wolfire, M. G., Black, J. H., Schuller, F., Müller, H. S. P., Thorwirth, S., Güsten, R., & Philipp, S. 2006, Astrophysics, 454, L37
- Neufeld & Wolfire (2009) Neufeld, D. A. & Wolfire, M. G. 2009, ApJ, 706, 1594
- Pety (2005) Pety, J. 2005, in SF2A-2005: Semaine de l’Astrophysique Francaise, ed. F. Casoli, T. Contini, J. M. Hameury, & L. Pagani, 721
- Rachford et al. (2002) Rachford, B. L., Snow, T. P., Tumlinson, J., Shull, J. M., Blair, W. P., Ferlet, R., Friedman, S. D., Gry, C., Jenkins, E. B., Morton, D. C., Savage, B. D., Sonnentrucker, P., Vidal-Madjar, A., Welty, D. E., & York, D. G. 2002, Astroph. J., 577, 221
- Sheffer et al. (2008) Sheffer, Y., Rogers, M., Federman, S. R., Abel, N. P., Gredel, R., Lambert, D. L., & Shaw, G. 2008, Astroph. J., 687, 1075
- Snow et al. (2007) Snow, T. P., Destree, J. D., & Jensen, A. G. 2007, Astroph. J., 655, 285
- Sofia et al. (2004) Sofia, U. J., Lauroesch, J. T., Meyer, D. M., & Cartledge, S. I. B. 2004, Astroph. J., 605, 272
- Sonnentrucker et al. (2010) Sonnentrucker, P., Neufeld, D. A., Phillips, T. G., Gerin, M., Lis, D. C., de Luca, M., Goicoechea, J. R., Black, J. H., Bell, T. A., Boulanger, F., Cernicharo, J., Coutens, A., Dartois, E., Kaźmierczak, M., Encrenaz, P., Falgarone, E., Geballe, T. R., Giesen, T., Godard, B., Goldsmith, P. F., Gry, C., Gupta, H., Hennebelle, P., Herbst, E., Hily-Blant, P., Joblin, C., Kołos, R., Krełowski, J., Martín-Pintado, J., Menten, K. M., Monje, R., Mookerjea, B., Pearson, J., Perault, M., Persson, C. M., Plume, R., Salez, M., Schlemmer, S., Schmidt, M., Stutzki, J., Teyssier, D., Vastel, C., Yu, S., Caux, E., Güsten, R., Hatch, W. A., Klein, T., Mehdi, I., Morris, P., & Ward, J. S. 2010, A&A, 521, L12
- Sonnentrucker et al. (2015) Sonnentrucker, P., Wolfire, M., Neufeld, D. A., Flagey, F., Gerin, M., Goldsmith, P., Lis, D., & Monje, R. 2015, Astroph. J., 799, submitted
- Tizniti et al. (2014) Tizniti, M., Le Picard, S. D., Lique, F., Berteloite, C., Canosa, A., Alexander, M. H., & Sims, I. R. 2014, Nat. Chem., 6, 141
- Van Dishoeck & Black (1986) Van Dishoeck, E. F. & Black, J. H. 1986, Astrophys. J., Suppl. Ser., 62, 109
- Weselak et al. (2010) Weselak, T., Galazutdinov, G. A., Beletsky, Y., & Krełowski, J. 2010, Mon. Not. R. Astron. Soc., 402, 1991
- Zhang et al. (2013) Zhang, B., Reid, M. J., Menten, K. M., Zheng, X. W., Brunthaler, A., Dame, T. M., & Xu, Y. 2013, Astroph. J., 775, 79