A First Look at Galaxy Flyby Interactions. II. Do Flybys matter?
Abstract
In the second paper of this series, we present results from cosmological simulations on the demographics of flyby interactions to gauge their potential impact on galaxy evolution. In a previous paper, we demonstrated that flybys – an interaction where two independent halos inter-penetrate but detach at a later time and do not merge – occur much more frequently than previously believed. In particular, we found that the frequency of flybys increases at low redshift and is comparable to or even greater than the frequency of mergers for halos . In this paper, we classify flybys according to their orbits and the level of perturbation exacted on both the halos involved. We find that the majority of flybys penetrate deeper than of the primary and have an initial relative speed of the primary. The typical flyby mass-ratio is at high for all halos, while at low , massive primary halos undergo flybys with small secondary halos. We estimate the perturbation from the flyby on both the primary and the secondary and find that a typical flyby is mostly non-perturbative for the primary halo. However, since a massive primary experiences so many flybys at any given time, they are nearly continually a victim of a perturbative event. In particular, we find flybys that cause change in the binding energy of a primary halo occurs Gyr-1 for halos for . Secondary halos, on the other hand, are highly perturbed by the typical encounter, experiencing a change in binding energy of nearly order unity. Our results imply that flybys can drive a significant part of galaxy transformation at moderate to lower redshifts (). We touch on implications for observational surveys, mass-to-light ratios, and galaxy assembly bias.
Subject headings:
cosmology: theory — cosmology: dark matter — cosmology: large-scale structure of universe — galaxies: evolution — galaxies: halos — galaxies: interactions — methods: numerical1. INTRODUCTION
Galaxy mergers drive galaxy evolution; they are a key mechanism by which galaxies grow and transform. The merger process is usually accompanied by a strong gas inflow (BH91; MH94) triggering a central starburst and perhaps an active galactic nucleus (hereafter, AGN). Consequently, galaxy mergers have been studied quite extensively both numerically (e.g., DMH99; RBCD06; CJ08; HCH08; SH09; SH10) and observationally (e.g., S86; L03; VD05; LD08; TGSN08). Galaxy mergers are so successful in driving galaxy evolution simply because they strongly perturb the potential. Of course, weaker perturbations can cause change, too; it has long been thought that even an orbiting low mass satellite like the Large Magellanic Cloud can distort the underlying smooth galaxy potential enough to warp the Milky Way (MW) disk (WB06). However, one entire class of galaxy interactions capable of causing such perturbations – flybys – has been largely ignored.
Unlike galaxy mergers where two galaxies combine into one remnant, flybys occur when two independent galaxy halos inter-penetrate but detach at a later time; this can generate a rapid and large perturbation in each galaxy. We define a flyby as a fast interaction between two independent galaxies each within their own separate dark matter halos. Although some aspects of a galaxy flyby may be similar to the first wide pass of a galaxy merger, or to galaxy harassment in a cluster, the rapid and transient nature of a flyby places it in a dynamical class of its own.
One of the first questions to ask is how common are galaxy flybys?. Curiously, though, this is a difficult question to answer simply because previous theoretical work has been set up to search for mergers; indeed both the extended Press-Schechter framework hierarchically assembles a dark matter halo, and the merger trees gleaned from cosmological Nbody simulations are designed to track halo growth in the same way – solely through mergers and smooth accretion.
Previous numerical works have shown the existence of flybys, or ‘backsplash’ galaxies, in galaxy clusters (e.g., GKG05; MSSS04) and isolated galaxies (WKP08; KLKMYGH11). Simulations predict that up to of the galaxies found between could be ‘backsplash’ galaxies (GKG05; P11; BMBF12). Naturally, these galaxies are distinct from those that are infalling for the first time. Backsplash galaxies are subject to ‘pre-processing’ and usually exhibit HI deficiency compared to infalling satellites. Candidate backsplash galaxies have been identified in galaxy clusters (MSSS04; MMR11; P11), as well as the field galaxies in the Local Group (TJK12). Another theoretical approach at finding flybys focused on identifying subhalo orbits that extend far outside the primary virial radius (LNSJFH09; WJ09; BLW12). LNSJFH09 looked at a suite of five isolated Milky-Way sized dark matter halos in a cosmological simulation and found that roughly half of the subhalos that were once associated with the host are now located outside the virial radius. Broadly speaking, flyby halos constitute 50% of all halos on scales of .
Recently, we developed and tested a method to identify both mergers and flybys between dark matter halos in cosmological simulations (SH12). We constructed a full ‘halo interaction network’ that assesses the past dynamical history of any given halo. With this new tool111available publicly at https://bitbucket.org/manodeep/hinge, we made the first census of flybys, and we found that they are surprisingly common. In fact at , flybys occur more often than mergers for all halos .
We reiterate that majority of flybys are one-time events, not merely the first orbit of a merger – here, the disks (if present) will not physically overlap at any point; they are also fundamentally different than galaxy harassment. More cosmological simulations are underway to build up a better statistical sample and to expand the dynamic range in halo mass, but the emerging picture is that current studies focusing on solely merging galaxies may completely miss this common type of galaxy interaction.
Now that we have evidence that flybys are rampant, we need to know if neglecting these flybys matters. While dark matter halo flybys do not significantly affect the halo mass function, these fast, transient events may make their mark on galaxy structure and kinematics. Over the years, flybys have been invoked in a heuristic way to explain various morphological features and transformations, such as the evolution from spiral to S0 galaxies in group environments (BC11), or the excitation of spiral arms in the galactic disk (e.g., TF06). Recently, flybys have been proposed as a way to provide the extra starbursts needed to explain the steep abundance gradient found in massive ellipticals (CM11), because it is widely-held that these galaxies are too -enhanced to be explained by mergers or galaxy harassment alone (NLOB05; TMBM05). From the purview of linear perturbation theory, a flyby imparts an impulse to the galaxy (VW00), and in principle this can exact a morphological and kinematic change in both the ‘victim’ and the ‘perturber’ halo. In fact, high resolution isolated simulations have borne this out, showing that flybys can induce a strong and long-lived bar (LHS14), can spin up the dark matter halo (LHS14), and can generate an S-shaped warp as well (KPKAY14).
In this paper, we aim to quantify the flyby perturbation and the frequency of disruptive flybys as a function of halo mass and redshift. In Section 2 we briefly describe the simulation details and the interaction network (see SH12 for further details), in Section 3 we show the results and Sections 4 and 5 we discuss the implications of our results and future steps. In addition, we outline the details of the analytic approximation used to estimate the perturbation on the halo in Appendix A.
2. METHODS
We use a high-resolution dark-matter simulation with particles in a 50 box with , consistent with WMAP-5 cosmology (K08), where the symbols have their usual meaning. The initial particle distribution is obtained from a Zel’dovich linear approximation at a starting redshift of and is evolved using the adaptive tree-code, GADGET-2 (SYW01; S05). The dark matter particles have a fixed gravitational softening length of co-moving at all epochs. We store 105 snapshots spaced logarithmically in scale-factor, , from to . This translates into a timing resolution Myr for and Myr for ; in SH12, we showed that a high snapshot cadence was essential in fully detecting the flybys in the volume. Since the fundamental mode goes non-linear at , we only present results up to where the 50 box is still a representative cosmological volume.
To identify halos, we use a canonical linking length ( 10 ) to find the Friend-of-Friends (FOF) halos (DEFW85); subhalos, with a minimum of 20 particles (), are identified using the SUBFIND algorithm (SWTK01). The SUBFIND algorithm identifies subhalos as bound structures around a density maxima; the background FOF obtained at the end is comprised of particles that are bound in the general potential of the FOF, but not bound to any subhalo. For the remainder of this paper, all references to the FOF halo will mean this bound background halo. For details on the SUBFIND algorithm, we refer the reader to SWTK01. We used an overdensity, to compute the virial radius of halos:
| (1) |
Here, we used the bound mass of the halo reported by SUBFIND as . Another commonly used overdensity is, (BN98), where . For cosmology at , . For comparison, the virial radii obtained at by using would be roughly times larger than our adopted definition. At higher redshifts, , and there is virtually no difference between our adopted and .
2.1. Characterizing flyby orbits
Our next step is to identify all interactions between halos of any type in the simulation. This done with our halo interaction network algorithm described in SH12. For every flyby we record the initial separation, , a minimum separation (impact parameter), , between the halo centers during the encounter and the initial relative velocity between the halo centers, , at the beginning of the encounter. These three quantities, along with the two halo masses and the initial redshift are sufficient to crudely specify the interaction. In other words, idealized galaxy flyby simulations can be run with these 6 parameters specified. We use physical values for all the quantities to facilitate such idealized setups. We track the orbit of the secondary halo during the flyby and mark the minimum separation between the primary and secondary centers as . We also note the primary half-mass radius (determined from the particle distribution) at the time of this minimum separation. However, since is the minimum separation found during snapshot outputs, it is really an upper limit on the true minimum separation between the two halos. To better estimate the true impact parameter, we numerically integrated the orbit of two analytic dark matter halos with the same initial total mass, separation, and velocity as our target halos. To simplify, we assumed the halo concentrations were given by (BK01). As we integrate the orbital trajectory, we include the effect of tidal stripping to the Roche lobe, as well as Chandrasekhar dynamical friction with a Coulomb logarithm that goes as log. In practice, the mean impact parameter from the simulations was only 10% times larger than from integrating the orbit, but there was a non-negligible fraction of impact parameters that were larger by order unity – these encounters were typically highly radial and the likelihood of the simulation snapshot catching it at its true pericenter is small. We will use the determined from this extrapolated trajectory for the rest of the paper.
2.2. Perturbations from Flybys
As a first estimate of the potential damage done by flybys, we follow the prescription set out by VW00. Their work is based on linear perturbation theory to determine the change in total and potential energy for spherical systems. The perturbation equations have different forms depending on whether the halo experiences an internal or external encounter (see Appendix A). The generic flyby consists of a smaller secondary halo falling into a more massive primary halo and then detaching at some later time. In the reference frame of the primary, it is a victim of an internal flyby; for the secondary halo, however, the center of the primary halo always remains outside so it operates as an external flyby. Therefore, we use the external and internal flyby perturbation from VW00 to calculate the perturbations on the secondary and primary halo respectively. We combined the internal and external flyby perturbations fits into one equation:
| (2) |
where we replaced with , and we used . This provides a continuous fit for in Eqn. A while preserving the energy changes from the two equations. Essentially, we used an exponential cut-off from the internal flyby perturbation calculation and extended the prescription to . Since this is somewhat of an ad-hoc implementation, the exact perturbation will not be accurate; however, in this paper we are only concerned with relative estimates and these equations should be sufficient for our purposes. In contrast, LHS14 performed high-resolution simulations of galaxy flybys and directly measured the perturbed modes and their magnitudes; they found that the 0.1 mass ratio secondary during a deep flyby could excite a perturbation in the mode as high as 20% (with larger perturbation amplitudes for lower-order modes), resulting in a distinct and long-lived bar.
3. Results
In SH12, we showed that flybys occur frequently for massive halos () for . Here, we show that flybys are potentially an important player in galaxy evolution.
First, we compare the frequency of flybys vs mergers from a more observational perspective. Table LABEL:table:flyby_fractions lists the fraction of flybys and mergers for various host halos at a range of redshifts and relative velocities. It is striking that for , the potential flyby contamination in a galaxy-pair survey is as much as , and at minimum, the contamination is roughly 1/3. It appears that galaxy surveys designed to probe the effects of mergers on star formation, AGN activity, or morphology could be picking up a significant fraction of flybys as well, particularly for Milky Way-mass halos. In this case, flybys do ‘matter’ because they are an abundant contaminant.
| redshift range | Primary | nFlybys | nMergers | Flyby fraction | |
|---|---|---|---|---|---|
| [–] | [km/s] | [km/s] | [–] | [–] | [%] |
| 85–190 | 170–380 | 1789 | 1082 | 62 | |
| 255–570 | 200 | 66 | 75 | ||
| 340–760 | 32 | 5 | 86 | ||
| 190–645 | 380–1290 | 911 | 1256 | 42 | |
| 570–1935 | 29 | 60 | 33 | ||
| 100–220 | 200–440 | 692 | 1022 | 40 | |
| 300–660 | 37 | 68 | 35 | ||
| 220–750 | 440–1500 | 176 | 567 | 24 | |
| 660–2250 | 9 | 72 | 11 | ||
| 115–250 | 230–500 | 155 | 541 | 22 | |
| 345–750 | 3 | 19 | 14 | ||
| 250–845 | 500–1690 | 7 | 112 | 6 | |
| 750–2535 | 0 | 15 | 0 |
3.1. Two classes of flybys
A flyby will be perturbative when the halos penetrate deeply before detaching; in addition, if the flyby is relatively slow, then the secondary halo particles spend more time near the resonances – thereby perturbing the primary even more. Thus, highly perturbative flybys would have to be highly penetrating and relatively slow. In the next sections, we will dissect the orbital characteristics of the flybys in the simulation and examine their relative importance over a range of halo masses and redshift.
First, we identify the infall characteristics of flybys. For a flyby to occur, the secondary halo has to overcome the primary halo’s gravitational potential; therefore, the initial relative velocity must be high compared to the primary halo escape velocity. A priori, therefore, we expect that flybys will have an higher initial relative velocity compared to mergers. Nominally, an unbound interaction should have ; however, mass-loss and dynamical friction effectively increase this minimum infall velocity. Previous work looking at the distribution of subhalo infall velocities has found that typical and only a few percent of the orbits are truly unbound (e.g. B05; LNSJFH09) In Fig. 1 we plot the histogram of the relative velocity scaled by the primary for both mergers and flybys. We note that flybys and mergers are indistinguishable in a plot for the ratio of to . Since we classify flybys based on past/future behavior depending on the velocities of the halos, there is no distinction between mergers and ‘grazing’ flybys in real space. As expected, the infall velocity of mergers peaks at a lower (bound) velocity, compared to the peak flyby infall velocity of . We find that roughly 1% and 10% of the flybys occur with and times the primary respectively. For secondary halos, about 50% of the flybys occur at relative velocities , while only 30% of the mergers occur at .
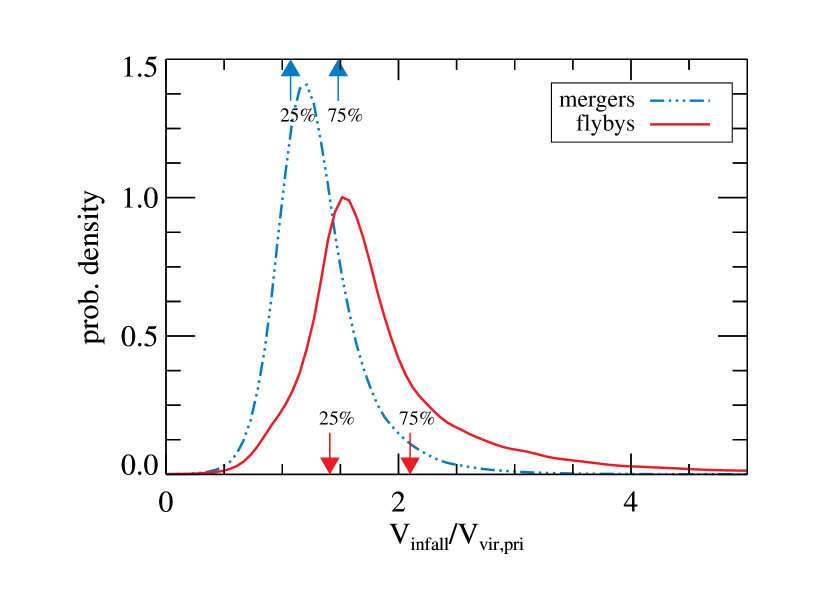
Fig. 1 demonstrates that flybys have a higher infall velocity compared to mergers but the initial separation between centers for both mergers and flybys is approximately the sum of the virial radii of the two halos. So, the only way to observationally distinguish between a flyby and a merger would be through the 3-d relative velocity, which makes it problematic to disentangle mergers from flybys in a survey.
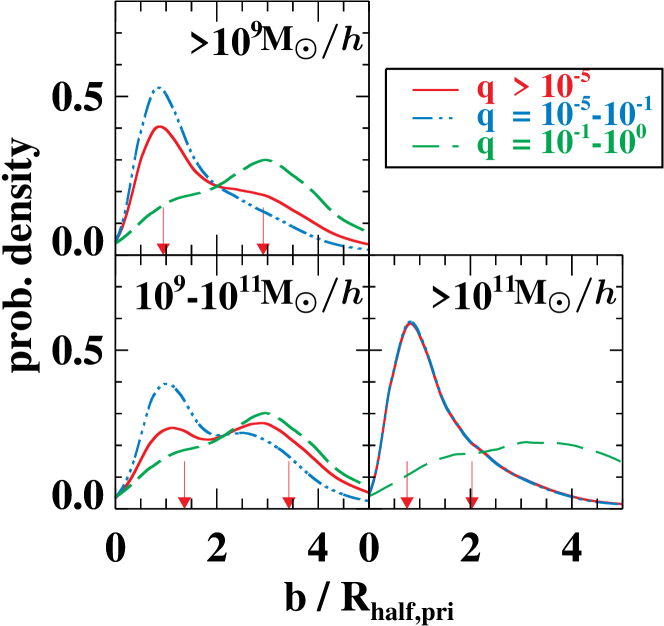
We can also characterize the distribution of the flyby impact parameter. In Fig. 2, we show the probability density of , scaled by primary at the time of minimum separation, for three primary halo mass ranges and three mass-ratio cuts. We calculate the probability density with an adaptive kernel density estimator (S98) with a Epanechnikov kernel. Combining the impact parameter results with the flyby velocity distribution above, it is clear that there are two classes of flybys: one that rapidly delves into the primary core, and one that slowly skirts the outer primary halo. For massive halos, the most common flyby is a deep one, with few skirting encounters. In general, major flybys are of the slow and shallow type, while minor flybys penetrate deeper into the primary halo potential.
3.2. How long do typical flybys last?
We have so far looked at the distribution of and for flybys. Now, another important orbital characteristic of flybys will be the typical duration. We remind the reader that a flyby is characterized by a ‘main halosubhalomain halo’ transition, and dynamically this means that the secondary halo must fall in to the primary halo and climb out of the potential well. This implies that the typical flyby duration is . In fact, in SH12, we used a minimum duration of half a crossing time to distinguish ‘true’ flybys from artificial halo stitching due to the FOF algorithm. We choose the crossing time at the beginning of the flyby, , to express the flyby durations. By selection, all flybys must last at least . We note that is independent of halo mass and evolves as with .
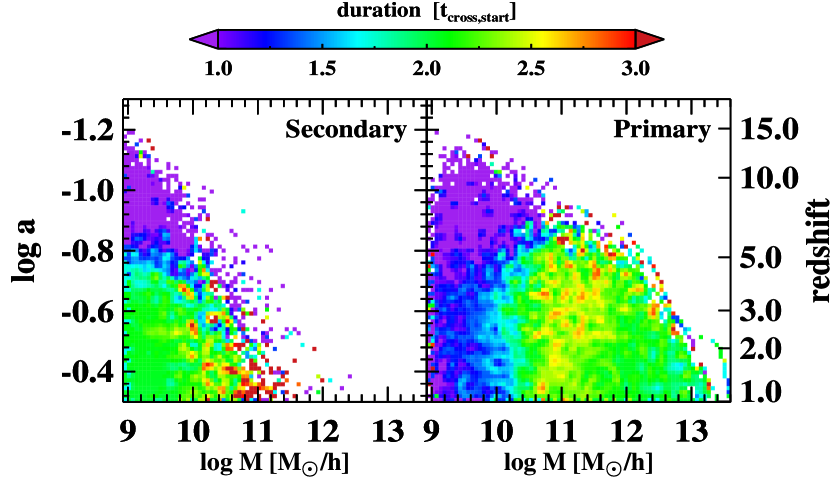
In Fig. 3 we show the median flyby duration as a function of halo mass and redshift for both the primary and secondary halos. The duration is scaled by – where is evaluated at the beginning of the flyby. From the figure, we can see that the median duration of a flyby is typically larger than two . There is an redshift trend for the duration as well – high flybys are shorter compared to the low ones. For , both primary and secondary halos typically undergo flybys that last 2–3 . However, since we can only detect the beginning and end of flybys at a snapshot (which goes as log), we caution that the true flyby duration may be shorter.
3.3. Distribution of mass ratios
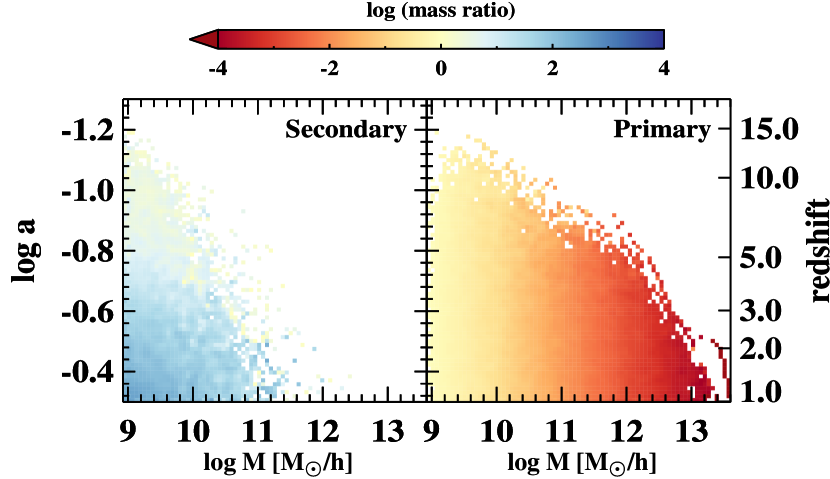
In any cosmological simulation, the halo number density is highest for the lowest resolvable halo. Consequently, the frequency of interactions increase with decreasing mass ratio, roughly as . In Fig. 4, we show the distribution of median flyby mass ratios for primary and secondary halos. For primary halos, the trend is roughly independent of redshift, in other words, the mass ratio smoothly decreases with increasing halo mass. The lowest mass primary halos have flybys that are approximately equal-mass, while the typical flyby for the most massive primary halos is a . 222 The secondary halos are less massive than the primary halos by construction – therefore the mass ratio for the secondary halos are always greater than 1.
Note that interpreting this figure is not straightforward because it also encodes the halo mass function. For example, for the massive secondary halos, e.g, at , the only feasible primary halos are also of similar mass. Hence, the mass ratio for such flybys is close to 1. For a low-mass secondary halo, the typical interaction is – the converse of its high-mass primary halo counterpart.
Here we see that flybys very rarely occur among massive, equal-mass halos. While one reason is that any major interaction is always less likely compared to a minor one, we do still see major mergers in the simulation. So, naturally the question arises – why are there fewer major flybys? The answer comes from the velocity function of dark matter subhalos. In cosmology, the velocity of infalling satellites drops of steeply, as , with (HW06). In addition, the efficiency of dynamical friction and tidal stripping ensures that massive subhalos get stripped, lose significant amount of energy and angular momentum, and have a more difficult time making it out of the primary halo. This effect was pointed out by LNSJFH09, who noticed the mass-bias in unorthodox orbits – where smaller subhalos can preferentially lie as far as from the primary host halo. The initial velocity distribution and the preferential energy loss for massive halos combine to make major flybys comparatively rare.
3.4. Mass loss from flybys
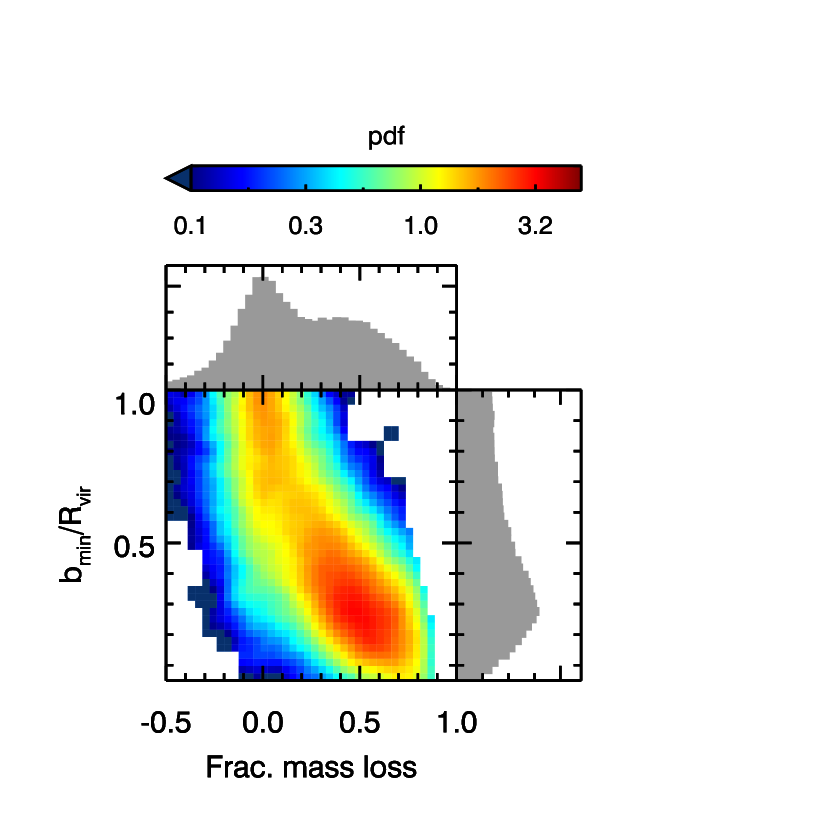
Now that we have discussed the demographics of flyby encounters, we can turn our attention to the effect that flybys exact on the participating halos. This can address the question of whether flybys matter in transforming the halo structure and kinematics. One key effect is that the interaction can cause significant mass loss in the intruder halo. This is quantified in Fig. 5, which plots the fractional mass loss of the secondary halo as a function of the normalized impact parameter. This draws out two essential points: first, deep encounters strip the secondary halo mass by of order 50%, and second, the grazing encounters may sometimes gain mass as they travel along the equipotential contour of the primary halo. From this result, we can already answer our original question of do flybys matter? with a definitive yes, because they dramatically alter the mass (and therefore the mass-to-light ratio) of the intruder halo.
3.5. Flyby-driven perturbations
Taking the concept of flyby-driven halo transformation a step further, we quantify the frequency of perturbative flybys. Broadly speaking, the perturbation from a flyby depends on the mass ratio, the impact parameter and the relative velocity. The usual intuitive understanding of interactions apply – more massive secondaries cause more damage, as do smaller impact parameters and lower relative velocities.
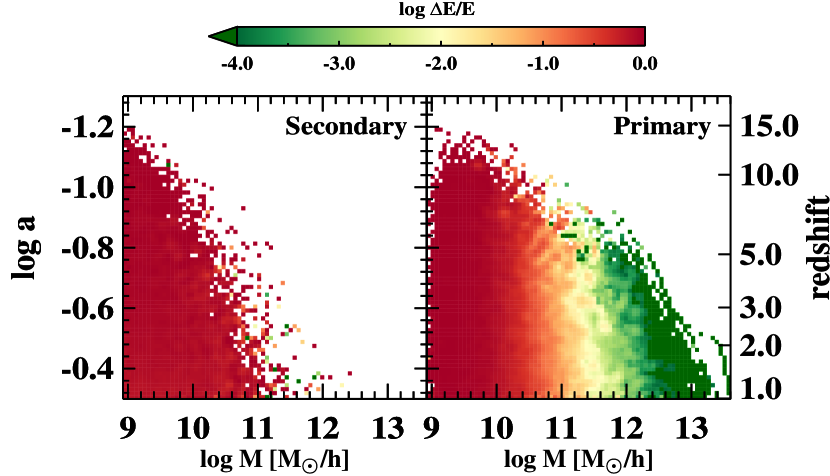
With all the essential pieces now in hand, we will look at the perturbations from flybys – these perturbations are estimated using Eqn. 2. Looking at the functional form of Eqn. 2, the most important bit is the impact parameter, which determines if is characterized as an internal or external flyby. In Fig. 6, we show the mean perturbation in 2-d cells of halo mass and redshift. For the secondary halos (left panel), we see that the mean during a flyby is of order unity and should strongly affect the internal structure of the secondary halo333 of order unity implies the assumed linear regime for deriving Eqn. 2 is no longer valid. However, for the primary halos (right panel), the mean from a flyby is essentially negligeble. Thus, for massive primary halos, a typical flyby is not going to change the overall structure at all.
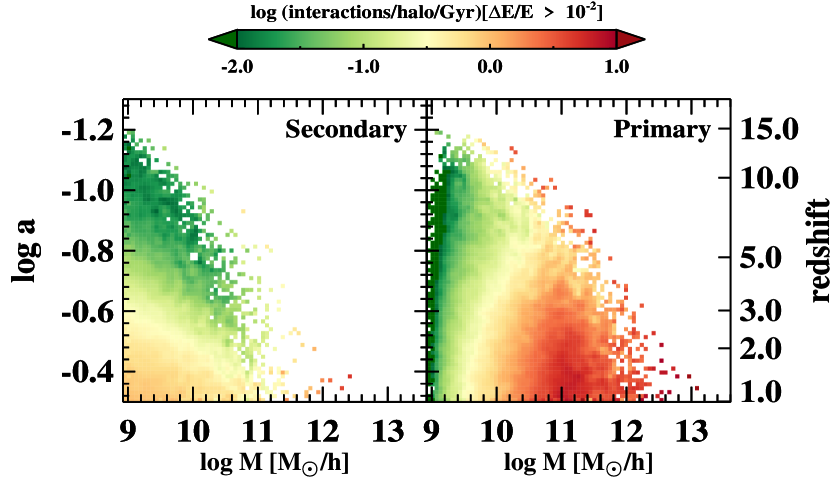
However, since the big question we want to know is if flybys matter, we need to know if any, and not just the typical flyby strongly affects a halo/galaxy. In Fig. 7, we show the event rate of perturbative flybys, defined as , as a function of halo mass and redshift. On the left panel, we show the event rate for ‘big’ flybys for secondary halos. The average event rate for secondaries increases with decreasing redshift; with typical rates per Gyr at , and per Gyr for . The event rate resembles the distribution of durations (see Fig. 3, and shows almost no trend with halo mass. The similarity with the duration is likely from the fact that deeper flybys take longer to complete, and these deeper flybys produce larger perturbations. For the primary halos, there is a strong trend with halo mass – with the event rate increasing by almost an order of magnitude between and halos. All halos above have at least a few ‘big’ flybys every Gyr. Thus, both primary and secondary halos have perturbative flybys frequently enough that the halo internal structure will be modified (LHS14; KPKAY14).
In Fig. 6, we saw that the typical flyby was highly perturbative for all secondary halos but in Fig. 7, we see that the typical secondary halo only experiences highly perturbative flyby per Gyr. Similarly, in Fig. 6, we saw that the typical flybys don’t significantly perturb the primary, whereas in Fig. 7, we see that primary halos undergo a large number (few to 10’s) of highly perturbative flybys per Gyr. This apparent discrepancy between Fig. 6 and Fig. 7, can be explained in terms of the hierarchical nature of halo interactions, and the perturbation calculation (Eqn. 2) itself. Secondaries don’t always have flybys, but when they do, it is a highly perturbative one. Averaged over the entire population of secondary halos, the event rate of highly perturbative flybys is small. On the other hand, massive primary halos undergo a lot of flybys; however, most of these are with small secondaries and the term in Eqn. 2 reduces the typical drastically. Thus, the typical interaction strength for the primary halo is actually very small. But, in this large number of tiny flybys, there are a few interactions where the secondary gets close to the center of the primary halo. These flybys, with small impact parameters, produce really large and drive the high event rate for massive primaries.
4. Discussion
Flybys and mergers have similar separation distributions, differing only by the relative velocities between the halos. One obvious implication of this similarity in separation is that it is very difficult to distinguish flybys from mergers in a photometric survey, and even adding radial velocities will only help in a statistical sense. We should expect that merger rates derived from pair counts will be contaminated with flybys. However, since flybys typically occur with low mass-ratios, this contamination affects minor merger rates much more than major merger rates.
One consistent picture that emerges from flybys is that the secondary halos typically lose of their infall mass, and are highly perturbed as well. Previous work has shown that this level of perturbation drives bars and warps, and spins up the halo. Another potential side-effect of a flyby could be the shut-off in smooth gas accretion and consequent quenching of star formation in the secondary as it delves into the primary halo.
In addition to these potential changes to internal galactic structure, flybys also have an effect on the overall galaxy distribution. Flyby-induced mass loss, while keeping the baryonic component of the secondary galaxy relatively intact, systematically decreases its mass-to-light ratio () at fixed luminosity. Observationally, these would imply a higher mass-to-light ratio () and redder colors for a fraction of galaxies that are near other more massive galaxies. Since flybys are hierarchical, i.e., more massive halos have more flybys (SH12), the effect of flybys would be more prominent in galaxy groups and clusters. Such an excess in the red-fraction has been reported (WYMBK09), and more recently WTCB13 showed that that the excess in red-fraction could be explained by assuming flyby galaxies evolved like satellites even outside the host.
Another effect of tidal stripping during a flyby shows up as halo assembly bias. Halo assembly bias means that the clustering of halos depends on a hidden parameter beyond the halo mass. Over the past decade, halo assembly bias has been consistently detected in simulations (e.g., WZBKA06; GW07; WMJ07; LP11) and some have invoked ‘ejected’ subhalos as an explanation. However, a far more important consequence of flybys would be galaxy assembly bias – where galaxy properties depend not just on the host halo mass but another secondary characteristic, such as environment. If flybys systematically reduce halo masses, a galaxy-mapping prescription based only on halo mass would erroneously place a lower mass, bluer galaxy within. Or, worse still, the halo may not even receive a galaxy. Comparing this mock galaxy catalog with observations, the mock would show a dearth of red galaxies around massive systems, as well as a suppression of galaxy clustering. As emphasized recently (ZHB13), galaxy assembly bias can cause Halo Occupation Distribution (HOD) models to converge on a statistically different parameter space. Galaxy assembly bias from flybys would require an overhaul of the models that place galaxies into halos and statistically model galaxy formation physics, such as the HOD (BW02). Similar concerns apply for the Conditional Luminosity Function (CLF) (e.g., YMB03), as well.
5. Conclusions
In this paper, we characterized halo flybys by their infall velocity, impact parameter, duration, mass-ratio distribution, as well as the mass loss and perturbation due to the flyby on both halos. This will be useful for any future numerical or semi-analytic project that wishes to examine the effect of flybys using realistic distributions. We summarize our main results below:
-
1.
Flybys occur with higher velocities compared to mergers. The mean infall velocity for flybys and mergers are and the virial velocity of the primary halo. respectively. See Fig. 1 for the probability density of the infall velocities.
-
2.
Flybys typically penetrate to about the half mass radius of the primary halo, but can go as deep as 0.01 . However, the impact parameter is strongly dependent on the mass ratio; more minor flybys usually have smaller impact parameter. See Fig. 2 for the probability density of flyby impact parameters.
-
3.
There are two classes of flybys: slow interactions that skirt the outer halo, and fast flybys that delve into the core.
-
4.
Flybys typically last roughly for . There is a slight mass dependence – less massive primary halos under-go shorter-lived flybys. At high , most flybys are quite short in units of crossing time. See Fig. 3 for the distribution of flyby durations.
-
5.
Flybys and mergers have a similar dependence on mass-ratio, . Major flybys are very rare (even more so than major mergers); the largest we found was in our small volume. However, at high , flybys occur between similar mass halos. At lower , massive primary halos undergo flybys with small halos, with a typical . See Fig. 4.
-
6.
Deep encounters strip about 50% of the secondary halo mass, while grazing encounters exhibit negligible mass loss (and may even cause a gain in secondary mass). See Fig. 5.
-
7.
We find that flybys are usually highly perturbative for secondary halos (of order unity perturbation) but are typically extremely weak for the primary halos (, see Fig. 6). Since the mass-ratio for a typical flyby, is , the perturbation, , is tiny. However, since massive primary halos undergo a large number of flybys, some of these flybys are highly perturbative. In Fig. 7, we show that highly perturbative flybys occur at per Gyr for all halos for .444So, contrary to standard lore, the answer to the question in the paper-title is not always ‘no’
Appendix A Calculating the perturbations from flybys
Flybys are high-speed encounters between halos – therefore, one could assume that the impulse approximation is valid. Flybys will impart an impulse on the secondary halos, resulting in an initial increase in the kinetic energy of the secondary. If the secondary was in equilibrium prior to the flyby, this impulse will throw it out of equilibrium and cause it to expand. Under the impulse approximation, the change in energy of the secondary (S58; AW85) is:
| (A1) |
For an extended perturber, the right hand side of Eqn. A1 is modified with an additional factor (GLO99a), , where changes from 1 for to 0 for . In that modified form, the largest occurs for . The ‘grazing’ flybys that we study approximately have and should thus have the strongest perturbations. However, both the impulse and tidal approximation disregard resonant effects in the secondary. To get a more accurate estimate of the overall change in the potential due to a flyby, we use the empirical results in Table 3 from VW00. Briefly, the change in energy of a perturbed system is given by:
| (A2) |
where, , and refer to the relative separation and velocity of the centers of the two halos, is the total mass of a halo, is the universal gravitational constant, is the virial radius of a halo, is the total potential energy of the halo and the subscripts 1 & 2 refer to the primary (more massive) and the secondary halo respectively. For a given pair of halos, is larger for the secondary halo. For penetrating encounters, we calculated the perturbation, , of the primary using the fit including the effects of damped modes in Table 2 of VW00:
| (A3) | |||
Here, , is the impact parameter scaled in terms of the half-mass radius of the primary, and is the relative velocity in units of . However, the internal and external fits are not continuous functions with impact parameter. We modified the fits to allow for a smooth transition between the internal fit (for ) and the external fit (for ):
| (A4) |
where, we have replaced with . We used . This provides a continuous fit for in Eqn. A while (roughly) preserving the parameter values from the discrete fit.