Three candidate clusters around high redshift radio-loud sources: MG1 J04426+0202, 3C 068.2, MS 1426.9+1052
Abstract
We present near-infrared observations of the environments around three radio-loud sources (MG1 J0442+0202, 3C 068.2, and MS 1426.9+1052) at redshifts , and (respectively), that are surrounded by near-infrared galaxy overdensities. Overdensities with respect to field counts were found to be significant up to 19, with twelve times the expected number of galaxies within the inner regions of the densest proto-cluster. Color-magnitude relations are constructed in , , with each candidate cluster exhibiting a feature consistent with the beginnings of a red sequence. Galaxy models based on the redshift of the radio source are used to compare expected color-magnitude relations for a given formation epoch with the observed red sequence of each candidate, and are found to be consistent with an old () formation epoch for a few bright, red galaxies on the red sequence.
Subject headings:
galaxies: clusters: general - galaxies: clusters: individual(CL J0442+0202, 3C 068.2, MS 1426.9+1052)1. Introduction
The largest overdensities in the early universe are observed today as galaxy clusters. These initial density perturbations can be used as probes over a range of epochs for the cosmological parameters that characterize our universe (Cen & Ostriker, 1994; Vikhlinin et al., 2009). Cluster observables (number density, mass) as a function of redshift provide constraints for and . The mass and formation timescale of high redshift clusters compared with simulations of large-scale structure is a powerful test of CDM (Mortonson et al., 2011). Recent discoveries are challenging the boundaries at how rapidly large structures can form ( from Gobat et al. 2013; from Lee et al. 2014a; from Venemans et al. 2002), and how massive they can become (e.g. ‘El Gordo’ at in Menanteau et al., 2012). Identification of the epoch of cluster formation is an important test of cosmology and the dark energy equation of state.
Previously these high redshift structures were identified via galaxy overdensities in near-infrared (NIR) photometric surveys (Stern et al., 2003; Papovich, 2008; Eisenhardt et al., 2008; Papovich et al., 2010). Clusters are also associated around radio-loud sources (Hall et al., 2001) out to redshifts (Venemans et al., 2002). Utilizing the intra-cluster medium (ICM) as an identifier, diffuse X-ray emission has been useful in increasing the number of known high redshift clusters (Gobat et al., 2011; Willis et al., 2013), while the Sunyaev-Zel’Dovich (SZ) effect is becoming increasingly powerful with the success of the South Pole Telescope (Keisler et al. 2011), Atacama Cosmology Telescope (Sievers et al. 2013), the Planck satellite (Planck Collaboration et al., 2013a) , and with the Combined Array for Research in Millimeter-wave Astronomy (CARMA111http://www.mmarray.org; Muchovej et al. 2007; Culverhouse et al. 2010; Mantz et al. 2014).
We present three cluster candidates at , two of which have not been identified previously. High-redshift radio-loud sources were targeted for NIR photometry to search for a galaxy overdensity in the surrounding region, which has proven to be a robust identifier of structure (Stern et al., 2003; Haas et al., 2009; Galametz et al., 2010). Section 2 describes the NIR observations and photometry, while the overdensity associated with each cluster candidate is discussed in Section 3. The photometry of each candidate cluster is presented in Section 4 and analyzed in Section 5, with a summary presented in Section 6.
The work presented here assumes a CDM concordance cosmology, with , a matter density of , and km s-1 Mpc-1.
2. Observations
| Date | Field | Instrument | Bands | Typical Seeing |
|---|---|---|---|---|
| 7-9 January 2006 | CL J0442+0202 | SQIID | 0.5”-0.8” | |
| 7-9 January 2006 | 3C 068.2 | SQIID | 0.5”-0.8” | |
| 7-9 April 2007 | MS 1426.9+1052 | SQIID | 1.1” | |
| 12-13 October 2008 | 3C 068.2 | NEWFIRM | 1.1”-1.3” |
Note. — Observations Summary for the three selected candidate clusters.
Three candidate clusters were observed with Kitt Peak National Observatory’s Mayall 4-m telescope equipped with the SQIID Camera in the NIR and passbands between January 2006 to April 2007. A summary of observations can be found in Table 1. Each passband is projected onto a pixel InSb detector (covering in RA/DEC). Individual frames were co-added and corrected for cosmic rays with IRAF222IRAF is distributed by the National Optical Astronomy Observatories, which are operated by the Association of Universities for Research in Astronomy, Inc., under cooperative agreement with the National Science Foundation. (Tody, 1986, 1993) IMCOMBINE routine.
The candidate cluster around 3C 068.2 was also imaged with the NEWFIRM camera on the 4-m in October 2008. NEWFIRM is a wide-field camera that spans , and images were taken in and filters. The cluster fell entirely within one quadrant of the NEWFIRM camera, so we devised the “four-shooter” observational mode in which the telescope is shifted from quadrant to quadrant to maximize time on target while simultaneously observing sky. These frames were processed by the NEWFIRM Quick-Reduce Pipeline. The galaxy photometry between the NEWFIRM and SQIID images were within the photometric errors, increasing our confidence in the calibration and detection procedures.
Sky subtraction was accomplished by chopping on and off field while dithering between frames. The resulting sky flats displayed variations of only 0.02% based on sky box determination of the frame sky value. Hysteresis from a bright star in the frames for cluster MS 1426.9+1052 produced some large scale features (visible under high contrast, see Figure 5). However, these variations are less than 0.04% the background and do not effect the galaxy photometry routines which used local sky. Both and frames were used for galaxy identification and each object was confirmed visually in both frames before inclusion in our analysis.
Calibration of the stacked images utilized the 2MASS Point Source Catalog (PSC) for stars within the individual frames in the and filters. With the wide field of view (FOV) of NEWFIRM, a large sample of stellar sources were used for calibration (474 matches for and 577 stars for ), providing photometric solutions with intrinsic scatter of mag and mag. A photometric solution for the SQIID instrument was found in a similar way, but the smaller FOV of each image provided fewer 2MASS calibration sources. CL J0442+0202 and 3C 068.2 were imaged on the same run in January 2006, while MS 1426.9+1052 was observed in April 2007. Unfortunately, no usable 2MASS stars were in the latter field, so the photometric solutions for MS 1426.9+1052 were derived using 2MASS stars within other science frames taken during the April 2007 run.
Source Extractor (; Bertin & Arnouts 1996) was used to create an initial list of sources from both and frames. Galaxies and stars were distinguished using the stellar index parameter. A few of the faintest objects were below the detection threshold in one filter (typically ), and were confirmed visually, in both filters. A few objects were visible in the frames, but rejected as they were below the threshold or not visible in the frame preventing a color determination. The final set of objects are marked in Figures 1, 3 and 5, all clearly visible under high contrast. Overdensity estimates are made using a conservative limiting magnitude in the frame, well below the detection threshold.
After the photometric solution was applied to the candidate cluster galaxies, a color-magnitude relation (CMR) was constructed using diameter apertures. The aperture size was determined by building a curve of growth for the samples and examining the source light profiles with IMEXAM. The diameter apertures were found to be a suitable balance of light collected versus noise levels.
3. Cluster-Candidate Galaxy Overdensities
| Field | Redshift | RA | DEC | Galaxies Measured | Overdensity | Peak Surface Density |
|---|---|---|---|---|---|---|
| CL J0442+0202 | 4:42:23.7 | +02:02:20 | 48 | 19.2 | 42.4 | |
| 3C 068.2 | 2:34:23.8 | +31:34:17 | 31 | 14.4 | 35.4 | |
| MS 1426.9+1052 | 14:29:24.1 | +10:39:15 | 33 | 12.5 | 32.4 |
Note. — Summary Table for the three selected candidate clusters. All radio-loud sources have significant galaxy overdensities surrounding them with respect to the NIR field counts provided by Hall & Green (1998). The Surface Density (in galaxies ) is measured within the same area as the overdensity for sources .
The most basic technique of identifying clusters is by finding overdensities of galaxies with respect to field counts. The lack of a large overdensity, conversely, does not imply that no cluster exists, as cluster richness and the system’s mass were not found to be strongly correlated (Planck Collaboration et al., 2013b), although other recent results have suggested the opposite (Rozo & Rykoff, 2014). Following the example of Hall & Green (1998) and Hall et al. (2001), counts of galaxies brighter than surrounding radio-loud quasars consistently show overdensities relative to field counts (). Listed in Table 2 is each radio source, its position and redshift, and number of galaxies identified within of the radio source.
For each cluster candidate, a peak overdensity was determined by counting galaxies with around the radio source, and comparing this to the expected field counts. The difference between the counted and expected (in units of counts ) are presented in Table 2 as the galaxy overdensity. The peak surface density for each candidate is computed as the number of galaxies divided by the same area as the peak overdensity, written in units of galaxies per square arcminute.
The lowest redshift source in this sample was found to have the largest overdensity of 19.2 above the mean value, followed by 3C 068.2 with a 14.4 overdensity. The greatest redshift candidate cluster (at ) around MS 1426.9+1052 had the smallest overdensity of 12.6. This can be attributed to the off-center position of MS 1426.9+1052 in the SQIID image (see Fig 5) effectively limiting the potential number of galaxies, coupled with the smaller amount of time the cluster candidate has had to dynamically assemble (2 Gyrs between ).
The expected number of field galaxies that reside within the region associated with each overdensity can be estimated utilizing the counts of Hall & Green (1998). Within the areas associated with the peak overdensities (e.g. ), the estimated number of galaxies un-associated with the cluster is , , and for CL J0442+0202, 3C 068.2, and MS 1426.9+1052, respectively. As each cluster candidate’s overdensity is contained within approximately the same area on the sky, they have approximately the same number of expected field galaxies.
It is important to note that galaxies which exist outside of the largest overdensity can still be associated with the cluster. For instance, out of the 6 spectroscopically confirmed members within CL J0442+0202, Galaxy 4 in Tab 3 is in an area outside an even modest overdensity (). Within the cluster discovered by Papovich et al. (2010) at , 8 of the 11 spectroscopically confirmed members would exist outside of a overdense region if these galaxies were inserted into our data. This suggests that at these redshifts, clusters are still in the process of assembly with galaxies infalling.
By computing the expected number of galaxies for a projected area in square arcseconds around the radio source, an overdensity factor can also be computed. The inner regions show a factor of 11.6, 6.9, and 6.1 times the expected number of galaxies near CL J0442+0202, 3C 068.2, and MS 1426.9+1052, respectively. These overdensities indicate that the three regions are candidates for clusters in the process of assembly.
4. Cluster Candidates
4.1. CL J0442+0202
| Galaxy | RA | DEC | r | ||
|---|---|---|---|---|---|
| (”) | (”) | (”) | (mag) | (mag) | |
| 1 | 0.000 | 0.000 | 0.000 | 17.06 0.19 | 1.73 0.21 |
| 2 | 27.571 | -37.814 | 46.798 | 18.11 0.20 | 1.52 0.22 |
| 3bbNon-members in the field (Stern et al., 2003). | 42.527 | -17.161 | 45.859 | 17.95 0.20 | 2.15 0.23 |
| 4aaSpectroscopically confirmed cluster members (Stern et al., 2003). | 28.336 | -15.598 | 32.345 | 18.67 0.20 | 1.73 0.24 |
| 5 | 4.610 | -13.686 | 14.441 | 20.70 0.49 | 0.79 0.58 |
| 6ccX-ray point sources found with Chandra that are not cluster members (Stern et al., 2003). | -9.483 | -11.521 | 14.922 | 18.12 0.20 | 1.30 0.22 |
| 7bbNon-members in the field (Stern et al., 2003). | -23.240 | -9.315 | 25.037 | 17.59 0.19 | 1.73 0.21 |
| 8 | 6.097 | -7.555 | 9.709 | 17.75 0.19 | 0.88 0.21 |
| 9 | 23.292 | -3.630 | 23.574 | 18.80 0.21 | 1.25 0.23 |
| 10 | -0.907 | 4.254 | 4.350 | 19.54 0.26 | 1.74 0.37 |
| 11aaSpectroscopically confirmed cluster members (Stern et al., 2003). | -7.788 | 5.418 | 9.487 | 18.11 0.20 | 1.63 0.22 |
| 12ccX-ray point sources found with Chandra that are not cluster members (Stern et al., 2003). | -2.979 | 11.825 | 12.194 | 19.17 0.22 | 0.86 0.25 |
| 13 | 13.204 | 14.311 | 19.472 | 18.50 0.20 | 1.63 0.23 |
| 14aaSpectroscopically confirmed cluster members (Stern et al., 2003). | 3.693 | 14.121 | 14.596 | 19.20 0.22 | 1.59 0.28 |
| 15 | -28.050 | 29.989 | 41.063 | 19.07 0.21 | 1.59 0.26 |
| 16 | -21.010 | -46.483 | 51.011 | 19.51 0.25 | 0.72 0.28 |
| 17 | 15.502 | 34.860 | 38.151 | 19.30 0.23 | 1.97 0.33 |
| 18bbNon-members in the field (Stern et al., 2003). | 17.970 | 40.284 | 44.111 | 18.38 0.20 | 1.62 0.23 |
| 19 | 33.668 | 28.809 | 44.311 | 19.74 0.26 | 1.93 0.40 |
| 20 | -12.425 | -8.076 | 14.819 | 19.53 0.23 | 1.95 0.38 |
| 21 | -8.792 | 0.011 | 8.792 | 20.16 0.41 | 1.39 0.58 |
| 22 | -31.158 | -2.055 | 31.226 | 20.04 0.30 | 0.73 0.34 |
| 23 | -33.491 | 1.069 | 33.508 | 19.62 0.25 | 1.17 0.30 |
| 24 | -11.603 | -34.214 | 36.128 | 19.25 0.22 | 1.86 0.31 |
| 25 | -32.993 | -37.985 | 50.313 | 18.05 0.20 | 0.72 0.21 |
| 26 | -15.997 | -49.336 | 51.865 | 19.34 0.23 | 1.38 0.28 |
| 27 | 66.671 | -35.440 | 75.505 | 18.99 0.21 | 1.08 0.24 |
| 28aaSpectroscopically confirmed cluster members (Stern et al., 2003). | 4.659 | 23.257 | 23.719 | 19.12 0.22 | 1.82 0.29 |
| 29 | -6.299 | 26.279 | 27.024 | 19.10 0.21 | 1.89 0.28 |
| 30 | 20.863 | 29.580 | 36.197 | 19.92 0.30 | 0.91 0.34 |
| 31 | 36.724 | 19.865 | 41.752 | 20.09 0.31 | 1.47 0.43 |
| 32 | 11.888 | -43.960 | 45.539 | 19.24 0.22 | 1.72 0.31 |
| 33 | 56.662 | 20.766 | 60.347 | 19.67 0.27 | 0.99 0.31 |
| 34 | 40.150 | 49.944 | 64.082 | 20.14 0.34 | 0.85 0.40 |
| 35 | 43.020 | 55.760 | 70.426 | 19.22 0.23 | 1.13 0.26 |
| 36 | 23.452 | 56.852 | 61.500 | 19.18 0.22 | 1.45 0.27 |
| 37 | 51.838 | 50.321 | 72.245 | 18.54 0.20 | 2.58 0.30 |
| 38 | 25.158 | -0.324 | 25.160 | 19.53 0.24 | 1.59 0.32 |
| 39ccX-ray point sources found with Chandra that are not cluster members (Stern et al., 2003). | 7.734 | 52.856 | 53.419 | 18.55 0.20 | 1.71 0.24 |
| 40 | 14.390 | 38.199 | 40.820 | 20.47 0.38 | 0.87 0.44 |
| 41 | 68.910 | 39.558 | 79.457 | 19.06 0.22 | 2.02 0.33 |
| 42 | 42.107 | 48.183 | 63.989 | 19.64 0.25 | 1.49 0.33 |
| 43 | 23.571 | 26.444 | 35.424 | 20.29 0.34 | 0.84 0.40 |
| 44 | 32.678 | 10.572 | 34.346 | 19.87 0.27 | 2.35 0.60 |
| 45 | -29.289 | 13.467 | 32.236 | 19.49 0.24 | 2.20 0.41 |
| 46 | -27.731 | -15.182 | 31.615 | 20.02 0.30 | 1.90 0.52 |
| 47 | 25.050 | -16.000 | 29.724 | 19.86 0.27 | 1.31 0.35 |
| 48aaSpectroscopically confirmed cluster members (Stern et al., 2003). | -2.0272 | -2.370 | 3.118 | 18.43 0.20 | 1.76 0.24 |
Note. — The central radio source MG1 J04426+0202 (Galaxy 1) and the sources around it within the SQIID field. Galaxy 1 is located at RA=4:42:23.7 DEC=+02:02:20 with separations (RA,DEC) computed with respect to it.
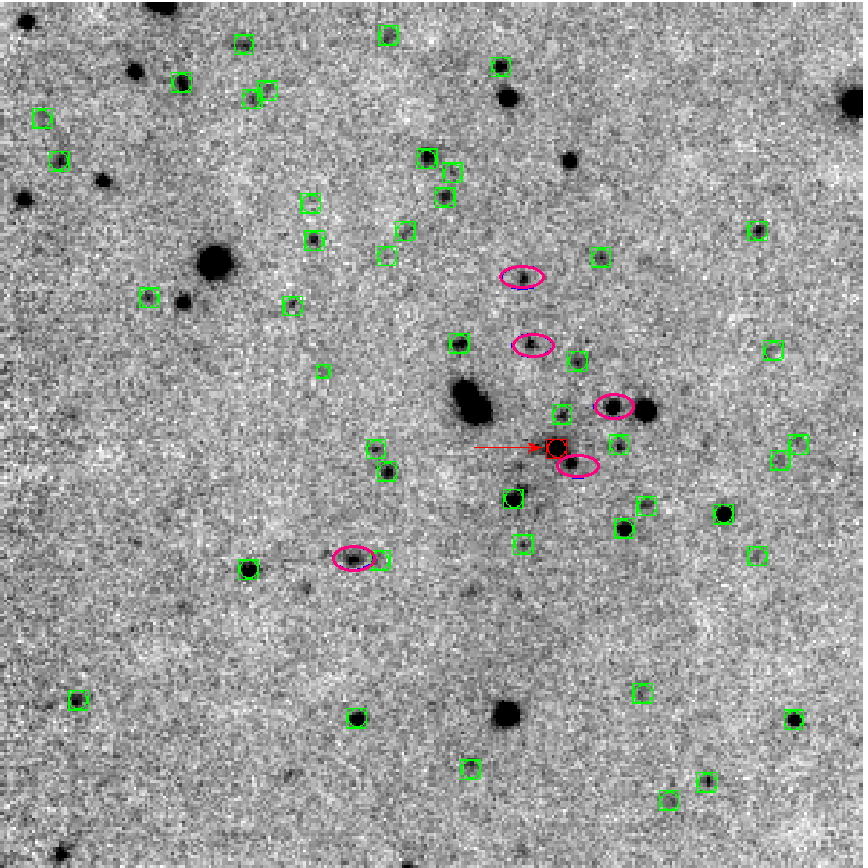
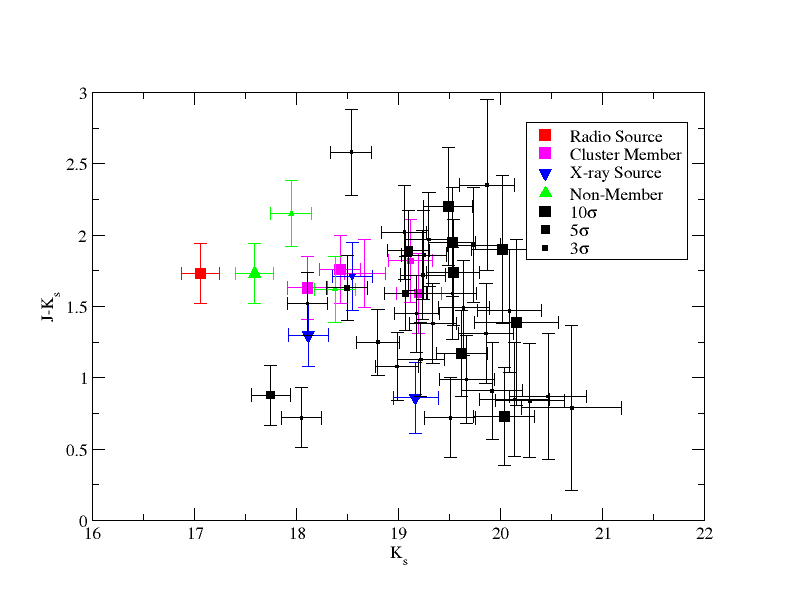
Stern et al. (2003) discovered a NIR galaxy overdensity surrounding the radio source MG1 J04426+0202 at a redshift of , and did follow-up observations spectroscopically and in the X-ray with Chandra . Five other galaxies were spectroscopically confirmed to be cluster members, and a number of X-ray point sources were resolved. However, Stern et al. (2003) were not able to detect diffuse X-ray emission from the ICM, only from the central radio source and other point sources. The NIR photometry of the cluster was measured in the -band and Lick to a limiting magnitude of .
We present SQIID photometry to a deeper limiting magnitude of . A comparison of 10 galaxies with magnitudes in the sample of Stern et al. (2003) with ours reveals a systematic offset of mag. This provides a basic check of the photometric solution for the SQIID camera, as well as a comparison to published work. The offset could be at least partially attributed to the blueward shift of the filter. The uncertainty in the offset approximately mirrors the uncertainty within our own photometry, while the uncertainty of the photometry from Stern et al. (2003) is unknown.
Within the field of view (shown in Fig 1), we present the photometry of 48 galaxies in Table 3 and the resulting color-magnitude relation in Fig 2. Spectroscopically confirmed members (Stern et al., 2003) are consistent with being on a red sequence, which may indicate the initial establishment of the prominent red sequences of early-type galaxies common in rich, low-redshift clusters (e.g. Coma; Eisenhardt et al. 2007). There is also a bright interloper () posing as a red sequence member. There are also foreground and background AGN (bright X-ray point sources found with Chandra ) that are entangled within the CMR. The overdensity remains significant, but the aforementioned interlopers urge caution in relying on purely photometric results.
4.2. 3C 068.2
| Galaxy | RA | DEC | r | ||
|---|---|---|---|---|---|
| (”) | (”) | (”) | (mag) | (mag) | |
| 1 | 0.000 | 0.000 | 0.000 | 18.330.17 | 1.600.24 |
| 2 | -13.247 | 39.826 | 41.971 | 18.610.19 | 1.190.24 |
| 3 | 4.572 | 34.854 | 35.153 | 17.940.15 | 1.930.21 |
| 4aaX-ray point source identified with Chandra (Wilkes et al., 2013). | -7.548 | 27.028 | 28.063 | 16.300.10 | 1.990.13 |
| 5aaX-ray point source identified with Chandra (Wilkes et al., 2013). | -12.031 | 21.261 | 24.429 | 17.550.13 | 2.090.19 |
| 6 | 31.568 | 20.292 | 37.528 | 19.260.25 | 0.920.32 |
| 7 | 53.111 | 5.645 | 53.410 | 18.840.21 | 0.940.26 |
| 8 | -14.288 | 0.963 | 14.321 | 18.680.19 | 0.780.23 |
| 9 | -46.977 | -6.956 | 47.489 | 18.340.17 | 0.980.21 |
| 10 | -12.658 | -13.683 | 18.640 | 18.840.21 | 1.040.26 |
| 11 | 12.944 | -43.318 | 45.211 | 19.280.25 | 1.420.35 |
| 12 | -1.630 | -20.314 | 20.379 | 19.420.27 | 1.890.43 |
| 13 | 16.984 | -29.481 | 34.023 | 20.170.40 | 0.590.47 |
| 14 | 12.224 | 4.321 | 12.966 | 19.980.38 | 4.062.14 |
| 15 | -0.121 | -8.203 | 8.204 | 19.410.29 | 2.940.80 |
| 16 | -6.447 | 1.032 | 6.529 | 19.670.32 | 2.280.61 |
| 17 | 20.055 | -23.083 | 30.578 | 19.670.32 | 2.640.69 |
| 18 | -22.220 | -25.015 | 33.459 | 20.020.38 | 3.301.25 |
| 19 | -30.541 | -30.224 | 42.968 | 19.760.31 | 0.520.37 |
| 20 | 28.521 | -41.641 | 50.472 | 19.990.37 | 1.620.55 |
| 21 | 35.474 | -39.058 | 52.763 | 20.890.64 | 2.101.21 |
| 22 | 52.244 | -32.845 | 61.710 | 19.990.36 | 0.990.46 |
| 23 | 19.391 | 4.007 | 19.801 | 19.910.35 | 1.500.50 |
| 24 | 14.409 | -18.372 | 23.348 | 19.230.26 | 1.630.36 |
| 25 | -13.351 | -20.148 | 24.170 | 19.380.27 | 1.960.43 |
| 26 | 28.742 | -4.167 | 29.043 | 19.280.26 | 3.670.90 |
| 27 | 22.496 | 24.888 | 33.549 | 19.280.26 | 2.360.47 |
| 28 | 0.204 | 22.287 | 22.288 | 18.950.22 | 2.480.41 |
| 29 | 25.898 | -2.416 | 26.010 | 19.370.27 | 2.150.45 |
| 30 | 19.655 | 23.165 | 30.380 | 19.580.30 | 2.240.53 |
| 31 | 26.082 | -34.725 | 43.430 | 18.740.20 | 1.930.31 |
Note. — Galaxy candidates within , which corresponds to at this redshift (Wright, 2006), around 3C 068.2 (Galaxy 1) located at RA=2:34:23.8, DEC=+31:34:17.
The photometry for the galaxies around 3C 068.2 are in Table 4. Within 1 arcminute of the central radio source (Galaxy 1 in the table), which corresponds to roughly Mpc in the assumed cosmology (Wright, 2006), 31 extended sources were identified. The selected sources are shown in Fig 3.
A , color-magnitude relation of the sources is in Fig 4, displaying a flat red sequence (RS) of . The two bright galaxies on the RS with likely contain AGN, as they were identified as X-ray point sources by Wilkes et al. (2013) with Chandra .
It is interesting to note that the central 3C source in this case is neither on the red sequence, nor is it the brightest cluster galaxy. Instead, it is found in the so-called blue cloud, inhabited primarily by star-forming galaxies. Barthel et al. (2012) surveyed a number of 3C sources with Herschel and integrated the far-infrared (FIR) dust emission to calculate a star formation rate (SFR) of each galaxy. 3C 068.2 has a calculated SFR of . This exceptionally high SFR cannot be sustained for a Hubble time without exceeding the total mass of the largest known galaxies. This might suggest that this galaxy has been caught in the act of formation prior to its transition from the blue cloud to the red sequence.
4.3. MS 1426.9+1052
| Galaxy | RA | DEC | r | ||
|---|---|---|---|---|---|
| (”) | (”) | (”) | (mag) | (mag) | |
| 1 | 0.000 | 0.000 | 0.000 | 17.32 0.18 | 1.65 0.28 |
| 2 | -40.712 | -35.650 | 54.115 | 19.25 0.22 | 0.87 0.31 |
| 3 | -51.641 | -29.798 | 59.622 | 18.53 0.19 | 1.53 0.29 |
| 4 | -24.161 | -28.263 | 37.183 | 18.74 0.20 | 2.27 0.33 |
| 5 | -27.625 | -29.245 | 40.229 | 17.94 0.18 | 1.81 0.29 |
| 6 | -2.455 | -22.960 | 23.091 | 19.32 0.23 | 1.86 0.36 |
| 7 | -4.699 | -14.326 | 15.077 | 19.32 0.23 | 1.19 0.34 |
| 8 | -1.657 | -8.484 | 8.645 | 17.86 0.18 | 1.89 0.29 |
| 9 | 18.830 | -7.844 | 20.398 | 18.52 0.19 | 1.11 0.29 |
| 10 | 10.365 | -4.190 | 11.180 | 18.31 0.19 | 0.56 0.28 |
| 11aaHas a measured photometric redshift of using SDSS data (Richards et al., 2009). | -17.572 | 1.746 | 17.658 | 18.88 0.21 | 0.88 0.30 |
| 12 | 18.403 | 4.213 | 18.879 | 18.98 0.20 | 1.06 0.30 |
| 13 | -18.602 | 5.316 | 19.347 | 17.98 0.19 | 0.82 0.28 |
| 14 | -6.800 | 7.373 | 10.030 | 18.28 0.19 | 1.74 0.29 |
| 15 | 31.851 | 8.302 | 32.915 | 16.84 0.18 | 1.63 0.28 |
| 16 | 3.553 | 14.216 | 14.653 | 18.10 0.19 | 1.62 0.29 |
| 17 | 16.026 | 21.328 | 26.678 | 18.36 0.19 | 1.24 0.29 |
| 18 | 20.009 | 33.412 | 38.945 | 18.95 0.21 | 1.54 0.32 |
| 19 | 21.558 | 7.115 | 22.702 | 20.88 0.60 | -0.34 0.64 |
| 20 | 0.422 | -19.404 | 19.409 | 20.70 0.54 | 0.33 0.61 |
| 21 | -31.632 | 2.164 | 31.706 | 19.91 0.31 | 1.03 0.40 |
| 22 | -3.954 | 67.597 | 67.712 | 18.65 0.20 | 1.01 0.29 |
| 23 | -32.659 | 59.472 | 67.850 | 17.55 0.18 | 2.31 0.29 |
| 24 | -43.508 | 65.673 | 78.777 | 17.94 0.19 | 1.99 0.29 |
| 25 | -36.862 | 67.383 | 76.807 | 17.14 0.18 | 1.71 0.28 |
| 26 | -53.406 | 60.234 | 80.501 | 19.22 0.23 | 1.52 0.34 |
| 27 | -76.388 | 0.576 | 76.390 | 18.82 0.23 | 2.78 0.78 |
| 28 | 3.388 | 48.021 | 48.140 | 19.78 0.28 | 0.97 0.37 |
| 29 | -51.012 | 36.668 | 62.823 | 20.21 0.38 | 0.43 0.46 |
| 30 | 14.034 | 13.015 | 19.141 | 19.44 0.24 | 2.52 0.54 |
| 31 | 12.620 | 34.705 | 36.928 | 19.43 0.25 | 2.62 0.57 |
| 32 | -62.294 | -16.795 | 64.518 | 19.00 0.21 | 1.97 0.34 |
| 33 | -44.385 | -11.477 | 45.845 | 19.45 0.27 | 2.11 0.45 |
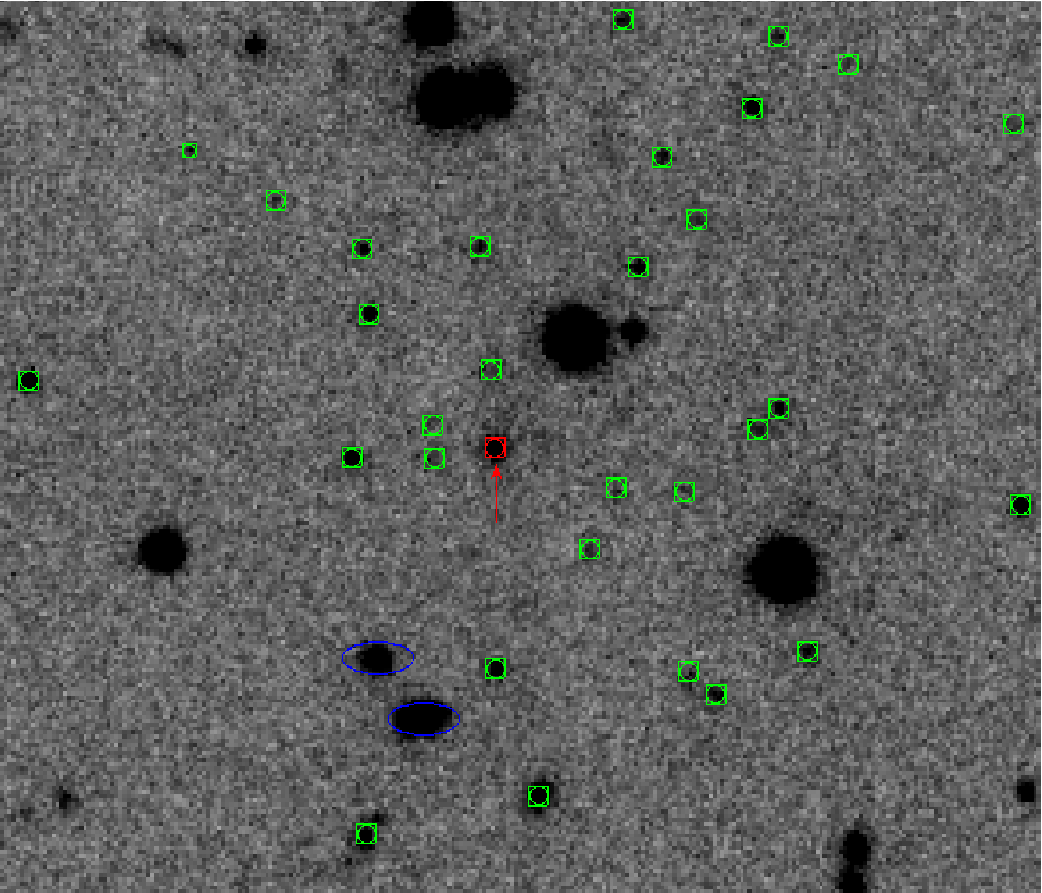
Note. — Galaxies surrounding Galaxy 1 (RA=14:29:24.1 and DEC=+10:39:15), the radio source MS 1426.9+1052.
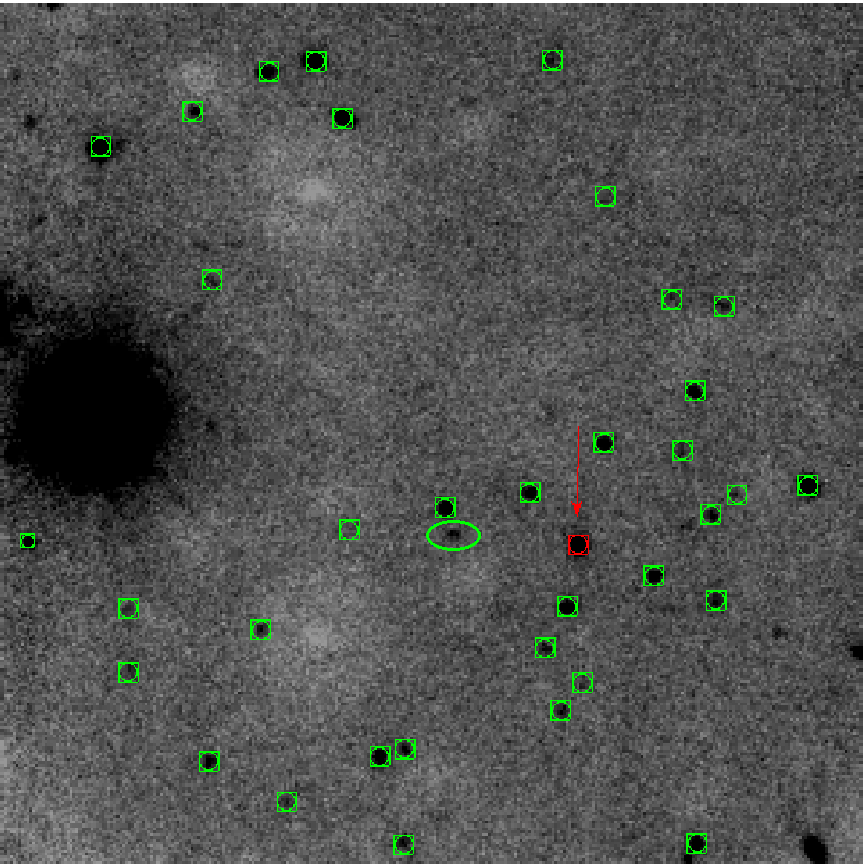
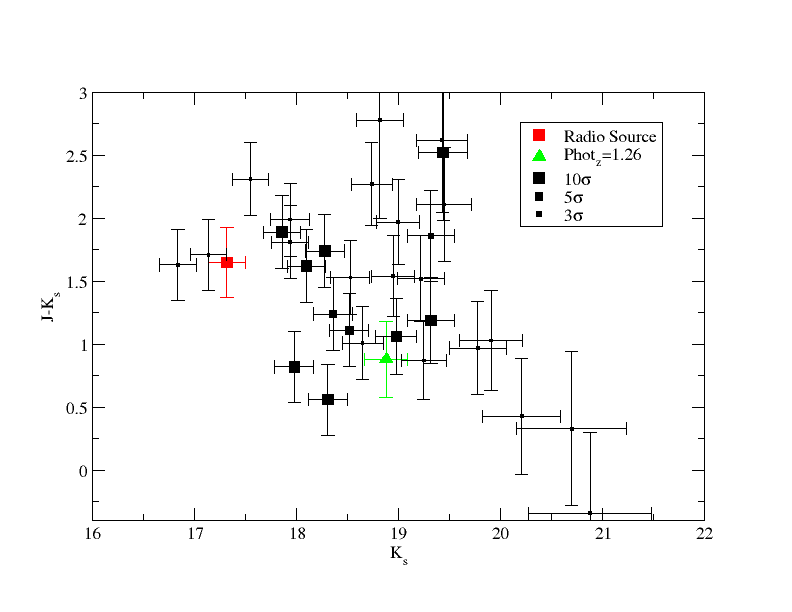
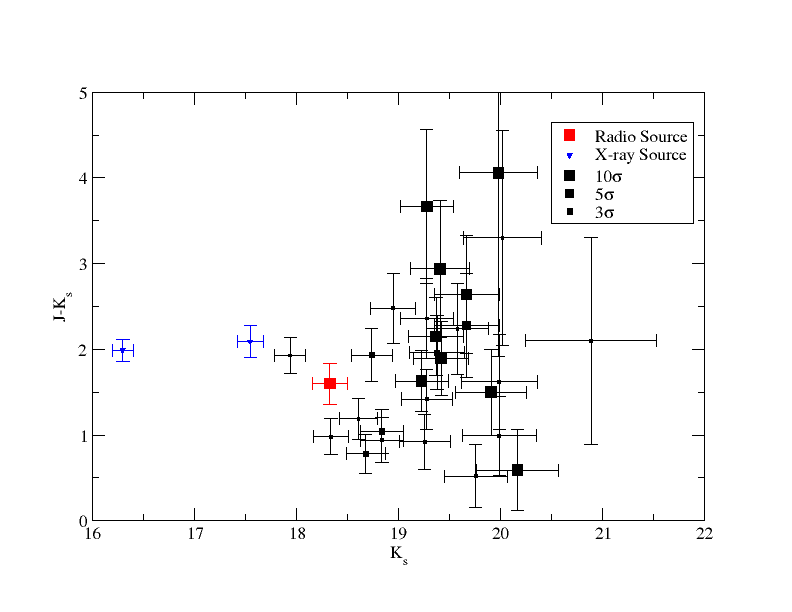
MS 1426 is the most distant candidate cluster in this sample, and it contains a large number of potential cluster galaxies, with 34 measured photometrically in Table 5. The SQIID image (Fig 5) surrounding the radio source was slightly off-center, so the selected galaxies are not evenly distributed from the radio source. The color-magnitude relation is shown in Fig 6, with a RS color consistent with the CMRs for CL J0442+0202 (Fig 2) and surrounding 3C 068.2 (Fig 4).
Richards et al. (2009) computed photometric redshifts of regions surrounding radio-loud sources within the SDSS database. There are two galaxies near MS 1426.9+1052 with photometric redshifts of , but were unfortunately off of the edge of the SQIID image. However, this provides a further indication that the field hosts a possible structure, in addition to the presence of a red sequence in the color-magnitude relation and the associated galaxy overdensity that was discussed in Section 3.
5. Discussion
| Field | Redshift | ||
|---|---|---|---|
| CL J0442+0202 | 40% (38%) | 25% (27%) | |
| 3C 068.2 | 41% (27%) | 26% (48%) | |
| MS 1426.9+1052 | 49% (60%) | 24% (10%) |
Note. — The blue () and faint red fractions () of galaxies for each cluster candidate. Values in parentheses are the fractions contained within the regions of greatest galaxy overdensity (). The blue fraction is calculated by using our CMR models for each cluster candidate (blue lines in Fig 8) which represents the expected red sequence at that redshift, and specifying the color cut as 0.2 magnitudes bluer than the expected red sequence, following the example of Butcher & Oemler (1984). The probability distribution of each galaxy that falls below that color cut is deemed part of the blue fraction. The faint red fraction utilizes the same CMR line, and the color cut is 0.2 mags redder, with the additional constraint that each galaxy must be 1.5 AB magnitudes fainter than the spectroscopic BCG in each cluster. Poissonian errors () are included.
Perhaps one of the oldest galaxy correlations is the one between galaxy absolute luminosity and global color, the color-magnitude relation (i.e., the CMR; Baum 1959; Faber 1973; Visvanathan & Sandage 1977). The CMR has been demonstrated to exist from the near-UV (Kaviraj et al., 2007) to near-IR wavelengths (Chang et al., 2006). A majority of these CMR studies can be summarized such that (1) the correlation is one of redder galaxy colors with increasing galaxy luminosity, (2) the correlation exists over a range of galaxy environments, but is strongest in the densest galaxy regions (Cooper et al., 2008), and (3) there exist distinct red and blue components to the CMR, with the red component being composed of early-type galaxies (ellipticals and S0’s, see Bower et al. 1992; van Dokkum et al. 1998; Hogg et al. 2004; López-Cruz et al. 2004; Baldry et al. 2004; Bell et al. 2004; Bernardi et al. 2005; McIntosh et al. 2005; De Lucia et al. 2006; Gallazzi et al. 2006).
The CMR is a member of a number of fundamental relations that relate the global properties in early-type galaxies, such as mass and kinematics (Dressler et al., 1987). Various formation and evolutionary scenarios are proposed to explain these fundamental relationships (Gavazzi et al., 1996). For example, galaxy interactions can remove the gas used for star formation and produce a relationship between age and galaxy mass (Moore et al., 1999). Ram pressure stripping can also strip galactic gas and halt star formation (Tecce et al., 2010). However, the comparison between spectroscopic indices and galaxy color indicates that the CMR is most strongly linked to the chemical enrichment history of a galaxy, as redder colors map directly into increasing metallicities (Thomas et al., 2005; Bernardi et al., 2005). The slope and scatter of the CMR can be reproduced if the redshift of galaxy formation is greater than 5 (Bower et al., 1998) even with a small amount of mass growth by mergers or bluer colors with recent star formation.
With respect to cluster populations, the CMR has also been used to define the ‘red envelope’ or red sequence (Ellis, 1988), the boundary between old, quiescent galaxies and star-forming systems. The small amount of scatter for the red sequence of the CMR has been used to argue that early-type galaxies are coeval and have evolved passively since their formation epoch (McIntosh et al., 2005; Schombert & Rakos, 2009b). The blue population (the ‘blue cloud’) can be compared to the red population by assigning the fraction of galaxies below 0.2 magnitudes of the red sequence; this fraction () becomes an indicator of the global star formation history in cluster populations. It can also be followed as a function of redshift (the Butcher-Oemler effect; Butcher & Oemler 1984), a key parameter for numerous galaxy formation and evolution scenarios.
The examination of the CMR in our sample begins with the construction of a fiducial CMR based on a sample of 1104 ellipticals in the local Universe (Schombert & Rakos, 2009b). The midline to that CMR, based on narrow band colors between 4100Å and 5500Å, is well described by the 12 Gyr old multi-metallicity models constructed in Schombert & Rakos (2009a). These models adopt the SED spectra from Bruzual & Charlot (2003) for single metallicity and age populations and convolve each age/metallicity with a star formation history (initial burst) and chemical enrichment scenario as outlined in Schombert & Rakos (2009a). The result is a perfect match to the optical CMR using only old (12 Gyrs) populations of varying metallicity. Interpretations of the CMR implying the need for younger stars (frosting models, see Trager et al. 2000) appear to be the consequence of neglecting the old, metal-poor (i.e., blue) component of the metallicity distribution (Schombert & Rakos, 2009a). This has been independently confirmed by Bregman et al. (2006) analyzing the infrared SEDs of early type galaxies.
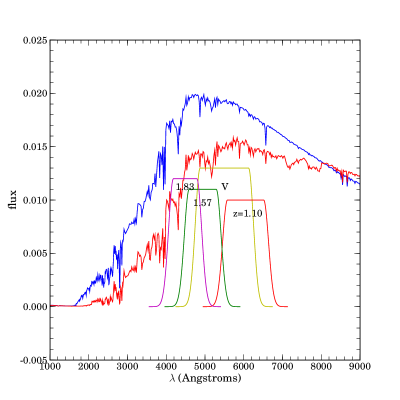
The CMR defined by optical colors is not directly transferable to this project, as the observations for this sample do not use redshifted filter sets as employed by the Rakos & Schombert program. Thus, we must convolve the bandpasses to the rest frame model spectra. The three cluster redshifts (1.10, 1.57, 1.83) place the center of the filter at rest frames 6,000Å, 4,903Å, 4,452Å and the filter at 10,571Å, 8,775Å, 7,845Å, respectively. This places the observed colors between the Johnson and range, redward of the 4000Å break. As the typical elliptical has a spectral intensity peak at 4,600Å (before a sharp drop off at the 4,000Å break and the metal line rich region between 4,200Å and 4,800Å), our expectation is that the observed colors will increase (redden) from 1.10 to 1.57, then shift blueward at 1.83 as the filter passes over the 4,600Å bump, as seen in Fig 7 for both a young and old galaxy. Indeed, that is what is seen in the mean cluster colors of (CL J0442+0202), (3C 068.2) and (MS 1426.9+1052), which is the uncertainty-weighted mean of all candidate galaxies.
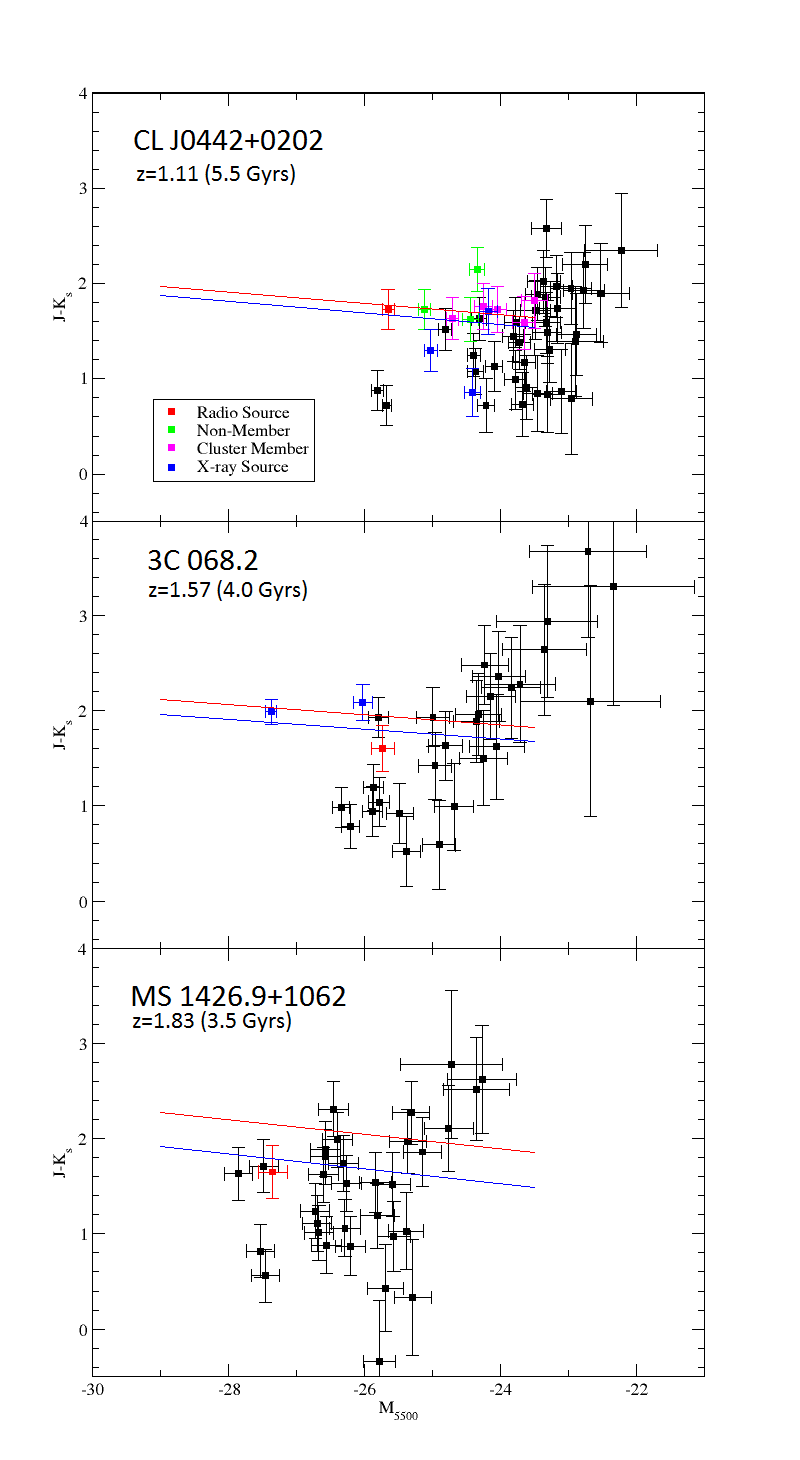
Comparison to the 12 Gyr old model CMR of Schombert & Rakos (2009b) is made by redshifting the model spectra to the redshift of the sample clusters. The result is shown in Fig 8 (red lines). These CMRs typically lie redward of the observed colors. This is, of course, due to the fact that the model CMR is produced for 12 Gyr populations. The age of the universe at the redshifts of the clusters will be 5.5, 4 and 3.5 Gyrs, respectively.
Altering the CMR for age simply requires recalculating the population model by halting at a younger age. The only color changes are due to age effects (shifts in the turnoff point to the blue) as metallicity effects are minor since single burst models have a rapid enrichment scenario (e.g., the typical early-type galaxy reaches 90% final metallicity in 3 Gyrs due to the rapid onset of galactic winds). Recalculating the models (and chemical enrichment) to those cluster ages produces the blue CMR lines in Fig 8. While the correction due to age is relatively small, the age corrected CMR’s are in better agreement with the cluster data. The close match between the red sequence and the model CMR’s suggests that these rich cluster ellipticals are effectively coeval with an early formation epoch.
The formation redshifts of these cluster candidates are difficult to constrain within the resolution of our data. For instance, using within our simulations produces red sequences that are offset from the blue lines in Fig 8 by for redshifts of , respectively. As discussed in Section 4, the photometry of 10 galaxies in CL J0442+0202 from Stern et al. (2003) show a bias when compared to our photometry of . For these ten galaxies, this bias could imply a bluer stellar population, and thus a smaller . Within the uncertainties of our data, we cannot formally fit a to the cluster candidates, but the early-type galaxies are consistent with .
Constraining the formation age of the galaxy in high redshift is challenging because of the inverse relation between redshift and cosmic age. For example, Eisenhardt et al. (2008) found that for a sample of IRAC-selected clusters at redshifts , colors favored , but could also be consistent with (see their Fig 19) with significant scatter in clusters at redshifts above . Our results are consistent, with at least a few galaxies appearing on the red sequence as old populations for their redshift.
Absolute AB magnitudes were computed by convolving the redshifted filter that each cluster is observed in with . As illustrated in Fig 7, the filters are compressed at higher redshift, which lowers the flux through the filter, so a -correction of -0.23, -0.50, and -0.75 magnitudes was applied to CL J0442+0202, 3C 068.2, and MS 1426.9+1052, respectively.
Clear, early evidence of evolution in the stellar populations of cluster galaxies is the Butcher-Oemler effect (Butcher & Oemler, 1984). Simply stated, the Butcher-Oemler effect is a sharp increase in the fraction of blue galaxies in a cluster as a function of redshift. Rakos & Schombert (1995) studied 509 galaxies in 17 clusters between redshifts of 0 and 1, and found a linearly increasing from present-day value of 5% to 80% at a redshift of 1. That study utilized Strömgren photometry to determine a color separation between nearby star-forming galaxies and ellipticals (anything blueward of or ), and then used customized filter sets to match those rest frame colors at the respective redshifts of each cluster. Any source more blue than this color separation is considered a member of the blue fraction for the cluster.
To calculate the blue fraction using filters, we computed the probability distribution for the color of each galaxy, and the fraction that falls 0.2 mags bluer than the CMR models of the red sequence (blue lines in Fig 8) are considered to be blue galaxies. The 0.2 magnitude offset is adopted from the example of Butcher & Oemler (1984), and we assumed Gaussian errors for the probability distribution. This results in values of 40% in CL J0442+0202, 41% for 3C 068.2, and 49% within MS 1426.9+1052. The are minimally reduced () if the blue fraction is simply defined as the number of galaxies that are 0.2 mags bluer than the CMR models. Errors are based on an assumed Poisson distribution (), as in Rakos & Schombert (1995). A summary of the values can be found in Table 6.
The values are less than expected from the rapid increase in from Rakos & Schombert (1995) (see their Figure 4). However, this can be interpreted as a consequence of the cosmic star formation rate as a function of redshift, in which galaxies at have nearly constant SFR (Madau et al., 1996), while the rate steadily declines from . Updated versions of the “Madau diagram” confirm this trend out to (Pérez-González et al., 2005). Our values of the blue fraction also agree with the more intensive spectroscopic GMASS study (Cassata et al., 2008) which finds of 50% at redshifts of 2. Indeed, Newman et al. (2014) find a cluster at that hosts 15/19 spectroscopically confirmed, quiescent members, further corroborating blue fractions that are sometimes small at this epoch. These differences could point to large variations in stages of cluster assembly and evolution in the Universe at these high redshifts.
If the sample is restricted to the regions of maximum overdensity within each cluster (e.g. , discussed in Section 3), the blue fraction decreases in the two low redshift targets but increases for MS 1426.9+1052. CL J0442+0202 has a relatively minor decrease to %, while 3C 068.2 at decreases from . MS 1426.9+1052 at increases its blue fraction within the region of largest overdensity by 11% to %. The large variability between candidate clusters at a range of redshifts is an interesting test of the evolution for cluster galaxies, as the innermost regions should have had the most dynamical interaction.
We also define the faint red fraction of galaxies () as those galaxies that are 1.5 AB magnitudes fainter than the spectroscopically confirmed BCG for each candidate cluster and 0.2 mags redder than the CMR model red sequence line used to compute the blue fraction, once again using the probability distribution with assumed Gaussian errors for each galaxy. CL J0442+0202 has a % for the entire sample of galaxies measured, and % within the region of overdensity. At the redshift of , 3C 068.2 has a % overall, but a 22% increase within the central overdensity to %, which corroborates the results from its measurement. Our highest redshift candidate MS 1426.9+1052 has a comparatively low red fraction within the overdense region of a mere %, with % for the entire sample. These faint, red galaxies are presumably reactants in future dry mergers that would be hierarchically accreted to form galaxies on the red sequence. The blue and faint red fractions are listed in Table 6.
Simple scenarios to build up the red sequence via the quenching and merging of blue galaxies, followed by dry mergers have been proposed by Faber et al. (2007). These would require a significant population of interacting blue disk galaxies to transform relatively weak CMRs at high redshift into the developed red sequence features seen in rich, nearby clusters (see Figs 3, 4 in Eisenhardt et al. 2007). Papovich et al. (2012) conclude that a series of dry mergers is the dominant mechanism in the growth of quiescent galaxies based on an in-depth analysis of a cluster at . The processes that shape the growth of even the most massive galaxies do not seem to be resolved. Some recent studies conclude that ongoing mergers after are necessary to match the present-day BCGs (Ferreras et al., 2012; Fassbender et al., 2014), while Fritz et al. (2014) suggest that major mergers are of minimal importance.
The extent to which there is a well defined red sequence CMR at high redshift impacts our models of galaxy formation. CMRs out to redshifts of 1 are well established (see Mei et al. 2009 and references therein) as well as in some protoclusters at redshifts of up to (Steidel et al., 2005; Overzier et al., 2008). The stellar populations of galaxies on the red sequence at , which match passively evolving color evolution models, is consistent with the massive, bright end of the CMR being in place by a few Gyrs after the dawn of time. This suggests that at least some massive galaxies experience the epoch of primary star formation at quite high redshift. Our results are consistent with the findings of Eisenhardt et al. (2008) (see their Figs 17,19).
This is in agreement with the observation that protocluster galaxies are, in general, older than field galaxies of the same redshift (Peter et al., 2007), as if high density environments accelerate galaxy color and morphological evolution. Larger intrinsic scatter in the CMR with redshift has been interpreted as due to age effects (Mei et al., 2009); however, it becomes increasingly difficult to separate passive age changes in ellipticals with increasing star formation in the blue cloud. The separation between the red sequence and the blue cloud becomes problematic inside of 2 Gyrs from the onset of galaxy formation.
The red sequence is nominally identified with ellipticals in the cluster core region, for they have the reddest colors out to high redshifts (Mei et al., 2009). This is supported by the fact that the slope and zeropoint of the CMR is unchanged (aside from age corrections) between our sample (at a mean redshift of 1.5) and the present-day. The galaxies producing an increasing blue fraction with redshift are perhaps the cluster proto-S0 population, for they have the largest color scatter in present-day clusters and would match the “quenching” scenario, where infalling galaxies interact with the cluster environment to halt star formation (Rakos & Schombert, 1995; Faber et al., 2007).
While the results presented herein are similar to other studies based on spectroscopic and space-imaging morphology, we achieve many of the same goals with respect to the star formation history of cluster galaxies, but with a much smaller amount of telescope time. In addition, the identification of the high redshift clusters themselves, as preliminary observations before spectroscopy on large aperture telescopes and limited space-imaging time, argues for an extensive ground-based near-IR survey of the environment around radio sources. The analysis of the photometric CMR, combined with accurate stellar population models, provides a different window into the star formation history of cluster galaxies.
6. Summary and Future Work
We have presented three candidate galaxy clusters spanning the redshift regime of identified as near-infrared galaxy overdensities surrounding radio-loud sources. From deep NIR imaging, color magnitude diagrams were constructed and compared to the galaxy models of Schombert & Rakos (2009b). We find that the ellipticals on the red sequence within each cluster candidate were all formed at a relatively old age. The data are consistent with in our models, but we lack the resolution to formally fit a formation redshift. These apparently old, massive red sequence galaxies, while clearly present, are a minority of the cluster population. There is a slowly increasing blue fraction of galaxies within each cluster candidate as a function of redshift, from at up to at .
The candidate clusters are prime targets for further study. Use of the Hubble Space Telescope’s superior imaging capabilities, compared to ground-based NIR images, could provide galaxy morphology and mass estimates (Cassata et al., 2013), along with measurements of individual SFRs (Lee et al., 2014b), even at these redshifts. The two candidates with larger redshifts, 3C 068.2 and MS 1426.9+1052, would benefit from multi-object spectroscopy, primarily to establish cluster membership, while secondarily providing insight into the types of galaxies inhabiting proto-clusters (e.g. emission line signatures), as Stern et al. (2003) did with CL J0442+0202.
In the X-ray, Chandra or XMM-Newton could potentially be used to confirm these objects as clusters via their ICM emission, as well as providing a mass-estimate for the system. Similarly, one could use CARMA to measure the SZ signal, which will accomplish similar goals as the aforementioned X-ray observations, but with a potentially more modest investment of telescope time.
Most importantly, a confirmation of the presence of a physical structure with spectroscopic redshifts in any of these potential clusters will add to the small but growing number of high-redshift clusters. The number density as a function of redshift and an estimate of the structures mass can provide constraints on cosmological parameters and offer comparisons to simulations of large-scale structure. The leverage to constrain models improves with increasing mass and redshift. Further investigations into the properties of the constituent galaxies (morphology, colors, spectral signatures) will be facilitated by first establishing a virialized structure.
References
- Baldry et al. (2004) Baldry, I. K., Glazebrook, K., Brinkmann, J., Ivezić, Ž., Lupton, R. H., Nichol, R. C., & Szalay, A. S. 2004, ApJ, 600, 681
- Barthel et al. (2012) Barthel, P., Haas, M., Leipski, C., & Wilkes, B. 2012, ApJ, 757, L26
- Baum (1959) Baum, W. A. 1959, PASP, 71, 106
- Bell et al. (2004) Bell, E. F., et al. 2004, ApJ, 608, 752
- Bernardi et al. (2005) Bernardi, M., Sheth, R. K., Nichol, R. C., Schneider, D. P., & Brinkmann, J. 2005, AJ, 129, 61
- Bertin & Arnouts (1996) Bertin, E., & Arnouts, S. 1996, A&AS, 117, 393
- Bower et al. (1998) Bower, R. G., Kodama, T., & Terlevich, A. 1998, MNRAS, 299, 1193
- Bower et al. (1992) Bower, R. G., Lucey, J. R., & Ellis, R. S. 1992, MNRAS, 254, 601
- Bregman et al. (2006) Bregman, J. N., Temi, P., & Bregman, J. D. 2006, ApJ, 647, 265
- Bruzual & Charlot (2003) Bruzual, G., & Charlot, S. 2003, MNRAS, 344, 1000
- Butcher & Oemler (1984) Butcher, H., & Oemler, Jr., A. 1984, ApJ, 285, 426
- Cassata et al. (2008) Cassata, P., et al. 2008, A&A, 483, L39
- Cassata et al. (2013) —. 2013, ApJ, 775, 106
- Cen & Ostriker (1994) Cen, R., & Ostriker, J. P. 1994, ApJ, 429, 4
- Chang et al. (2006) Chang, R., Shen, S., Hou, J., Shu, C., & Shao, Z. 2006, MNRAS, 372, 199
- Cooper et al. (2008) Cooper, M. C., et al. 2008, MNRAS, 383, 1058
- Culverhouse et al. (2010) Culverhouse, T. L., et al. 2010, ApJ, 723, L78
- De Lucia et al. (2006) De Lucia, G., Springel, V., White, S. D. M., Croton, D., & Kauffmann, G. 2006, MNRAS, 366, 499
- Dressler et al. (1987) Dressler, A., Lynden-Bell, D., Burstein, D., Davies, R. L., Faber, S. M., Terlevich, R., & Wegner, G. 1987, ApJ, 313, 42
- Eisenhardt et al. (2007) Eisenhardt, P. R., De Propris, R., Gonzalez, A. H., Stanford, S. A., Wang, M., & Dickinson, M. 2007, ApJS, 169, 225
- Eisenhardt et al. (2008) Eisenhardt, P. R. M., et al. 2008, ApJ, 684, 905
- Ellis (1988) Ellis, R. S. 1988, in NATO ASIC Proc. 229: Cooling Flows in Clusters and Galaxies, ed. A. C. Fabian, 305–313
- Faber (1973) Faber, S. M. 1973, ApJ, 179, 731
- Faber et al. (2007) Faber, S. M., et al. 2007, ApJ, 665, 265
- Fassbender et al. (2014) Fassbender, R., et al. 2014, A&A, 568, A5
- Ferreras et al. (2012) Ferreras, I., et al. 2012, AJ, 144, 47
- Fritz et al. (2014) Fritz, A., et al. 2014, A&A, 563, A92
- Galametz et al. (2010) Galametz, A., Stern, D., Stanford, S. A., De Breuck, C., Vernet, J., Griffith, R. L., & Harrison, F. A. 2010, A&A, 516, A101
- Gallazzi et al. (2006) Gallazzi, A., Charlot, S., Brinchmann, J., & White, S. D. M. 2006, MNRAS, 370, 1106
- Gavazzi et al. (1996) Gavazzi, G., Pierini, D., Baffa, C., Lisi, F., Hunt, L. K., Randone, I., & Boselli, A. 1996, A&AS, 120, 521
- Gobat et al. (2011) Gobat, R., et al. 2011, A&A, 526, A133
- Gobat et al. (2013) —. 2013, ApJ, 776, 9
- Haas et al. (2009) Haas, M., et al. 2009, ApJ, 695, 724
- Hall & Green (1998) Hall, P. B., & Green, R. F. 1998, ApJ, 507, 558
- Hall et al. (2001) Hall, P. B., et al. 2001, AJ, 121, 1840
- Hogg et al. (2004) Hogg, D. W., et al. 2004, ApJ, 601, L29
- Kaviraj et al. (2007) Kaviraj, S., Kirkby, L. A., Silk, J., & Sarzi, M. 2007, MNRAS, 382, 960
- Keisler et al. (2011) Keisler, R., et al. 2011, ApJ, 743, 28
- Lee et al. (2014a) Lee, K.-S., Dey, A., Hong, S., Reddy, N., Wilson, C., Jannuzi, B. T., Inami, H., & Gonzalez, A. H. 2014a, ArXiv e-prints
- Lee et al. (2014b) Lee, S.-K., Ferguson, H. C., Somerville, R. S., Giavalisco, M., Wiklind, T., & Dahlen, T. 2014b, ApJ, 783, 81
- López-Cruz et al. (2004) López-Cruz, O., Barkhouse, W. A., & Yee, H. K. C. 2004, ApJ, 614, 679
- Madau et al. (1996) Madau, P., Ferguson, H. C., Dickinson, M. E., Giavalisco, M., Steidel, C. C., & Fruchter, A. 1996, MNRAS, 283, 1388
- Mantz et al. (2014) Mantz, A. B., et al. 2014, ArXiv e-prints
- McIntosh et al. (2005) McIntosh, D. H., et al. 2005, ApJ, 632, 191
- Mei et al. (2009) Mei, S., et al. 2009, ApJ, 690, 42
- Menanteau et al. (2012) Menanteau, F., et al. 2012, ApJ, 748, 7
- Moore et al. (1999) Moore, B., Lake, G., Quinn, T., & Stadel, J. 1999, MNRAS, 304, 465
- Mortonson et al. (2011) Mortonson, M. J., Hu, W., & Huterer, D. 2011, Phys. Rev. D, 83, 023015
- Muchovej et al. (2007) Muchovej, S., et al. 2007, ApJ, 663, 708
- Newman et al. (2014) Newman, A. B., Ellis, R. S., Andreon, S., Treu, T., Raichoor, A., & Trinchieri, G. 2014, ApJ, 788, 51
- Overzier et al. (2008) Overzier, R. A., et al. 2008, ApJ, 673, 143
- Papovich (2008) Papovich, C. 2008, ApJ, 676, 206
- Papovich et al. (2010) Papovich, C., et al. 2010, ApJ, 716, 1503
- Papovich et al. (2012) —. 2012, ApJ, 750, 93
- Pérez-González et al. (2005) Pérez-González, P. G., et al. 2005, ApJ, 630, 82
- Peter et al. (2007) Peter, A. H. G., Shapley, A. E., Law, D. R., Steidel, C. C., Erb, D. K., Reddy, N. A., & Pettini, M. 2007, ApJ, 668, 23
- Planck Collaboration et al. (2013a) Planck Collaboration et al. 2013a, ArXiv e-prints
- Planck Collaboration et al. (2013b) —. 2013b, ArXiv e-prints
- Rakos & Schombert (1995) Rakos, K. D., & Schombert, J. M. 1995, ApJ, 439, 47
- Richards et al. (2009) Richards, G. T., et al. 2009, ApJS, 180, 67
- Rozo & Rykoff (2014) Rozo, E., & Rykoff, E. S. 2014, ApJ, 783, 80
- Schombert & Rakos (2009a) Schombert, J., & Rakos, K. 2009a, AJ, 137, 528
- Schombert & Rakos (2009b) —. 2009b, ApJ, 699, 1530
- Sievers et al. (2013) Sievers, J. L., et al. 2013, JCAP, 10, 60
- Steidel et al. (2005) Steidel, C. C., Adelberger, K. L., Shapley, A. E., Erb, D. K., Reddy, N. A., & Pettini, M. 2005, ApJ, 626, 44
- Stern et al. (2003) Stern, D., Holden, B., Stanford, S. A., & Spinrad, H. 2003, AJ, 125, 2759
- Tecce et al. (2010) Tecce, T. E., Cora, S. A., Tissera, P. B., Abadi, M. G., & Lagos, C. D. P. 2010, MNRAS, 408, 2008
- Thomas et al. (2005) Thomas, D., Maraston, C., Bender, R., & Mendes de Oliveira, C. 2005, ApJ, 621, 673
- Tody (1986) Tody, D. 1986, in Society of Photo-Optical Instrumentation Engineers (SPIE) Conference Series, Vol. 627, Instrumentation in astronomy VI, ed. D. L. Crawford, 733
- Tody (1993) Tody, D. 1993, in Astronomical Society of the Pacific Conference Series, Vol. 52, Astronomical Data Analysis Software and Systems II, ed. R. J. Hanisch, R. J. V. Brissenden, & J. Barnes, 173
- Trager et al. (2000) Trager, S. C., Faber, S. M., Worthey, G., & González, J. J. 2000, AJ, 120, 165
- van Dokkum et al. (1998) van Dokkum, P. G., Franx, M., Kelson, D. D., & Illingworth, G. D. 1998, ApJ, 504, L17
- Venemans et al. (2002) Venemans, B. P., et al. 2002, ApJ, 569, L11
- Vikhlinin et al. (2009) Vikhlinin, A., et al. 2009, ApJ, 692, 1060
- Visvanathan & Sandage (1977) Visvanathan, N., & Sandage, A. 1977, ApJ, 216, 214
- Wilkes et al. (2013) Wilkes, B. J., et al. 2013, ApJ, 773, 15
- Willis et al. (2013) Willis, J. P., et al. 2013, MNRAS, 430, 134
- Wright (2006) Wright, E. L. 2006, PASP, 118, 1711