On the distance of the Globular Cluster M4 (NGC 6121) Using RR Lyrae Stars: II. Mid-Infrared Period-Luminosity Relations.
Abstract
New mid-infrared period-luminosity (PL) relations are presented for RR Lyræ variables in the globular cluster M4 (NGC 6121). Accurate photometry was obtained for 37 RR Lyræ variables using observations from the Infrared Array Camera onboard the Spitzer Space Telescope. The dispersion of M4’s PL relations is 0.056, and the uncertainty in the slope is 0.11 mag. Additionally, we established calibrated PL relations at 3.6 and 4.5 µm using published Hubble Space Telescope geometric parallaxes of five Galactic RR Lyræ stars. The resulting band-averaged distance modulus for M4 is . The systematic uncertainty will be greatly reduced when parallaxes of more stars become available from the GAIA mission. Optical and infrared period-color (PC) relations are also presented, and the lack of a MIR PC relation suggests that RR Lyræ stars are not affected by CO absorption in the 4.5 µm band.
Subject headings:
Stars: variables: RR Lyrae — Globular Clusters: individual: M4 — Stars: distances — Stars: horizontal branch1. Introduction
RR Lyræ variables are important tools in the investigation of many fundamental astrophysical problems. They provide crucial constraints on the physical mechanisms driving radial oscillations and their interplay with stellar evolution (Cox, 1963; Christy, 1966; Castor, 1971). Furthermore, RR Lyræ stars offer the opportunity to study the morphology of the horizontal branch and the Oosterhoff dichotomy (Oosterhoff, 1939). Current empirical evidence indicates that the mean period of fundamental mode (RRab or FU) RR Lyræ stars in Galactic globular clusters (GGCs hereafter) shows a dichotomous distribution at 0.55 (OoI) and 0.65 (OoII) days (Sandage, 1993), where the latter group is more metal-poor. There is also evidence that the dichotomy is the aftermath of the hysteresis mechanism suggested by van Albada & Baker (1973), i.e. that the pulsation mode depends on the direction of the evolution inside the instability strip (Bono et al., 1997; Fiorentino et al., 2012; Kunder et al., 2013). Baade (1944) employed the RR Lyræ stars as a probe to identify the two main stellar populations in the Galaxy, as well as to study the stellar content of the Galactic Bulge through low-reddening regions (Baade, 1957; Plaut, 1968).
Beyond stellar evolution, RR Lyræ variables have also played a key role in providing estimates of cosmological parameters, and have been instrumental in measuring the distances to a sizable sample of GGcs. This allowed the estimation of absolute cluster ages, and in turn set the lower limit on the age of the Universe (Hesser, 1991; Sandage, 1993; Buonanno et al., 1998; Marín-Franch et al., 2009; Bono et al., 2010; VandenBerg et al., 2013). Moreover, RR Lyræ variables have been used to estimate the primordial helium content using the A-parameter, i.e. the mass to luminosity relation of low-mass central helium-burning stars (Caputo et al., 1983; Sandquist, 2010).
RR Lyræ stars are also the most commonly adopted Population II distance indicator. With a lower mass than classical Cepheids, they have the key advantage to be ubiquitous, and have been identified in both early and late type stellar systems (Van den Bergh, 1999). Their individual distances can be evaluated using multiple diagnostics, including a visual magnitude-metallicity relation (Chaboyer et al., 1996; Bono et al., 2003; Cacciari & Clementini, 2003) and a statistical parallax (Kollmeier et al., 2013; Dambis et al., 2013). More importantly, they obey to well defined near-infrared (NIR) period-luminosity (PL) relations (Longmore et al., 1986; Bono et al., 2001, 2003; Catelan et al., 2004; Braga et al., 2015). These PL relations extend to mid-infrared (MIR) bands where they have the potential of being very accurate distance indicators due to lower extinction and smaller intrinsic scatter (Madore et al., 2013; Klein et al., 2014). The use of the I,V-I reddening free period-Wesenheit (PW) relation to estimate the individual distances of RR Lyræ stars dates back to Soszynski et al. (2003) and to Majaess (2010). A more recent theoretical framework developed by Marconi et al. (2015) further supports the use of optical, optical-NIR, and NIR period-Wesenheit-metallicity (PWZ) relations to determine individual distances of RR Lyræ stars. Empirical validations to the above pulsation and evolutionary predictions have been provided by Braga et al. (2015) for RR Lyræ stars in the GGC M4 and by Coppola et al. (2015, in preparation) for RR Lyræ stars in the Carina dwarf spheroidal.
The Carnegie RR Lyræ Program (CRRP) aims to take full advantage of the unique characteristics of these stars in order to reduce the remaining sources of uncertainty in the Hubble constant to %. RR Lyræ MIR PL relations will be used as the foundation of an independent Population II cosmological distance scale to calibrate TRGB distances for nearby distances, which in turn can be used to calibrate Type Ia Supernova distances. To achieve this goal, we observed over 1,700 RR Lyræ variables in 31 selected GGCs, as well as RR Lyræ stars in strategically distributed areas in the Galactic Halo and the Bulge. In addition, we observed 48 of the nearest, brightest and less reddened RR Lyræ stars intended to be used as zero point calibrators. These observations have been conducted during the warm mission of the Spitzer Space Telescope (Werner et al., 2004) Infrared Array Camera (IRAC, Fazio et al., 2004), at 3.6 and 4.5 µm wavelength, with a cadence designed to obtain complete coverage of each RR Lyræ variable over at least one full period.
In this work we focus on the GGC Messier 4 (M4, NGC 6121). This cluster is an ideal laboratory for stellar population studies given its proximity to the Sun, which allows us to obtain accurate photometric and spectroscopic data for member stars well below the main-sequence turnoff. Due to these characteristics, M4 has been the subject of intensive observational campaigns over a wide range of wavelengths. It has a well characterized differential extinction of mag, where the uncertainty is the dispersion due to differential reddening (Hendricks et al., 2012), and mean metallicity of , (Braga et al., 2015, and references therein). In support of the CRRP program, we have analyzed available multi-epoch optical and NIR data, leading to the identification and characterization of 45 RR Lyræ variables (Stetson et al., 2014). From these observations, we have derived accurate distance moduli based on optical and NIR PL and PW relations (Braga et al., 2015). In this paper we combine our previous results with the new MIR data obtained as part of the CRRP campaign.
In Section 2 we present our new Spitzer photometry. Light curves for all the RR Lyræ variables in our sample are measured in Section 3. In Section 4 we derive MIR PL and period-color (PC) relationships for the cluster RR Lyræ variables, while in Section 5 we calculate the M4 distance modulus by calibrating our PL zero point using five nearby calibrator RR Lyræ stars with known parallax, also observed as part of the CRRP program. Dependence of the PL zero point from metallicity is also discussed in Section 5, while Section 6 summarizes the results of this work.
2. Observations, Data Reduction and Photometry
The results of our ground-based optical and NIR monitoring of the stellar population in M4 have been published in Stetson et al. (2014) and Braga et al. (2015). In this paper we extend our wavelength coverage to the MIR, by including multi-epoch 3.6 and 4.5 µm photometry of a large portion of the cluster.
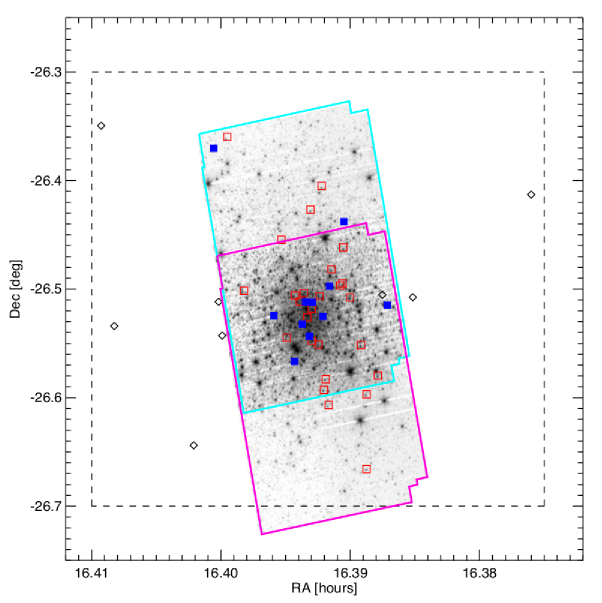
Our IRAC observations of M4 were executed on 2013 June 2 - 3 as part of the warm Spitzer Space Telescope Cycle 9 (PID 90088). The cluster was observed at IRAC 3.6 and 4.5 bands at 12 equally spaced epochs over hours. For each epoch we obtained 30 frames with a medium scale five-point Gaussian dither pattern and a mapping, taken using the IRAC full frame mode with a frame time of 30 seconds to provide a median total exposure of 804 seconds per pixel. An area at the center of the cluster was covered in both the 3.6 and 4.5 µm bands. Due to the IRAC focal plane array configuration, in the outer regions of the cluster only one band is available, with the area just north of the center of the cluster only covered at 3.6 µm and the region south of the center only covered at 4.5 µm. The total area mapped by our observations covers a strip of , roughly cutting North-to-South through the center of the cluster, as shown in Figure 1. This is about one third of the total cluster area that was mapped in our ground-based optical and NIR observations, but is still the size of the half-mass radius of M4 ( according to Harris 1996).
The CRRP IRAC data were reduced starting from the Basic Calibrated Data (BCDs) generated by the Spitzer IRAC pipeline version S19.1.0. Photometry was performed using the most recent version of the DAOPHOT/ALLSTAR/ALLFRAME suite of programs for crowded-field stellar photometry (Stetson, 1987, 1994). In order to mitigate the effect of blending in the photometry of the M4 crowded field, we used an input source catalog derived by the higher angular resolution optical and NIR images described in Stetson et al. (2014). In addition to higher resolution, this input source catalog is also deeper. For the optical and NIR, accurate photometry was achieved down to 24 and 22 magnitudes respectively, compared to 17 mag for the MIR images. This catalog was matched to the Spitzer data after applying higher order geometric corrections to the individual IRAC BCDs than the default ones provided by the Spitzer IRAC pipeline. With this procedure we matched 17,595 sources at 3.6 µm and 16,313 sources at 4.5 µm, for which we measured an instrumental magnitude with variable Point Spread Function (PSF) fitting. The astrometric accuracy of our final source catalog is of the order of .
For the optical and NIR images, good photometry was achieved down to 24 and 20 magnitudes respectively
The photometry was calibrated to standard IRAC Vega magnitudes using aperture photometry on mosaic images. The mosaics were generated using the IRACproc package (Schuster et al., 2006), a Perl Data Language wrapper script for the standard Spitzer Science Center mosaicking software MOPEX (Makovoz et al., 2005). We adopted a mosaic pixel scale of 0.61′′/pix, or half the native IRAC pixel scale. The stars we selected for aperture photometry calibration are far from the center of the cluster to reduce blending. In addition, we removed any possible variable stars, by avoiding sources with a Welch & Stetson variability index (Welch & Stetson, 1993; Stetson, 1996) greater than from the median. We selected a total of 38 stars at 3.6 µm and 44 at 4.5 µm. We used an aperture of 3 native IRAC pixels () with an annulus of 3 to 7 pixels ( to ). The aperture corrections necessary to convert magnitudes derived with this aperture/annulus combination to the standard IRAC 10 pixel aperture photometry are 1.1284 and 1.1274 for 3.6 and 4.5 respectively, calculated on isolated stars in the mosaics. The calibrating stars cover a range of 4 magnitudes and are distributed randomly across the array, outside of the central region.
Despite the relatively small size of our adopted photometric apertures, the crowding of the field even outside the center of the cluster (M4 is projected behind the Scorpius-Ophiuchus cloud complex) still results in blending contamination of aperture photometry for our calibration sources. These blended sources are however in many cases resolved by the PSF fitting procedure performed in DAOPHOT on the higher resolution visible and NIR images, from which our input catalog is derived. We thus used our point source photometric catalog to improve the photometric zero point calibration by subtracting from the calibrator aperture photometry the flux (measured from the PSF-fitting photometry) of any blended sources found within our chosen aperture. For each blended source we estimated the contaminating flux by measuring the fraction of its flux falling within our 3 pixel aperture, as a function of its centroid distance from the aperture’s center. For this task we used the IRAC PSF described in Hora et al. (2012), taking advantage of its higher sampling ( of the native IRAC pixels) to derive corrections for fractional pixel shifts. At 3.6 µm 17 of our 38 calibrators were found to be contaminated by an average of 0.03 mag. The 4.5 µm region was less crowded, resulting in only 7 out of 44 contaminated calibrators, but contaminated by 0.11 mag on average.
The magnitudes of the de-blended calibrators were then subtracted from their DAOPHOT instrumental magnitudes to derive the final calibration zero point. We found no trend in the calibration zero point with either brightness or array location. The uncertainty in our final calibration is 0.018 mag at 3.6 µm and 0.017 mag at 4.5 µm, based on the standard deviation between the instrumental and measured magnitudes. This standard deviation of the calibration increases dramatically for the fainter stars in our calibration sample. If we select only calibrating stars brighter than 14 mag, then the error in the calibration is reduced to 0.015 at 3.6 µm and 0.013 at 4.5 µm.
At the end of this process, we obtained a photometric catalog in both IRAC bands for all point sources detected in our field of view. From this catalog we matched 37 of the 45 RR Lyræ stars with optical photometry derived by Stetson et al. (2014), 26 of them fundamental mode (FU, RRab) pulsators, and 11 pulsating in first overtone (FO, RRc). Of the remaining eight RR Lyræ stars in the cluster, seven are outside the area mapped in at least one of the two IRAC bands, and one (V64) is a field variable in the background of the cluster, too faint to be detected by IRAC. All M4 RR Lyræ stars are indicated in Figure 1 by squares, with open red and filled blue symbols for FU and FO RR Lyræ stars detected in at least one IRAC band.
The final magnitude of each non-variable star was derived by averaging the value measured in all epochs and in all dithers. For the RR Lyræ variables we instead preserved the photometry for each epoch, averaging only on the individual dithers, after correcting the photometry in each dither for the warm Spitzer location-dependent photometric corrections available at the Spitzer Science Center web site.111http://irsa.ipac.caltech.edu/data/SPITZER/docs/irac/calibrationfiles/locationcolor/ The photometric uncertainty in each epoch is given by the standard deviation of all of the available measurements. A sample of the individual data points for one star, V1, is given in Table 1; all data is available in the online version of this article. A few RR Lyræ stars were covered in only one of the five dither positions, and one magnitude measurement was available in each epoch. For these stars (V1, V42, V2, and V29) the photometric uncertainty is instead derived from the repeatability parameter provided by DAOPHOT, which tends to be larger than the photometric error based exclusively on photon and background noise.
3. RR Lyræ Light Curves and Average Magnitudes
Our MIR sample of M4 RR Lyræ variables consists of 37 stars, whose location is shown in Figure 1. Of those, 26 are pulsating in fundamental mode (FU, RRab) and 11 are first overtone pulsators (FO, RRc). Not all sources have complete coverage in the IRAC dataset: of the 37 RR Lyræ stars in the area mapped by at least one IRAC band, only 28 have photometry at both 3.6 and 4.5 µm, with six sources covered only at 3.6 µm and three covered only at 4.5 µm. The periods of our RR Lyræ stars range between 0.2275 days (V49) to 0.6240 days (V39), plus a long-period FU RR Lyræ (V52) with a period of 0.8555 days.
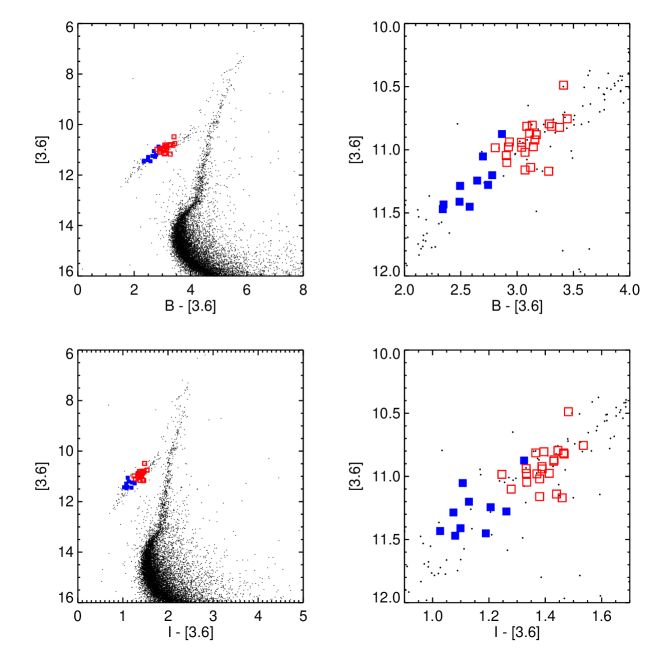
Figure 2 shows representative color-magnitude diagrams (CMDs) for M4 based on our MIR and optical photometry, with the IRAC 3.6 µm magnitude vs. the (top left) and (bottom left) colors. Note how the high photometric quality of our data allows a well characterized turn-off in all color combinations, and a well populated sub-giant, RGB and AGB branch. The FO and FU RR Lyræ stars are represented by filled blue and open red squares respectively. We see a clear separation of the FO and FU RR Lyræ stars in the horizontal branch of the CMD, with the FO bluer than the FU variables (right panels).
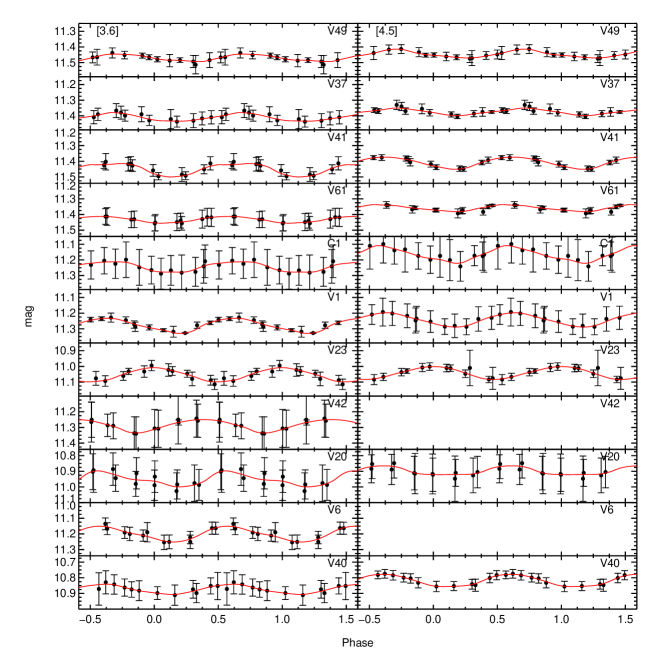
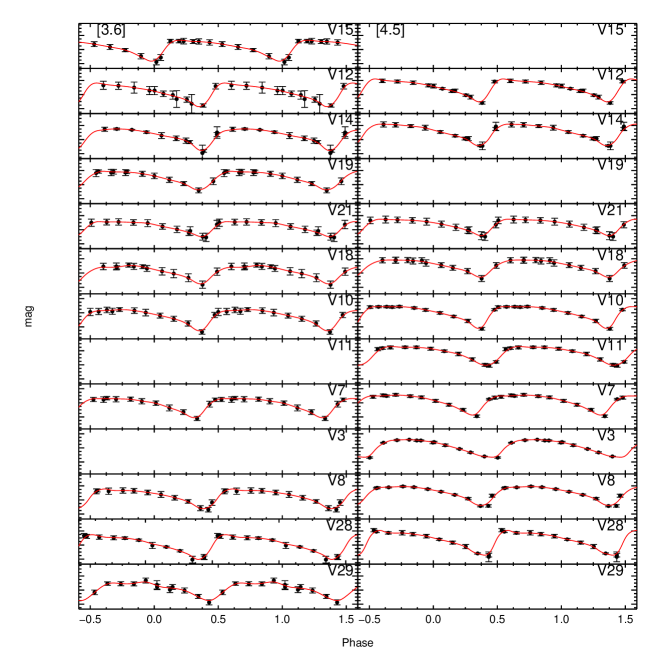
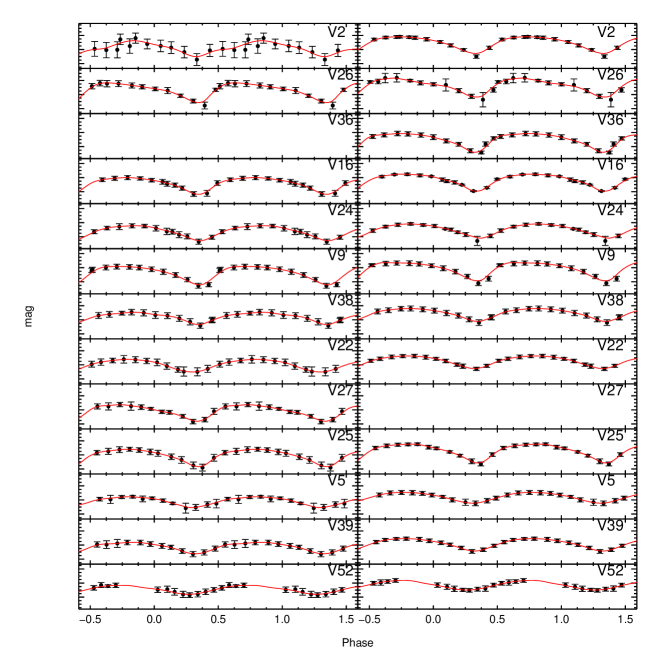
We derived MIR light curves for each RR Lyræ in our catalog by phasing their multiple-epoch photometry based on the epoch of maximum () and the period derived by Stetson et al. (2014) using the Lomb-Scargle method from the visible data. Sample light curves are shown in Figure 3 for FO variables and 4 for FU variables. The light curves are shown in order of increasing period. Following Madore et al. (2013), for each star we derived a smoothed light curve using a Gaussian local estimation (GLOESS) algorithm, a method where a second-order polynomial is fit locally and points are weighted by their Gaussian distance from an interpolation point. A full description of the GLOESS method is given in Persson et al. (2004). The mean magnitude for all stars was then determined by integrating the smoothed light curve flux intensity over one period, then converting the result back into a magnitude. The variability amplitude in magnitude was also derived from the smoothed light curve, and the uncertainty is calculated using only the data points that lie within the Gaussian window of the maximum and minimum of the smoothed curve.
The uncertainty in the mean magnitude is calculated by the sum in quadrature of photometric uncertainty of each observation () and the uncertainty in the fit () where is the number of observations, is the photometric uncertainty, is the peak-to-peak amplitude, and is the number of uniformly spaced points (following Scowcroft et al., 2011). The value of ranges from five to twelve; five (e.g. V41) when our observations cover more than two periods and twelve when our observations cover one complete period (e.g. V5). Some light curves however were randomly sampled (e.g. V52, where the observations do not cover a full period), and the uncertainty in the fit is instead where N is the total number of observations. Table 2 gives the 3.6 and 4.5 µm IRAC mean magnitudes and amplitudes for the 37 RR Lyræ stars in the IRAC field.
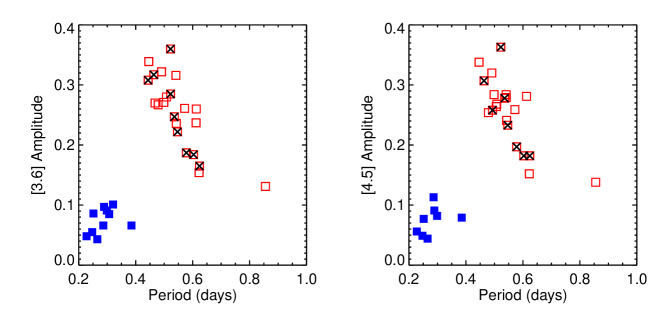
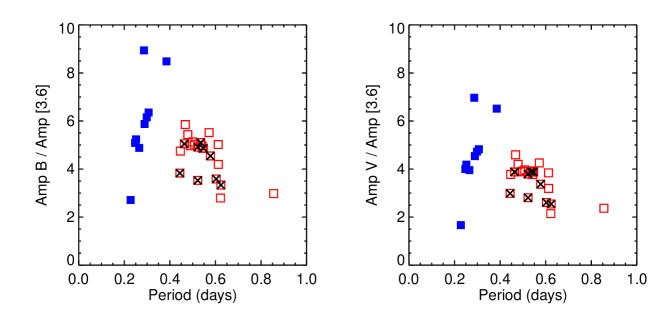
Figure 6 shows the luminosity amplitude vs. period (Bailey diagram) for all RR Lyræ stars: filled blue squares for FO and open red squares for FU pulsators. Black crosses indicate FU RR Lyræ stars identified in Stetson et al. (2014) as Blazhko variables (the Blazhko effect is characterized by a conspicuous modulation of amplitude and phase; Blažko 1907). Recent long-term monitoring of Blazhko RR Lyræ by the Kepler satellite has provided evidence of not only period-doubling (Szabó et al., 2010) but also the possible occurrence of additional periodicities on a time-scale longer than the typical Blazhko period (Kolenberg et al., 2011; Chadid et al., 2011). As expected the FO and FU RR Lyræ variables are well separated in both period and amplitude, and the amplitude of the FU pulsators show a clear trend of decreasing with period. Figure 7 shows instead the amplitude ratio between optical bands and the IRAC 3.6 µm band. The amplitude ratio plot can be used as a diagnostic for blends of stars with different color temperature. Two FO RR Lyræ stars (V40 and C1) show an unusually high optical to MIR ratio, possibly indicative of the presence of a faint optically-bright (hot) companion or blend. Another FO RR Lyræ (V49) shows instead an unusually low amplitude ratio, possibly the consequence of having an infrared-bright (cool) companion (or blend). It is also interesting to note that several (four out of seven at 3.6 µm and four out of six at 4.5 µm) of the FU RR Lyræ stars that lie below the general amplitude ratio trend are Blazhko variables, possibly due to these stars being observed at different phases in their amplitude modulation cycle (the optical and MIR data were not acquired simultaneously). If this is the case, the remaining FU RR Lyræ stars in the same amplitude ratio group (V5, V3, and V52) could also be Blazhko stars that were missed by the period studies (or they could be stars with a faint cool companion or blend).
4. Mid-IR Period-Luminosity and Period-Color Relationships
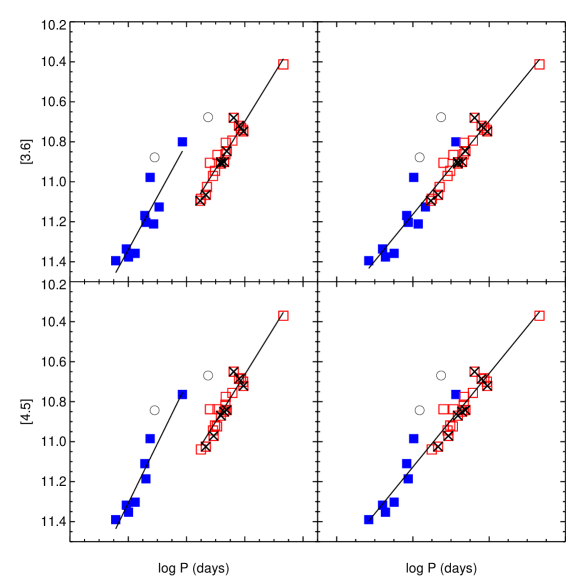
The left panels of Figure 8 show the IRAC PL relation for FO (filled blue squares) and FU (open red squares) RR Lyræ stars in M4. Blazhko variables are indicated by black crosses. The statistical uncertainties of the mean magnitudes are smaller than the size of the plotted symbols, and are not shown. Residuals from the PL relation were used as a diagnostic for blended variables. The central regions of M4 are not particularly dense, and no clear cutoff in radial distance from the center was apparent. Instead we employed a threshold in sigma to identify candidate blends. Two stars, V20 and V21, in the central regions of the cluster fall outside the threshold. The variable V20 was over above the fitted PL relation, and as shown in Figure 4, has a very poor quality light curve. The average magnitude of V21 was more than above the fitted relation. These stars were not included in the final fit of the PL relations, and are shown in Figure 8 as open circles.
All average magnitudes are corrected for extinction; albeit MIR extinction corrections are small compared to optical wavelengths, they still can not be ignored given the high photometric accuracy provided by IRAC. We used the total-to-selective extinctions of and from Monson et al. (2012) and a color excess of from Hendricks et al. (2012). This results in extinction corrections of and mag at 3.6 and 4.5 µm, respectively.
We calculated the zero point and slope (with their uncertainties and the best fit standard deviation) for the PL relation using an unweighted least squares fit. An unweighted fit is preferred to avoid biasing by brighter longer period variables, which tend to have smaller photometric uncertainties. The PL relations take the form
| (1) | |||
| (2) |
where and are representative of the mean period of the FO and FU variables respectively. The scatter between the FO and FU PL relations is comparable. Due to the small number of FO variables, we also derived the global PL relations for all RR Lyræ stars (Figure 8, right), having fundamentalized the periods of the FO variables using the relation (Iben & Huchra, 1971; Rood, 1973; Cox et al., 1983). The fundamentalized PL relation takes the form
| (3) |
where is representative of the mean fundamentalized period of all RR Lyræ stars in our sample. The zero point , slope , their errors, and the standard deviations for all PL relations are given in Table 3. Note how the secondary modulation of the candidate Blazhko variables seem to have no measurable effect on their average magnitudes, as they fit well on the PL relation.
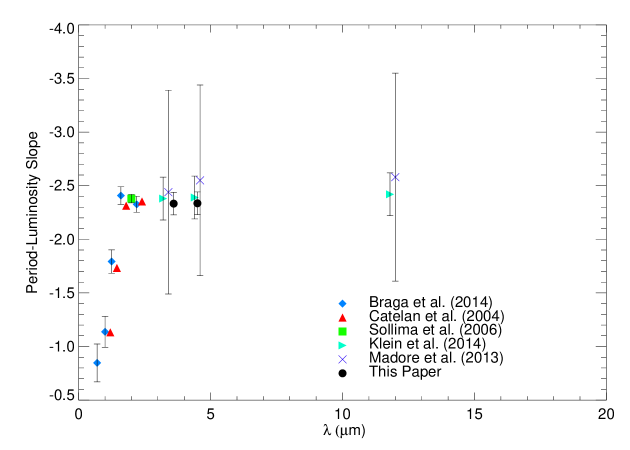
Figure 4 in Madore et al. (2013) showed that, using available data, the slope of the RR Lyræ PL relation is a monotonically increasing function of wavelength, and asymptotically approaches a wavelength-independent slope. In Figure 9, we recreate this plot by adding the optical and near-infrared slopes from Braga et al. (2015), the IRAC MIR slopes calculated above, and the results from Klein et al. (2014). Our data is consistent with the values found by Madore et al. (2013) and Klein et al. (2014) for the WISE W1 and W2 bands, and confirm with a high level of accuracy that the slope approaches the value of at infrared wavelengths, as predicted by the period-radius relation in Burki & Meylan (1986).
4.1. Period-Color Relationship
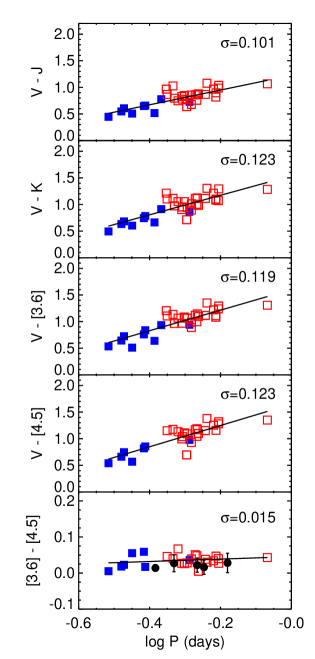
Figure 10 shows optical and infrared period-color (PC) relations for all M4 RR Lyræ variables observed with IRAC (as before, filled blue and open red squares indicate fundamentalized FO and FU). We fit the data with an unweighted least squares procedure; the best fit parameters are listed in Table 4. The figure clearly shows how the slope of the PC relation becomes more shallow as the distance between the two passbands decreases, as expected if the color is a temperature effect related to the radius of the pulsator. The PC relation, in particular, has been singled out for being the least affected by temperature uncertainties when deriving RR Lyræ distances with the Baade-Wesselink method (Carney et al., 1992; Cacciari et al., 2000; McNamara & Barnes, 2014), as opposed to using the standard color. Our figure shows that PC relationships using MIR colors (and the IRAC 3.6 µm magnitude in particular) are even more advantageous, thanks to the steeper slope (i.e. for the relation vs. in the fit) and slightly smaller dispersion around the best fit relation.
The last panel in Figure 10 shows the IRAC PC relation. In this case the slope is very shallow (), consistent with zero within . The scatter around the best fit PC relation is also quite large (0.017 mag), three times larger than the uncertainty in the average magnitudes of individual stars. The lack of a significant PC relation for RR Lyræ stars suggests that these stars do not develop variable CO molecular absorption in their atmosphere, which is observed in other pulsating stars in the same instability strip (e.g. classical Cepheids). Scowcroft et al. (2011) found a well defined PC relation for Large Magellanic Cloud Cepheids with . The negative slope of the PC relation and blue colors of these stars is explained by the dissociation and recombination of CO molecules in the IRAC 4.5 µm band, as previously noted by Marengo et al. (2010). This effect is particularly strong in Cepheids with days, and is reflected in a precise phasing of the light and color curve of these stars. Shorter period Cepheids are instead characterized by a flat color curve and red colors. This is further supported by Monson et al. (2012), which found that CO absorption drops off for temperatures greater than 6000 K. Given that these RR Lyræ stars have higher effective temperatures, earlier spectral types and lower metallicity than Cepheids, it is not surprising that we do not find strong CO effects in the PC relation and color curve. The PC relation appears to be flat, even when including Galactic RR Lyræ stars with very different metallicities. Therefore, RR Lyræ observations at 4.5 µm are not limited by strong metallicity effects as Cepheids are, and this band can be successfully used for distance scale measurements with similar accuracy as the 3.6 µm band. The weakness of the 4.5 µm CO band in RR Lyræ stars, however, prevents this feature from being used as metallicity indicator for this class of variables.
5. MIR PL Zero Point Calibration and M4 Distance Modulus
The CRRP project relies on establishing RR Lyræ variables as highly accurate indicators for the first rung of the cosmological distance scale, by using their MIR PL relation. The zero point of this relation, however, needs to be calibrated. Efforts in this direction have been made in the recent past by using Galactic RR Lyræ stars observed by WISE (Madore et al., 2013; Klein et al., 2014), but the accuracy of the calibration has been limited by the uncertainties in the photometry and distance of the calibrators. As mentioned in Section 1, the CRRP project addresses this issue with the observations of 43 Galactic RR Lyræ stars whose geometric parallax will be determined better than 2-3% with Gaia, and five bright RR Lyræ stars with parallax already determined by Benedict et al. (2011) using the Hubble Space Telescope (HST) Fine Guidance Sensor (FGS). Ground-based monitoring and spectral observations of the calibrators is ongoing, to ensure the characterization of their pulsation properties and, if required, to allow the calibration of the metallicity dependence of the PL relation.
The observation of a large sample of GGCs (themselves used as distance indicators) as part of the CRRP program provides a separate avenue to test the calibration of RR Lyræ stars and probe for metallicity effects. The distance of M4, in particular, has been the subject of intense analysis, most recently by Braga et al. (2015) by using a theoretical and empirical calibration of the RR Lyræ optical and NIR PL relation for the cluster. The distance modulus derived in this work can be used as an alternative calibration of the MIR PL zero point, as well as to test the effects of metallicity on the zero point derived from the five HST/FGS RR Lyræ calibrating stars. A similar approach will be followed for the remaining 30 GCCs in the CRRP program (spanning a wide range in metallicity), for which independent distance moduli will be derived in the optical, NIR and MIR from their population of RR Lyræ stars.
5.1. Zero Point Calibration Using HST RR Lyræ Stars
As mentioned above, at present there are only five RR Lyræ variables with available geometric parallax, i.e. the aforementioned stars observed with HST/FGS by Benedict et al. (2011): RR Lyr, UV Oct, SU Dra XZ Cyg (FU pulsators) and RZ Cep (FO). The four FU pulsators are the same stars used by Madore et al. (2013) to calibrate the RR Lyræ PL relation in the WISE bands. Even for these stars, however, the uncertainty in their distance modulus is still large (up to 0.25 mag), significantly reducing their effectiveness as calibrators for the distance scale. All five stars have been observed as part of the CRRP program in order to reproduce the Madore et al. (2013) zero point calibration using the IRAC 3.6 and 4.5 µm bandpasses, and with better phase sampling and much smaller ( better S/N ratio) photometric error. Their basic properties (derived from Benedict et al. 2011) are listed in Table 5: their periods range from 0.3086 to 0.6642 days, and their [Fe/H] ranges from to , significantly more metal-poor than M4 itself. A detailed analysis of the calibration of the zero point using these five RR Lyræ stars at multi–wavelengths will be presented in a forthcoming paper.
The mean magnitude of each star was computed as explained in Section 3. Each calibrator was then corrected for extinction, adopting the reddening from Benedict et al. (2011). The extinction corrections were computed using the same and relations as in Section 3. The absolute mean magnitudes, as well as the parallax, LKH correction (Lutz & Kelker, 1973; Hanson, 1979), distance moduli, extinction corrections, and apparent mean magnitudes are given in Table 5. Benedict et al. (2011) contains two conflicting results about the parallax to RZ Cep and although the value of 2.12 mas is their preferred solution (Benedict, private communication), we chose to adopt the 2.54 mas solution with an of 1 (assuming a mean spectral type of A5 (Preston, 1959) and ) which appears to be more consistent with the new photometric data. The dominating factor in the uncertainty of the absolute mean magnitudes is the uncertainty in their distances.
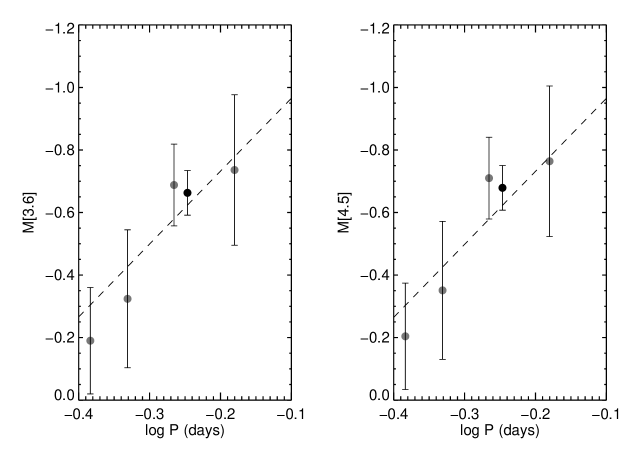
Based on theoretical NIR PL-metallicity (PLZ) relations, the slope of the RR Lyræ PL relation is expected to be only weakly dependent on metallicity (Braga et al., 2015). Therefore, for this work we elected to adopt the well constrained slope of the fundamentalized PL relation derived in Section 4, rather than relying on just five Galactic calibrators (having a smaller range in period than the M4 RR Lyræ stars) to simultaneously fit both slope and zero point. Figure 11 shows the resulting PL relation, derived after fundamentalizing the period of RZ Cep. The calibrated PL relations derived using a one parameter fit are given by
| (4) | |||
| (5) | |||
where the uncertainty in the zero point is calculated by and are the uncertainties of the absolute magnitudes for the five calibrator stars used in the fit. The largest factor in the uncertainty of the zero point derived above is due to the uncertainty in the distance modulus of the calibrators, but it is a factor of 3 better than the value obtained in Madore et al. (2013) where both the slope and zero point were fit simultaneously and only four stars were used. In both IRAC bands, the slope we obtain is marginally shallower (but still consistent, within the error) than the values published by Klein et al. (2014) and Madore et al. (2013) for the WISE W1 and W2 bands. Further improvements in the uncertainty of the zero point will be possible when more accurate parallaxes for all our calibrator RR Lyræ stars are obtained with the Gaia mission.
5.2. M4 Distance Modulus
From the zero point calibration of the MIR RR Lyræ PL relation in the previous section, we can derive the true distance modulus of M4:
| (6) | |||
| (7) | |||
where we have adopted the M4 PL relation using the fundamentalized period of FO pulsators. The error on the distance modulus comes from four sources. The statistical error is the uncertainty in the zero point of the cluster PL relation, and is derived from the least squares fit to the IRAC data. The systematic error is the uncertainty in the calibrated PL zero point, given in the previous section. The calibration error is the dispersion in our photometric zero point calibration to standard IRAC Vega magnitudes, described in Section 2. The extinction error is the derived from the uncertainty due to differential reddening given in Section 4.
The distance modulus we find is slightly larger than expected, based on previous works ( in Kaluzny et al. 2013, in Hendricks et al. 2012, and in Braga et al. 2015, this last value derived using RR Lyr itself as zero point calibrator), but agree within . If we exclude the systematic error, which will be significantly reduced once high accuracy geometric parallaxes for a large sample of calibrators will become available from Gaia, we have an overall uncertainty better than 0.5% in each band. The average distance modulus of the two wavelengths then is:
| (8) | |||
where the statistical error is reduced by a factor of (since by using both bands we take advantage of twice the number of available datapoints). Note that in this case the overall error is reduced to 1%, small enough to allow the study of higher order parameters in the RR Lyræ PL relation, first of all the possible dependence on metallicity, once data from more clusters is analyzed.
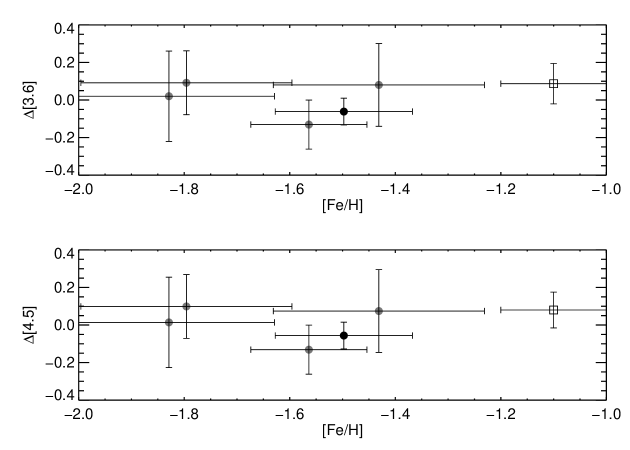
Based on the models presented in Braga et al. (2015), while the dependence of the PL slope from metallicity is weak, we do expect a larger effect of [Fe/H] on the PL relation zero point. Therefore calibrating the PL relation with Galactic RR Lyræ stars, all with different metallicities, may induce a significant error. Figure 12 addresses this issue, by plotting the residual between the absolute mean magnitude of each calibrator and the value predicted by the PL relation, as a function of their metallicity. The metallicities used in the plot are listed in Table 5, and are the same listed in Benedict et al. (2011) (see references therein for the original source of the metallicity measurement), converted from the original (Zinn & West, 1984) metallicity scale to the more recent Carretta et al. (2009) scale. For RR Lyr and UV Oct an extra step was necessary to correct for the different solar abundances used by Kolenberg et al. (2010) when measuring the metallicity of these two stars, with respect to the Carretta et al. (2009). Figure 12 also plots the difference between the M4 distance modulus calculated above for M4, and the value of derived by Braga et al. (2015) from NIR PL relations calibrated using RR Lyr. Due to the large uncertainties in absolute magnitude and metallicity of the Galactic RR Lyræ stars, no trend is apparent (slope of -0.20.3 mag/dex).
If we adopt the M4 distance modulus value of derived by Braga et al. (2015) from NIR data and theoretical PLZ relationships for RR Lyræ stars (to avoid the large uncertainty in the calibrator distance that is affecting the zero point calibration), we obtain the following calibrated RR Lyræ PL relations for the two IRAC bands:
| (9) | |||
| (10) |
An in-depth study of the MIR RR Lyræ PL relations based on theoretical models calculated for the IRAC bands will be presented in a forthcoming paper.
6. Conclusions
We have presented new RR Lyræ MIR PL relations for the nearby globular cluster M4. Accurate IRAC photometry allows us to reduce the error in the PL slope by a factor of at least two from previous works. We have also demonstrated that PL relations in the IRAC bands are consistent with previous calibrations using WISE photometry.
We also presented optical and infrared PC relations. The steeper slope and smaller dispersion of the relation suggests that it could be preferred over for use in the Baade-Wesselink method. Unlike for Cepheid variables, the relation is very shallow, indicating that there is no CO absorption, and therefore little metallicity effect, in the 4.5 µm band. As a result, the 4.5 µm band can be used as a distance indicator.
We calibrated the zero point of the MIR PL relations with five Galactic RR Lyræ stars with known distances. The uncertainty in their distances is the largest source of error, and we will be able to provide a much more precise calibration using upcoming results from the Gaia mission. Due to the uncertainty of the available distances to Galactic RR Lyræ stars and the influence of metallicity in the PL relation, we provided a separate PL relation, where the zero point is calibrated using a distance modulus to M4 based on theoretical NIR PLZ relations. Future work will include analysis the remaining GCCs in the CRRP program in order to provide a comprehensive calibration of the RR Lyræ PL relation. This calibration can then be compared to other distance indicators, such as Type II Cepheids and Delta Scuti variables.
References
- Baade (1944) Baade, W. 1944, ApJ, 100, 137
- Baade (1957) Baade, W. 1957, Obs., 77, 165
- Benedict et al. (2011) Benedict, G. F., McArthur, B. E., Feast, M. W., et al. 2011, AJ, 142, 187
- Blažko (1907) Blažko, S. 1907, Astronomische Nachrichten, 175, 327
- Bono et al. (1997) Bono, G., Caputo, F., Cassisi, S., Incerpi, R., Marconi, M. 1997, ApJ, 483, 811
- Bono et al. (2001) Bono, G., Caputo, F., Castellani, V., Marconi, M., Storm J. 2001, MNRAS, 326, 1183
- Bono et al. (2003) Bono, G., Caputo, F., Castellani, et al. 2003, MNRAS, 344, 1097
- Bono et al. (2010) Bono, G., Stetson, P.B., VandenBerg, D.A., et al. 2010, ApJ, 708, L74
- Braga et al. (2015) Braga, V. F., Dall’Ora, M., Bono, G., et al. 2015, ApJ, in press (arXiv:1411.6826)
- Buonanno et al. (1998) Buonanno R., Corsi C.E., Pulone, L., Fusi Pecci F., Bellazzini, M. 1998, A&A, 333, 505
- Burki & Meylan (1986) Burki, G. & Meylan, G. 1986, A&A,159, 261
- Cacciari & Clementini (2003) Cacciari, C., Clementini, G. 2003, in “Stellar Candles for the Extragalactic Distance Scale”, Lecture Notes in Physics, eds. D. Alloin and W. Gieren, (Springer Verlag, Berlin), 635, 105
- Cacciari et al. (2000) Cacciari, C., Clementini, G., Castelli, F., & Melandri, F. 2000, IAU Colloq. 176: The Impact of Large-Scale Surveys on Pulsating Star Research, 203, 176
- Caputo et al. (1983) Caputo, F., Cayrel, R., Cayrel de Strobel, G. 1983, A&A, 123, 135
- Carney et al. (1992) Carney, B. W., Storm, J., & Jones, R. V. 1992, ApJ, 386, 663
- Carretta et al. (2009) Carretta, E., Bragaglia, A., Gratton, R., D’Orazi, V., & Lucatello, S. 2009, A&A, 508, 695
- Castor (1971) Castor, J.I. 1971, ApJ, 166, 109
- Catelan et al. (2004) Catelan, M., Pritzl, B. J., & Smith, H. A. 2004, ApJS, 154, 633
- Chaboyer et al. (1996) Chaboyer, B., Demarque, P., Sarajedini, A. 1996, ApJ, 459, 558
- Chadid et al. (2011) Chadid, M., Perini, C., Bono, G., et al. 2011, A&A, 527, A146
- Christy (1966) Christy, R.F. 1966, ApJ, 144, 108
- Cox (1963) Cox, J.P. 1963, ApJ, 138, 487
- Cox et al. (1983) Cox, A.N., Hodson, S.W., Clancy, S.P. 1983, ApJ, 266, 94
- Dambis et al. (2013) Dambis, A.K., Berdnikov, L.N., Kniazev, A.Y., et al. 2013, MNRAS, 435, 3206
- Fazio et al. (2004) Fazio, G. G., Hora, J. L., Allen, L. E., et al. 2004, ApJS, 154, 10
- Fiorentino et al. (2012) Fiorentino, G., Stetson, P.B., Monelli, M. et al. 2012, ApJ, 759, L12
- Hanson (1979) Hanson, R. B. 1979 MNRAS, 186, 875
- Harris (1996) Harris, W. E. 1996, AJ, 112, 1487
- Hendricks et al. (2012) Hendricks, B., Stetson, P. B., VandenBerg, D. A., & Dall’Ora, M. 2012, AJ, 144, 25
- Hesser (1991) Hesser, J. E. 1991, Frontiers of Stellar Evolution, 20, 185
- Hora et al. (2012) Hora, J. L., Marengo, M., Park, R., et al. 2012, Proc. SPIE, 8442, 39
- Iben & Huchra (1971) Iben, I.Jr., Huchra, J. 1971 å, 14, 293
- Kaluzny et al. (2013) Kaluzny, J., Thompson, I. B., Rozyczka, M., et al. 2013, AJ, 145, 43
- Klein et al. (2014) Klein, C. R., Richards, J. W., Butler, N. R., & Bloom, J. S. 2014, MNRAS, 440, L96
- Kolenberg et al. (2011) Kolenberg, K., Bryson, S., Szabó, R., et al., 2011, MNRAS, 411, 878
- Kolenberg et al. (2010) Kolenberg, K., Fossati, L., Shulyak, D., et al. 2010, A&A, 519, AA64
- Kollmeier et al. (2013) Kollmeier, J.A., Szczygiel, D. M., Burns, C.R., et al. 2013, ApJ, 775, 57
- Kunder et al. (2013) Kunder, A., Stetson, P.B., Cassisi, S., et al. 2013, AJ, 146, 119
- Longmore et al. (1986) Longmore, A.J., Fernley, J.A. Jameson, R.F. 1986, MNRAS, 220, 279
- Lutz & Kelker (1973) Lutz, T. E. & Kelker, D. H. 1973, PASP, 85, 573
- Madore et al. (2013) Madore, B. F., Hoffman, D., Freedman, W. L., et al. 2013, AJ, 117, 135
- Majaess (2010) Majaess, D. J., 2010, J. Am. Assoc. Var. Star Obs., 38, 100
- Makovoz et al. (2005) Makovoz, D., & Khan, I. 2005, in Astronomical Society of the Pacific Conference Series, Vol. 347, Astronomical Data Analysis Software and Systems XIV, ed. P. L. Shopbell, M. C. Britton, R. Ebert (San Francisco:ASP), 81
- Marconi et al. (2015) Marconi, M., et al. 2015, ApJ, submitted
- Marengo et al. (2010) Marengo, M., Evans, N. R., Barmby, P., et al. 2010, ApJ, 709, 120
- Marín-Franch et al. (2009) Marín-Franch, A., Aparicio, A., Piotto, G., et al. 2009, ApJ, 694, 1498
- McNamara & Barnes (2014) McNamara, D. H., & Barnes, J. 2014, AJ, 147, 31
- Monson et al. (2012) Monson, A. J., Freedman, W. L., Madore, B. F., et al. 2012, ApJ, 759, 146
- Oosterhoff (1939) Oosterhoff, P.T. 1939, Obs., 62, 104
- Persson et al. (2004) Persson, S. E., Madore, B. F., Krzemiński, W., et al. 2004, AJ, 128, 2239
- Plaut (1968) Plaut, L. 1968, Bulletin of the Astronomical Institutes of the Netherlands Supplement Series, 2, 293
- Preston (1959) Preston, G. W. 1959, ApJ, 160, 507
- Rood (1973) Rood, R.T. 1973, AJ, 184, 815
- Sandage (1993) Sandage, A. 1993, AJ, 106, 687
- Sandquist (2010) Sandquist, E.L. 2010, MNRAS, 313, 571
- Schuster et al. (2006) Schuster, M. T., Marengo, M., & Patten, B. M. 2006, SPIE, 6270, 65
- Scowcroft et al. (2011) Scowcroft, V., Freedman, W. L., Madore, B. F., et al. 2011, ApJ, 743, 76
- Sollima et al. (2006) Sollima, A., Cacciari, C., & Valenti, E. 2006, MNRAS, 372, 1675
- Soszynski et al. (2003) Soszynski, I., Udalski, A., Szymanski, M., et al., 2003, Acta Astron., 53, 93
- Stetson (1987) Stetson, P. B. 1987, PASP, 99, 191
- Stetson (1994) Stetson, P. B. 1994, PASP, 106, 250
- Stetson (1996) Stetson, P. B. 1996, PASP, 108, 851
- Stetson et al. (2014) Stetson, P. B., Braga, V. F., Dall’Ora, M., et al. 2014, PASP, 126, 52
- Szabó et al. (2010) Szabó, R., Kolláth, Z., Molnár, L., et al., 2010, MNRAS, 409, 1244
- Van den Bergh (1999) Van den Bergh, S. 1999, A&A Rev., 9, 273
- VandenBerg et al. (2013) VandenBerg, D.A., Brogaard, K., Leaman, R., Casagrande, L. 2013, ApJ, 775, 134
- van Albada & Baker (1973) van Albada, T.S., Baker, N. 1973, ApJ, 185, 477
- Welch & Stetson (1993) Welch, D. L. & Stetson, P. B. 1993, AJ, 105, 1813
- Werner et al. (2004) Werner, M. W., Roellig, T. L., Low, F. J., et al. 2004, ApJS, 154, 1
- Zinn & West (1984) Zinn, R., & West, M. J. 1984, ApJS, 55, 45
| MJDaaMJD = JD - 2400000.5 days | [3.6] mag | MJDaaMJD = JD - 2400000.5 days | [4.5] mag | ||
|---|---|---|---|---|---|
| 56446.223 | 11.354 | 0.030 | 56446.227 | 11.267 | 0.079 |
| 56446.285 | 11.376 | 0.010 | 56446.293 | 11.317 | 0.050 |
| 56446.336 | 11.394 | 0.003 | 56446.340 | 11.318 | 0.051 |
| 56446.391 | 11.329 | 0.011 | 56446.398 | 11.261 | 0.074 |
| 56446.438 | 11.302 | 0.012 | 56446.441 | 11.224 | 0.089 |
| 56446.492 | 11.312 | 0.021 | 56446.496 | 11.248 | 0.076 |
| 56446.543 | 11.358 | 0.016 | 56446.547 | 11.285 | 0.069 |
| 56446.598 | 11.385 | 0.035 | 56446.602 | 11.312 | 0.075 |
| 56446.652 | 11.344 | 0.021 | 56446.656 | 11.268 | 0.078 |
| 56446.699 | 11.309 | 0.015 | 56446.703 | 11.240 | 0.063 |
| 56446.746 | 11.295 | 0.029 | 56446.750 | 11.233 | 0.077 |
| 56446.797 | 11.340 | 0.023 | 56446.805 | 11.278 | 0.080 |
Note. — Table 1 is published in its entirety in the electronic edition. A portion is shown here for guidance regarding its form and content.
| IDaaThe ID given in Clement’s catalog, with the exception of C1, newly named in Stetson et al. (2014) | (J2000.0) | Period (days) | [3.6] mag | [4.5] mag | Amp[3.6] | Amp[4.5] | ModebbThe pulsation mode (RRab=FU, RRc=FO). Candidate Blazhko stars are indicated by an asterisk. | |
|---|---|---|---|---|---|---|---|---|
| (J2000.0) | ||||||||
| V1 | 16 23 13.67 | 0.28888261 | -0.5392786 | ccThe uncertainty is derived using the repeatability parameter given in DAOPHOT. | RRc | |||
| -26 30 53.6 | ||||||||
| V2 | 16 23 16.30 | 0.5356819 | -0.271093 | ccThe uncertainty is derived using the repeatability parameter given in DAOPHOT. | RRab* | |||
| -26 34 46.6 | ||||||||
| V3 | 16 23 19.47 | 0.50667787 | -0.2952681 | RRab | ||||
| -26 39 57.0 | ||||||||
| V5 | 16 23 21.03 | 0.62240112 | -0.2059296 | RRab | ||||
| -26 33 05.8 | ||||||||
| V6 | 16 23 25.79 | 0.3205151 | -0.4941515 | RRc | ||||
| -26 26 16.3 | ||||||||
| V7 | 16 23 25.95 | 0.49878722 | -0.3020847 | RRab | ||||
| -26 27 41.9 | ||||||||
| V8 | 16 23 26.16 | 0.50822359 | -0.2939452 | RRab | ||||
| -26 29 41.6 | ||||||||
| V9 | 16 23 26.80 | 0.57189447 | -0.2426841 | RRab | ||||
| -26 29 48.0 | ||||||||
| V10 | 16 23 29.21 | 0.49071753 | -0.3091684 | RRab | ||||
| -26 28 54.3 | ||||||||
| V11 | 16 23 29.98 | 0.49320868 | -0.3069693 | RRab* | ||||
| -26 36 24.5 | ||||||||
| V12 | 16 23 30.82 | 0.4461098 | -0.3505582 | RRab | ||||
| -26 34 58.9 | ||||||||
| V14 | 16 23 31.29 | 0.46353111 | -0.3339211 | RRab* | ||||
| -26 35 34.5 | ||||||||
| V15 | 16 23 31.96 | 0.44366077 | -0.352949 | RRab* | ||||
| -26 24 18.1 | ||||||||
| V16 | 16 23 32.50 | 0.54254824 | -0.2655616 | RRab | ||||
| -26 30 23.0 | ||||||||
| V18 | 16 23 34.70 | 0.47879201 | -0.3198531 | RRab | ||||
| -26 31 04.6 | ||||||||
| V19 | 16 23 35.05 | 0.46781108 | -0.3299295 | RRab | ||||
| -26 25 36.3 | ||||||||
| V20 | 16 23 35.39 | 0.30941948 | -0.5094523 | RRc | ||||
| -26 32 35.9 | ||||||||
| V21 | 16 23 35.93 | 0.47200742 | -0.3260512 | RRab | ||||
| -26 31 33.6 | ||||||||
| V22 | 16 23 36.95 | 0.60306358 | -0.2196369 | RRab* | ||||
| -26 30 13.0 | ||||||||
| V23 | 16 23 37.33 | 0.29861557 | -0.5248876 | RRc | ||||
| -26 31 56.1 | ||||||||
| V24 | 16 23 38.04 | 0.54678333 | -0.2621847 | RRab* | ||||
| -26 30 41.8 | ||||||||
| V25 | 16 23 39.42 | 0.61273479 | -0.2127275 | RRab | ||||
| -26 30 21.3 | ||||||||
| V26 | 16 23 41.65 | 0.54121739 | -0.2666283 | RRab | ||||
| -26 32 41.1 | ||||||||
| V27 | 16 23 43.17 | 0.61201829 | -0.2132356 | RRab | ||||
| -26 27 16.3 | ||||||||
| V28 | 16 23 53.60 | 0.52234107 | -0.2820458 | RRab* | ||||
| -26 30 5.30 | ||||||||
| V29 | 16 23 58.25 | 0.52248466 | -0.2819265 | ccThe uncertainty is derived using the repeatability parameter given in DAOPHOT. | RRab* | |||
| -26 21 35.1 | ||||||||
| V36 | 16 23 19.45 | 0.54130918 | -0.2665546 | RRab | ||||
| -26 35 49.0 | ||||||||
| V37 | 16 23 31.60 | 0.24734353 | -0.6066994 | RRc | ||||
| -26 31 30.6 | ||||||||
| V38 | 16 23 32.87 | 0.57784635 | -0.2381876 | RRab* | ||||
| -26 33 03.5 | ||||||||
| V39 | 16 23 34.67 | 0.623954 | -0.2048474 | RRab* | ||||
| -26 32 52.1 | ||||||||
| V40 | 16 23 34.59 | 0.38533005 | -0.4141671 | RRc | ||||
| -26 30 44.2 | ||||||||
| V41 | 16 23 39.50 | 0.2517418 | -0.5990447 | RRc | ||||
| -26 33 59.8 | ||||||||
| V42 | 16 24 02.00 | 0.3068549 | -0.5130669 | ccThe uncertainty is derived using the repeatability parameter given in DAOPHOT. | RRc | |||
| -26 22 13.0 | ||||||||
| V49 | 16 23 45.25 | 0.22754331 | -0.6429359 | RRc | ||||
| -26 31 28.4 | ||||||||
| V52 | 16 23 24.06 | 0.85549784 | -0.0677811 | RRab | ||||
| -26 30 27.8 | ||||||||
| V61 | 16 23 29.76 | 0.26528645 | -0.5762849 | RRc | ||||
| -26 29 50.3 | ||||||||
| C1 | 16 23 36.43 | 0.2862573 | -0.5432434 | RRc | ||||
| -26 30 42.8 |
| Band | aaaPL parameters of the form | baaPL parameters of the form | abbPL parameters of the form | bbbPL parameters of the form | accPL parameters of the form | bccPL parameters of the form | |||
|---|---|---|---|---|---|---|---|---|---|
| FO | FU | FU+FO | |||||||
| 11.207 | -2.658 | 0.079 | 10.841 | -2.370 | 0.040 | 10.929 | -2.332 | 0.056 | |
| 11.159 | -2.979 | 0.057 | 10.806 | -2.355 | 0.045 | 10.893 | -2.336 | 0.054 | |
| Color | aaaPC parameters of the form | baaPC parameters of the form | |
|---|---|---|---|
| V - J | 0.102 | ||
| V - K | 0.123 | ||
| V - [3.6] | 0.117 | ||
| V - [4.5] | 0.121 | ||
| 0.017 |
| RZ Cep | XZ Cyg | UV Oct | RR Lyr | SU Dra | |
|---|---|---|---|---|---|
| Period | 0.308645 | 0.466579 | 0.542600263 | 0.566805 | 0.660419 |
| 0.252 | 0.100 | 0.090 | 0.042 | 0.010 | |
| 0.051 | 0.020 | 0.018 | 0.009 | 0.002 | |
| 0.039 | 0.016 | 0.014 | 0.007 | 0.002 | |
| Parallax (mas) | aaBenedict et al. (2011) provides two different parallax values for this star. We adopted the value given in their Section 4.3.2, rather than the number listed in their Table 8, which appears to be inconsistent with the PL relation. | ||||
| LKH correction | -0.05 | -0.09 | -0.03 | -0.02 | -0.11 |
| bbOur distance moduli are slightly different than the values in Table 8 of Benedict et al. (2011) due to typographical errors in that paper. | |||||