Imaging the cold molecular gas in SDSS J at
Abstract
We present Karl G. Jansky Very Large Array (VLA) observations of the CO () line emission towards the quasar SDSS J (J). The molecular gas is found to be marginally resolved with a major axis of (consistent with previous size measurements of the CO () emission). We observe tentative evidence for extended line emission towards the south west on a scale of , but this is only detected at significance and should be confirmed. The position of the molecular emission region is in excellent agreement with previous detections of low frequency radio continuum emission as well as [C ii] line and thermal dust continuum emission. These CO () observations provide an anchor for the low excitation part of the molecular line SED. We find no evidence for extended low excitation component, neither in the spectral line energy distribution nor the image. We fit a single kinetic gas temperature model of 50 K. We revisit the gas and dynamical masses in light of this new detection of a low order transition of CO, and confirm previous findings that there is no extended reservoir of cold molecular gas in J, and that the source departs substantially from the low relationship between black hole mass and bulge mass. Hence, the characteristics of J at are very similar to quasars, in the lack of a diffuse cold gas reservoir and kpc-size compactness of the star forming region.
keywords:
galaxies: active – galaxies: formation – galaxies: high-redshift – galaxies: individual: SDSS J – cosmology: observations – radio lines: galaxies1 Introduction
Studies of molecular lines towards high redshift galaxies provide powerful diagnostics on the properties of the dense interstellar medium (ISM) in the early Universe. As cool gas is the fuel for star formation, such studies are probes of galaxy formation and evolution and help us to understand the origins of today’s galaxies (for a recent review, see Carilli & Walter, 2013).
At , SDSS J (hereafter J) is the most distant quasar discovered in the Sloan Digital Sky Survey (SDSS, Fan et al., 2003), and remains among the most distant known. It is a radio quiet quasar (Carilli et al., 2004; Petric et al., 2003) with an estimated supermassive black hole mass of accreting at the Eddington limit, as found from Mg ii emission lines (Willott, McLure & Jarvis, 2003). Optical spectra of the source show a saturated Gunn–Peterson trough due to a partially neutral intergalactic medium, providing some of the first evidence from the earliest epochs of galaxy formation and cosmic reionization at (White et al., 2005). J was the first quasar to be detected as a hyperluminous infrared galaxy (HyLIRG) (infrared luminosity L☉, Bertoldi et al., 2003a) through millimetre bolometer observations. It also remains the most distant detection of molecular gas to date, with multiple detections of CO rotational transition lines from up to (Walter et al., 2003; Bertoldi et al., 2003b; Riechers et al., 2009) and the possible detection of the CO () transition (Gallerani et al., 2014). These revealed a massive molecular gas reservoir of (Bertoldi et al., 2003b; Walter et al., 2003; Carilli et al., 2007) centred on the active galactic nucleus (AGN) and extended on scales of 5 kpc (Walter et al., 2004; Riechers et al., 2009).
[C ii] observations trace a bright kpc atomic gas region with active star formation apparently taking place at an estimated star-formation rate (SFR) surface density of yr-1 kpc-2 (Walter et al., 2009). Based on [C ii], Cicone et al. (2015) suggest the presence of a high velocity complex outflow extending to projected radii of kpc. J has a far-infrared (FIR) luminosity of (Leipski et al., 2013), corresponding to thermal emission from of warm dust (Beelen et al., 2006).
J has served as the archetype for extreme starburst-AGN at high redshifts, representing the early, coeval formation of supermassive black holes and their stellar host galaxies during the epoch of reionization.
In this paper, we present observations with the Karl G. Jansky Very Large Array (VLA) of the CO () line emission in J1148+5251. These observations have a number of significant advantages over the previous VLA observations. Low order CO transitions are critical to constrain the total molecular gas mass in galaxies, and in particular, to look for massive reservoirs of cold gas fuelling star formation (Riechers et al., 2006, 2011a, 2011b; Ivison et al., 2011). The lowest previously detected transition from J was CO () (Walter et al., 2003), with rather shallow limits on the CO () line emission (Bertoldi et al., 2003b). CO () can be substantially sub-thermally excited, even in starburst galaxies, with a typical brightness temperature ratio of 0.66 for submillimetre galaxies (SMGs), and 0.6 for high main sequence galaxies (Carilli & Walter, 2013). Conversely, the CO () to CO () ratio is almost always thermal (i.e. the brightness temperature is constant due to thermalized emission), even in high- main sequence galaxies, with ratios of 0.85 in SMGs and 0.9 even in high main sequence galaxies. Hence, CO () provides an excellent route to study cool gas reservoirs, being four times stronger (in erg s-1 Hz-1) than CO (), but still tracing the colder gas (Daddi et al., 2014).
We use the capabilities of the VLA to image the full emission line from J. The previous CO () observations used the old VLA correlator, which had limited bandwidth and channelization, leading to an observation that missed the line wings beyond km s-1, and had only 12 channels across the centre of the line.
And lastly, we obtain sensitive observations of the continuum emission at a rest frame frequency of 230 GHz, corresponding to an emission regime that would be dominated by the cold dust.
We adopt a standard CDM cosmological model with km s-1 Mpc-1, , (Planck Collaboration et al., 2014). At a redshift of , this implies an age of the universe of 851 Myr and a scale of kpc arcsec-1.
2 Observations
We use the VLA in C and D configurations to observe the CO () ( GHz) emission line towards J11485251. The line is redshifted to GHz at . Observations in the D configuration were performed between November 2011 and January 2012 for a total of hours on source. Observations in the C configuration followed between January and April 2012 for a total of hours on source. Since these observations were taken as JVLA early science during the initial commissioning of the new correlator, we chose to observe topocentric frequencies. Furthermore, the observations span a six month range that involved major changes to the correlator between C and D configurations. Hence, we did not attempt to doppler track, but have summed the topocentric spectra. This leads to at most a km s-1 smearing of spectral features, which is comparable to a single channel in our final analysis. This smearing will have no effect on our subsequent analysis.
The standard calibrator 3C286 was used as a primary flux and bandpass calibrator and the nearby source J11534931 was observed approximately every five and a half minutes for pointing, secondary amplitude and phase calibration.
These observations were taken during the commissioning phase of the VLA correlator, and hence correlator capabilities were evolving rapidly. The D array observations were obtained when full channelization (64 channels) was available, but only for a 128 MHz bandwidth. This bandwidth is easily adequate to cover any reasonable line emission ( km s-1), but does not allow for a sensitive continuum measurement. The later C array observations had the same line coverage, but also had close to 1 GHz of bandwidth off-line, providing a sensitive continuum observation.
The data were calibrated, imaged and analysed using standard techniques in NRAO’s CASA package111The Common Astronomy Software Applications package, http://casa.nrao.edu (McMullin et al., 2007). Some difficulties were encountered due to the presence of two bright sources near the half power position of the primary beam. Small inherent pointing inaccuracies resulted in these sources appearing as time-variant leading to significant residual sidelobes even after deconvolution. To solve this issue we performed continuum subtraction in the -plane using the outer most channels (4 to 9 and 57 to 62) of the 128 MHz band centred on the emission line (channels 23 to 43).
We imaged the C-array data separately using a close-to-‘natural’ weighting scheme characterized by a ‘robust’ parameter (Briggs, 1995) of 1. We then repeated the process for the D-array data only. We also created a combined data set from the C and D-array data and imaged it with different weightings to explore spatial resolution versus signal-to-noise optimization. A close-to-‘uniform’ weighting scheme (robust in CASA) was used to achieve higher spatial resolution, a close-to-‘natural’ robust was used to obtain higher sensitivity, and a good trade-off between resolution and sensitivity was achieved with a middle-ground robust . This way we produced maps with a large range in resolution, as shown in Table 1.
| Arrays | ‘robust’ | rms per channel | Restoring |
|---|---|---|---|
| used | parameter | (19.309 km s-1) | beam |
| C | 1 | 95 Jy beam-1 | |
| D | 1 | 68 Jy beam-1 | |
| C&D | 126 Jy beam-1 | ||
| C&D | 0 | 73 Jy beam-1 | |
| C&D | 1 | 56 Jy beam-1 |
3 Results
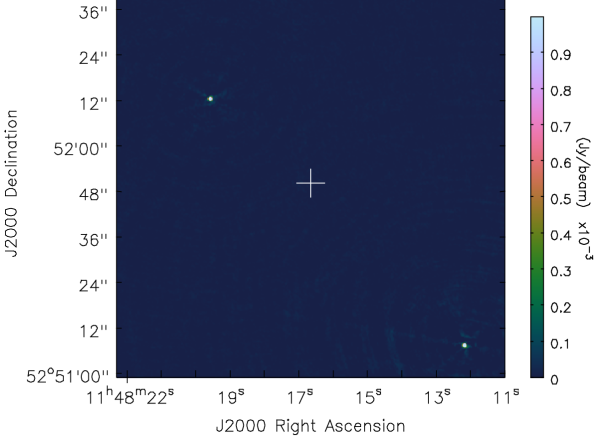
The field covered by these observations also includes two bright radio sources (Becker, White & Helfand, 1995), one to the NE of J and one to the south west, both at much lower redshift (Becker, White & Helfand, 1995). They have been mentioned in previous studies of J1148+5251 (e.g. Bertoldi et al., 2003a). Figure 1 is a continuum map of the C-array data only, showing these sources. We measure a non-primary beam corrected flux density of mJy for the north eastern source and of mJy for the south western. We perform -continuum subtraction to remove the effects of these sources from subsequent analysis.
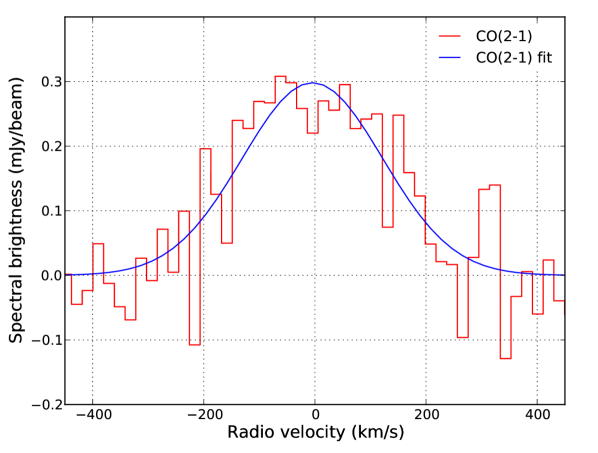
We clearly detect the CO () emission towards J. Figure 2, shows the CO () emission spectrum obtained from the D-array data. Fitting a Gaussian to the emission gives a peak intensity of mJy beam-1 and a FWHM of km s-1 centred on km s-1. This implies an integrated line flux of mJy beam-1 km s-1 and a line luminosity of K km s-1 pc2.
Constraining the source size in CO () emission is difficult because of the moderate signal-to-noise and non-ideal coverage, both due to a shorter-than-requested observation time on the full C-array. The combined C&D observations yield a synthesized beam with broad wings, depending on weighting. To further explore the issue of the CO () emission size, we carried out two tests.
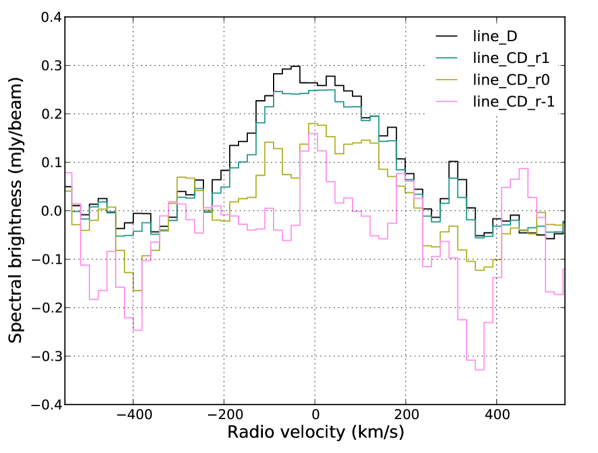
First, we looked at point-source line profiles at various resolutions. We considered the position of the peak emission from the D-array only map (derived from a Gaussian fit) as the position of the point source and took line profiles from the D-array only and C&D-array data imaged with three different weightings (robust , and ). These spectra are shown in Fig. 3. Moving from a close-to-‘natural’ (robust ) weighting towards a close-to-‘uniform’ (robust ) one there is a clear decrease in the peak emission, as it drops from to mJy beam-1. Fitting Gaussians to each of the spectra, we find a difference of between the D-array only spectral amplitude and the C&D-array robust spectral amplitude. The restoring beams for each of these maps are listed in Table 1. Figure 3 shows that the peak flux decreases with increasing resolutions, and hence the source is resolved at higher resolution.
Second, we imaged the combined C&D-array dataset. This is problematic as well due to the different weightings required for optimal signal-to-noise by data from the two arrays and the broad line wings resulting from having significantly more time on-source with the D array versus the C array. To avoid these issues, we CLEANed the integrated line emission (velocities between km s-1 and km s-1) to a depth where the synthesized beam’s broad wings are removed and explored different Briggs weights. Figure 4 shows contours of the J1148+5251 velocity-integrated CO () emission imaged with a robust of overlaid on to the [C ii] emission observed by Cicone et al. (2015). The spatial resolution of the CO () observations is , just slightly higher than that of the [C ii] observation, as shown in the bottom left corner of the map.
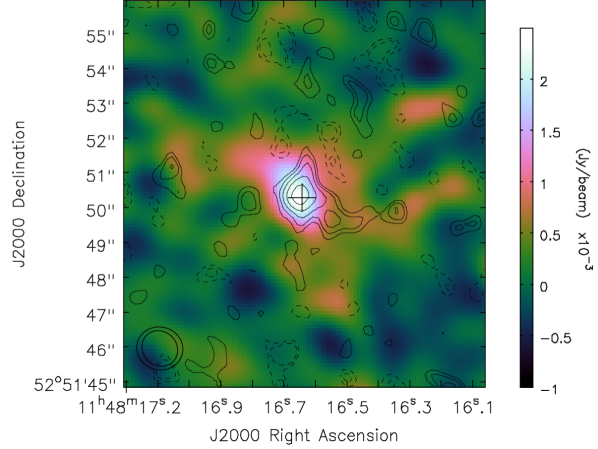
The main emission region is less than arcsec in extent, although there is some diffuse emission to the south west of the source at which needs further confirmation. A formal elliptical Gaussian fit to the robust image returns a deconvolved major axis of , and an undetermined minor axis and position angle. So we marginally resolve the emission in one direction and measure a size consistent with that found by Riechers et al. (2009) for the CO () emission.
The peak flux of Jy beam-1 is measured close to the position of the optical quasar (see cross in Fig. 4; White et al., 2005) and agrees very well with the position of the [C ii] emission.
Much deeper observations are needed to determine the source morphology as a function of velocity.
We do not detect any continuum in the CO () observations down to a limit of Jy.
4 Analysis
The line width of km s-1 we derive for the CO () emission agrees well with the width measured in previous studies (Bertoldi et al., 2003b; Riechers et al., 2009; Walter et al., 2009). Hence, the low and high order transitions have similar line profiles in J.
The FIR-to-radio spectral energy distribution fit from Wang et al. (2008) uses an emissivity index , a dust temperature K (Beelen et al., 2006) and a FIR-to-radio ratio (Yun, Reddy & Condon, 2001) and predicts an observed flux density of Jy, with a large uncertainty depending on . Our non-detection is just below the predicted value. This result confirms a value that is at least as steep as , and possibly steeper, thereby strengthening the argument for little cold dust in J.
4.1 Gas mass estimate
Far infrared CO luminosity ratios and linewidths in quasars at high redshifts are similar to what is observed in local ultra-luminous infrared galaxies (ULIRGs) (Solomon & Vanden Bout, 2005; Carilli & Walter, 2013) so we adopt the CO luminosity to H2 mass conversion factor of (K km s-1 pc2)-1 used for ULIRGs (Downes & Solomon, 1998). From Carilli & Walter (2013), the line ratio is typically very close to unity for high redshift galaxies, so we can approximate as K km s-1 pc2. Thus, from the CO (J luminosity we derive a total molecular gas mass of .
4.2 Dynamical mass estimate
Assuming a rotating disc geometry for the line-emitting gas in J we can estimate the dynamical mass of the emitting region using , where is the diameter in kpc we measured for the emission and is the FWHM in km s-1 of the line profile. Following Wang et al. (2013) we use the approximation FWHMCO(J=2→1). Taking the size of the source as 8.1 kpc (the major axis) implies . For an inclination angle of as found from the ratio of the minor to major axis, the dynamical mass is , in line with previously derived values. Walter et al. (2004) quote (or if accounting for an inclination of ) within a disc of diameter 5 kpc. Riechers et al. (2009) use the [C ii] line emission to find a dynamical mass of for a region with radius kpc. It has to be noted that there is substantial uncertainty to modelling assumptions (rotating disc), and model parameters (size, inclination) in our dynamic mass estimate. High resolution imaging in [C ii] or CO at much higher signal-to-noise is required to better understand the galaxy dynamics in J.
4.3 CO Line Excitation
We have expanded the large velocity gradient (LVG) model of the line excitation in J calculated by Riechers et al. (2009) in which the kinetic gas temperature and density are considered as free parameters. A fixed H2 ortho-to-para ratio was used due to the relative statistical weights of the symmetrical and antisymmetrical eigenstates of the wavefunction. This model uses the Flower (2001) CO collision rates and a cosmic microwave background temperature of K at . We kept the parameters adopted by Riechers et al. (2009): a CO abundance per velocity gradient of [CO] pc/(km s-1) (Weiß, Walter & Scoville, 2005; Riechers et al., 2006; Weiß et al., 2007a) and a CO disc radius of 2.5 kpc (Riechers et al., 2009; Walter et al., 2004).
The CO () data point fits well on the curve described by the best solution (Fig. 5). This was obtained for a spherical, single-component model with a CO disc filling factor of 0.16, K, and (H2) cm-3.

5 Discussion
We have observed the CO () transition towards J and find supporting evidence that J is similar to lower redshift quasars in terms of its high CO line excitation and compact size. We marginally resolve the main emission region to have a major axis of . We also detect tentative evidence for diffuse emission extending to the south west.
Considering the line excitation in J, our data are used to provide further constraints on previous LVG models, resulting in average physical conditions that are similar to those observed in other high-redshift quasars (Weiß et al., 2007b; Riechers et al., 2009). We find K extending from low to high order transitions. As such, it is possible that the emission in the low order transitions of CO may be associated with the same warm, highly excited star-forming gas traced by higher-J line transitions. This would support previous claims that the mid-J CO lines (J) may also be good indicators of the total amount of cool molecular gas in high redshift quasars (Riechers et al., 2006, 2011a).
In the local Universe, the traditional view of ultraluminous infared galaxies (ULIRGs) and AGN has been that these objects represent different phases in an evolutionary sequence (Sanders et al., 1988). A heavily dust obscured galaxy undergoing vigorous star-formation will be observed as a ULIRG, while a buried AGN continues to grow a supermassive blackhole. This may eventually give rise to a far-infrared luminous quasar, followed by an optically luminous quasar with only a modest gas reservoir remaining. This scenario may be similar to what is observed in high-redshift quasars, like J, which may have gone through an earlier phase of starburst activity before the AGN had formed. Extended reservoirs of cold molecular gas have been detected via CO line emission in SMGs (Carilli et al., 2010; 2010MNRAS.404..198I; Ivison et al., 2011; Riechers et al., 2010, 2011b, 2011c), suggesting that they may be in the process of forming through gas-rich mergers. A population of SMGs has recently been discovered (e.g. Riechers et al. 2013; Weiss et al. 2013), so it is possible that these may represent an early phase of the luminous quasars such as J. These objects are likely to evolve into the most massive early-type galaxies observed in the local Universe. However, in the case of the single known SMG, the lack of a hot dust component detected in the Herschel bands makes this object inconsistent with such a scenario. More work is required to establish the validity of the 6 SMGs and quasars connection.
We calculate new estimates of the gas and dynamical mass from the CO () line luminosity. Our results agree with previous measurements, but are less prone to biases due to high order molecular line excitation. The gas mass we estimate is of the dynamical mass, suggesting a low value for . This supports a departure from the relationship, in that the of the host galaxy is well below that expected from the low relation.
6 Acknowledgements
IIS thanks the Science & Technology Facilities Council for a studentship. The National Radio Astronomy Observatory is a facility of the National Science Foundation operated under cooperative agreement by Associated Universities, Inc. We thank Claudia Cicone and Roberto Maiolino for helpful discussions and for providing the [C ii] image.
References
- Becker, White & Helfand (1995) Becker R. H., White R. L., Helfand D. J., 1995, ApJ, 450, 559
- Beelen et al. (2006) Beelen A., Cox P., Benford D. J., Dowell C. D., Kovács A., Bertoldi F., Omont A., Carilli C. L., 2006, ApJ, 642, 694
- Bertoldi et al. (2003a) Bertoldi F., Carilli C. L., Cox P., Fan X., Strauss M. A., Beelen A., Omont A., Zylka R., 2003a, A&A, 406, L55
- Bertoldi et al. (2003b) Bertoldi F., et al., 2003b, A&A, 409, L47
- Briggs (1995) Briggs D. S., 1995, PhD thesis, The New Mexico Institute of Mining and Technology
- Carilli & Walter (2013) Carilli C. L., Walter F., 2013, ARA&A, 51, 105
- Carilli et al. (2004) Carilli C. L., et al., 2004, AJ, 128, 997
- Carilli et al. (2007) Carilli C. L., et al., 2007, ApJ, 666, L9
- Carilli et al. (2010) Carilli C. L., et al., 2010, ApJ, 714, 1407
- Cicone et al. (2015) Cicone C., et al., 2015, A&A, 574, A14
- da Cunha et al. (2013) da Cunha E., et al., 2013, ApJ, 766, 13
- Daddi et al. (2014) Daddi E., et al., 2014, arXiv, arXiv:1409.8158
- Downes & Solomon (1998) Downes D., Solomon P. M., 1998, ApJ, 507, 615
- Flower (2001) Flower D. R., 2001, J. Phys. B: At. Mol. Opt. Phys., 34, 2731
- Fan et al. (2003) Fan X., et al., 2003, AJ, 125, 1649
- Gallerani et al. (2014) Gallerani S., Ferrara A., Neri R., Maiolino R., 2014, MNRAS, 445, 2848
- Green (2011) Green D. A., 2011, Bull. Astron. Soc. India, 39, 289
- Ivison et al. (2011) Ivison R. J., Papadopoulos P. P., Smail I., Greve T. R., Thomson A. P., Xilouris E. M., Chapman S. C., 2011, MNRAS, 412, 1913
- Leipski et al. (2013) Leipski C., et al., 2013, ApJ, 772, 103
- McMullin et al. (2007) McMullin J. P., Waters B., Schiebel D., Young W., Golap K., 2007 in Shaw R.A., Hill F., Bell D.J., eds., ASP Conf. Ser. Vol. 376, Astronomical Data Analysis Software and Systems XVI Astron. Soc. Pac., Tucson, p.127
- Planck Collaboration et al. (2014) Planck Collaboration, et al., 2014, A&A, 571, A16
- Petric et al. (2003) Petric A. O., Carilli C. L., Bertoldi F., Fan X., Cox P., Strauss M. A., Omont A., Schneider D. P., 2003, AJ, 126, 15
- Riechers et al. (2006) Riechers D. A., et al., 2006, ApJ, 650, 604
- Riechers et al. (2009) Riechers D. A., et al., 2009, ApJ, 703, 1338
- Riechers et al. (2010) Riechers D. A., et al., 2010, ApJ, 720, L131
- Riechers et al. (2011a) Riechers D. A., et al., 2011a, ApJ, 739, L32
- Riechers et al. (2011b) Riechers D. A., et al., 2011b, ApJ, 733, L11
- Riechers et al. (2011c) Riechers D. A., Hodge J., Walter F., Carilli C. L., Bertoldi F., 2011c, ApJ, 739, L31
- Riechers et al. (2013) Riechers D. A., et al., 2013, Nature, 496, 329
- Sanders et al. (1988) Sanders D. B., Soifer B. T., Elias J. H., Madore B. F., Matthews K., Neugebauer G., Scoville N. Z., 1988, ApJ, 325, 74
- Solomon & Vanden Bout (2005) Solomon P. M., Vanden Bout P. A., 2005, ARA&A, 43, 677
- Walter et al. (2003) Walter F., et al., 2003, Nature, 424, 406
- Walter et al. (2004) Walter F., Carilli C., Bertoldi F., Menten K., Cox P., Lo K. Y., Fan X., Strauss M. A., 2004, ApJ, 615, L17
- Walter et al. (2009) Walter F., Riechers D., Cox P., Neri R., Carilli C., Bertoldi F., Weiss A., Maiolino R., 2009, Nature, 457, 699
- Wang et al. (2008) Wang R., et al., 2008, ApJ, 687, 848
- Wang et al. (2013) Wang R., et al., 2013, ApJ, 773, 44
- Weiß, Walter & Scoville (2005) Weiß A., Walter F., Scoville N. Z., 2005, A&A, 438, 533
- Weiß et al. (2007a) Weiß A., Downes D., Neri R., Walter F., Henkel C., Wilner D. J., Wagg J., Wiklind T., 2007a, A&A, 467, 955
- Weiß et al. (2007b) Weiss A., Downes D., Walter F., Henkel C., 2007b, in Baker A.J., Glenn J., Harris A.I., Mangum J.G., Yun M.S., eds, ASP Conf. Ser. Vol. 375, From Z-Machines to ALMA: (Sub)Millimeter Spectroscopy of Galaxies Astron. Soc. Pac., Charlottesville, p. 25
- Weiß et al. (2013) Weiß A., et al., 2013, ApJ, 767, 88
- White et al. (2005) White R. L., Becker R. H., Fan X., Strauss M. A., 2005, AJ, 129, 2102
- Willott, McLure & Jarvis (2003) Willott C. J., McLure R. J., Jarvis M. J., 2003, ApJ, 587, L15
- Yun, Reddy & Condon (2001) Yun M. S., Reddy N. A., Condon J. J., 2001, ApJ, 554, 803