Analytical Formulas of Molecular Ion Abundances and N2H+ Ring in Protoplanetary Disks
Abstract
We investigate the chemistry of ion molecules in protoplanetary disks, motivated by the detection of N2H+ ring around TW Hya. While the ring inner radius coincides with the CO snow line, it is not apparent why N2H+ is abundant outside the CO snow line in spite of the similar sublimation temperatures of CO and N2. Using the full gas-grain network model, we reproduced the N2H+ ring in a disk model with millimeter grains. The chemical conversion of CO and N2 to less volatile species (sink effect hereinafter) is found to affect the N2H+ distribution. Since the efficiency of the sink depends on various parameters such as activation barriers of grain surface reactions, which are not well constrained, we also constructed the no-sink model; the total (gas and ice) CO and N2 abundances are set constant, and their gaseous abundances are given by the balance between adsorption and desorption. Abundances of molecular ions in the no-sink model are calculated by analytical formulas, which are derived by analyzing the full-network model. The N2H+ ring is reproduced by the no-sink model, as well. The 2D (R-Z) distribution of N2H+, however, is different among the full-network model and no-sink model. The column density of N2H+ in the no-sink model depends sensitively on the desorption rate of CO and N2, and the flux of cosmic ray. We also found that N2H+ abundance can peak at the temperature slightly below the CO sublimation, even if the desorption energies of CO and N2 are the same.
1 Introduction
A ring of N2H+ emission was found in the disk around TW Hya using ALMA (Atacama Large Millimeter and submillimeter Array) (Qi et al., 2013). N2H+ is considered to be a useful probe of CO snow line, because it is destroyed by the proton transfer to CO
| (1) |
The inner radius of N2H+ ring is indeed consistent with the CO snow line predicted from a disk model of TW Hya. The anti-correlation of N2H+ and CO emission is also often observed in prestellar cores (e.g. Tafalla et al., 2004), which strengthen the above statement.
The bright emission of N2H+ outside the CO snow line is, however, puzzling. Laboratory experiments show that the sublimation temperatures of CO and N2 are similar (Collings et al., 2004; Öberg et al., 2005). Since N2H+ is formed by protonation of N2, N2H+ should also be depleted outside the CO snow line. In the case of prestellar cores, there are two possible explanations for the survival of N2H+ in the CO depleted region. Firstly, destruction of N2H+ is temporally suppressed by the freeze-out of its major reactant, CO. Secondly, the slow formation of N2 from N atom in molecular clouds helps the temporal survival of N2 (Aikawa et al., 2001; Maret et al., 2006; Bergin & Tafalla, 2007). The first mechanism could work in the disk as well, in a narrow range of temperatures where the positive effect of depletion on N2H+ abundance (i.e. decrease of CO) wins against the negative effect (i.e. depletion of N2). The second mechanism, on the other hand, seems irrelevant for disks. In protoplanetary disks, in which the gas density is much higher than molecular clouds, it is not likely that N atom is more abundant than N2 except for the photodissociation layer at disk surface.
In chemistry models of disks, it is often found that CO is depleted even in regions warmer than its sublimation temperature ( K) via conversion to less volatile species (Aikawa et al., 1997; Bergin et al., 2014; Furuya & Aikawa, 2014). Since the conversion works as a sink in the chemical reaction network of gaseous species, we call it the sink effect in the present work. Favre et al. (2013) showed, for the first time, observational evidences for such CO depletion towards TW Hya. Furuya & Aikawa (2014) showed that N2 is also subject to the sink effect; it is converted to NH3 via the gas-phase reactions of
| (2) | |||
| (3) |
and subsequent hydrogenations of NH on grain surfaces. It should be noted that this conversion is not efficient when CO is abundant, because N2H+ mainly reacts with CO to reform N2. The longer timescale required for N2 depletion could explain the N2H+ ring. But then the lifetime of the ring should be similar to the difference in the depletion timescales of CO and N2, which is rather short yr, if the ionization rate is s-1 (Furuya & Aikawa, 2014). Since N2 is considered to be a major nitrogen carrier in protoplanetary disks, but cannot be directly observed, it is important to constrain its distribution based on N2H+ observation. The formation mechanism of N2H+ ring is thus worth investigation via theoretical calculations.
The abundance of N2H+ could also be a probe of ionization degree in the regions of CO depletion. The ionization degree depends on the gas density and ionization rate, which is an important parameter for both chemical and physical evolutions of the disk. Since ionizations trigger the chemical reactions, as in molecular clouds, the timescale of chemical evolution depends on the ionization rate (Aikawa et al., 1997). The ionization degree determines the coupling with magnetic fields, e.g. which disk region is subject to magneto-rotational instability (Balbus & Hawley, 1991). The major ionization sources are X-ray from the central star, cosmic ray, and decay of radioactive nuclei (Glassgold et al., 1997; Umebayashi & Nakano, 1988; Cleeves et al., 2013). The ionization rate thus depends on the flux and hardness of X-ray radiation and the abundances of radioactive nuclei. In addition, the stellar winds and/or magnetic fields of the star-disk system could prevent the penetration of the cosmic ray to the disk. Since these parameters are unknown and could vary among objects, the ionization degree should be probed via observations. The observation of ionization degree is principally possible using major ion molecules. But a quantitative estimate of the ionization degree from the observational data is not straightforward, because the gas density, major ion molecules, and their abundances change spatially within the disk (e.g Aikawa et al., 2002; Qi et al., 2008; Cleeves et al., 2014).
In this work, we investigate the spatial distribution of N2H+ and other major molecular ions in protoplanetary disks. Firstly, we calculate the full chemical network model, which includes gas-phase and grain-surface reactions. The radial distribution of N2H+ column density has a peak around the radius of CO sublimation temperature; i.e. the N2H+ ring is reproduced. We found that the sink effect on CO significantly affects the distribution of N2H+. By analyzing the full chemical network, we also found that the abundances of major molecular ions, H, HCO+ and N2H+ can be described by analytical functions of gas density, temperature, ionization rate, and abundances of CO and N2. Such formulas are useful in deriving the ionization degree from the observations of molecular ions, combined with the dust continuum and CO observations to constrain the gas density and CO abundance.
While the sink effect plays an important role in determining the N2H+ distribution in the full network model, the efficiency of the sink depends on various parameters which are not well constrained yet. For example, the conversion timescale of CO and N2 to less volatile species depends on ionization rate and activation barriers of the reactions. The sink effect could be less significant, if the disk is turbulent and the diffusion timescale is shorter than the conversion timescale. Since there are various chemical paths for the conversion, it is difficult to directly control the efficiency of sink in the full-network model. In order to investigate the abundances of N2H+ and other molecular ions in the limit of no sink, we construct ”no-sink” model; we assume that the total (gas and ice) abundances of CO and N2 are constant, and that their gas-phase abundances are given by the balance between adsorption and desorption. The abundances of molecular ions are calculated using the analytical formulas.
The plan of this paper is as follows. In §2, we describe our disk model and chemical model. The molecular distributions in the full-network model are presented in section §3. In §4, we derive analytical formulas for abundances of electron, H, HCO+ and N2H+. The formulas are used to calculate their abundances in the disk model, which are compared with the results of full-network calculation. Section 5 presents the results of no-sink model. Since the no-sink model is analytical, we can easily investigate the dependence of N2H+ column density on desorption rate (i.e. sublimation temperature) of CO and N2. We also investigate how much the N2H+ column density is reduced, if the penetration of cosmic rays to the disk is hampered by the stellar wind and/or magnetic fields. We summarize our results and conclusions in §6.
2 Models
We adopt the same disk model as in Furuya & Aikawa (2014). In addition to the disk model with small grains, which is assumed in Furuya & Aikawa (2014), we also investigate a disk model in which the dust grains have grown up to a radius of 1 mm. The turbulent mixing is not explicitly included in the present work. The model of full chemical network is also the same as in Furuya & Aikawa (2014), but includes some updates. The models are briefly described in the following.
2.1 Disk Model
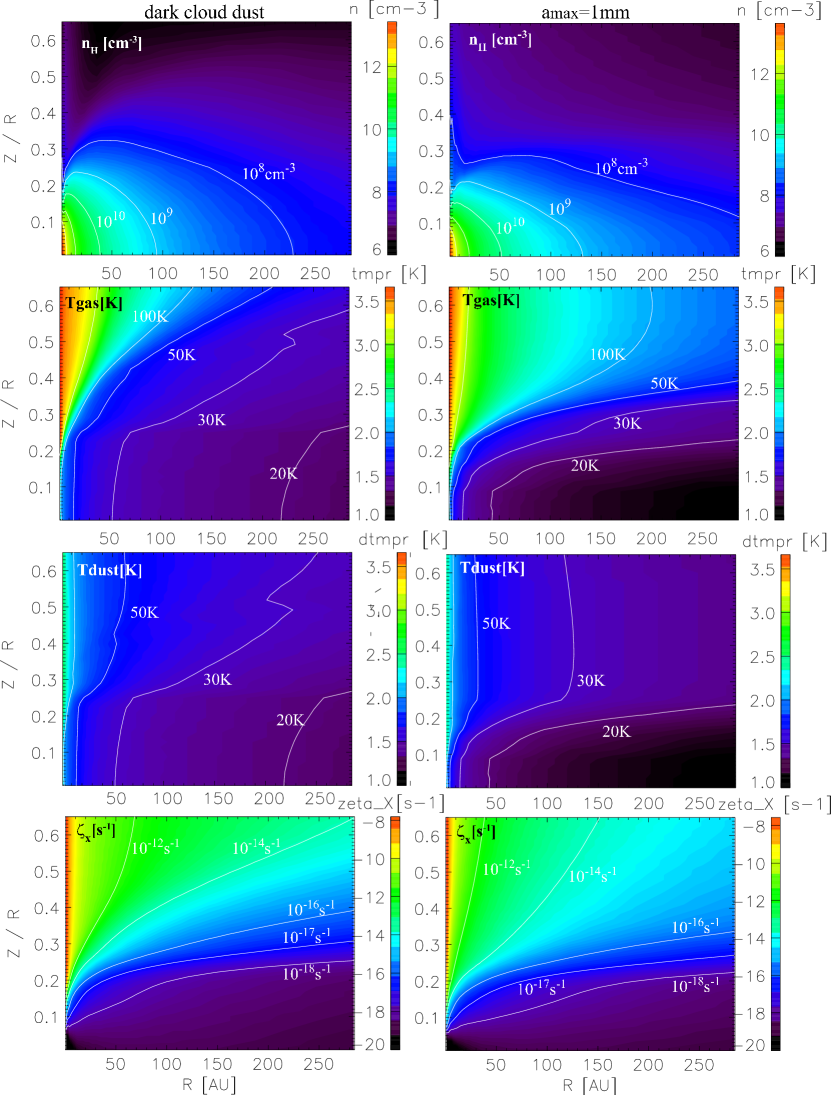
Since we aim to understand the mechanism to form N2H+ ring, rather than to investigate the disk structure of a specific object (i.e. TW Hya), we adopt a steady, axisymmetric Keplerian disk around a T Tauri star. The stellar mass, radius and effective temperature are , and K, respectively. The disk structure is given by solving the radiation transfer, thermal balance of gas and dust, and hydrostatic equilibrium in the vertical direction in the disk. Basic equations and calculation procedures are described in Nomura et al. (2007). We assume the stellar UV and X-ray luminosity of erg s-1 and erg s-1, respectively. The cosmic ray ionization rate of H2 is set to be s-1 (Dalgarno, 2006), while the ionization rate by the decay of radioactive nuclei is set to be s-1 (Umebayashi & Nakano, 2009). The dust-to-gas mass ratio is 0.01. We consider two disk models: one with the dark cloud dust and the other with millimeter-sized grains (Aikawa & Nomura, 2006). The former assumes the dust properties of Weingartner & Draine (2001) (, case B); while the silicate grains have a rather steep size distribution with the maximum radius of m, the carbonaceous grains have PAH-like properties in the small-size limit and graphite-like properties at larger sizes. The maximum size of carbonaceous grain is m. In the latter model, we assume the power-law size distribution of dust grains , where is the grain radius, referring to the ISM dust model of Mathis et al. (1977), but the minimum and maximum sizes are set to be 0.01 m and 1 mm, respectively. It would be more appropriate for T Tauri disks than the dark cloud dust model, since the grain growth is indicated by the disk observations (e.g. Williams & Cieza, 2011). The dust opacities for the two models are calculated using Mie theory. The gas temperature, dust temperature, and density distributions in the disk are calculated self-consistently, by considering various heating and cooling mechanisms. Figure 1 shows the distribution of gas density, gas temperature, dust temperature, and ionization rate by X-ray in our models. Cosmic ray ionization dominates in the midplane where the X-ray ionization rate is s-1. The temperature in the model with millimeter grains is lower than that in the dark cloud dust model due to the lower dust opacity at a given disk height () to receive the radiation from the central star. Column density in these disk models are determined by assuming a steady state disk structure with constant viscosity and accretion rate (although we consider turbulent diffusion and/or radial accretion only implicitly in the chemical model), so that the masses of the two disks are slightly different: for the dark cloud dust model and for the millimeter grain model.
2.2 Chemical Model: Full Network
Our chemical network is based on Garrod & Herbst (2006). We added photo-ionization, photo-dissociation and photo-desorption by UV radiation from the central star, self-shielding of H2, CO and N2 (Furuya et al., 2013; Li et al., 2013), X-ray chemistry and charge balance of dust grains. Although our model includes Deuteration and ortho/para states of several species such as H2 and H (Hincelin et al. in prep, Furuya et al. in prep), we present only the molecular abundances, i.e. the sum of isotopomers and o/p states. The D/H ratio and o/p ratios will be presented in forthcoming papers. Our model consists of two phases, gas phase and ice mantle; i.e. we do not discriminate layers of ice mantles, unless otherwise stated. Desorption energies () of assorted species are listed in Table 1 in Furuya & Aikawa (2014). Desorption energies of atomic hydrogen, CO and N2 are set to be 600 K, 1150 K, and 1000 K, respectively; they are the values on water ice substrates (Al-Halabi & van Dishoeck, 2007; Garrod & Herbst, 2006). The sublimation temperature of CO and N2 are then K and K, when the gas density is cm-3. We investigate the dependence of N2H+ abundance on the desorption energies of CO and N2 in §3 and §5.
Adsorbed species on grains migrate via thermal hopping and react with each other when they meet. We adopt the modified rate of Caselli et al. (1998, 2002) for grain surface reactions of H atom. The adsorption rate of gaseous species onto grain surfaces and grain surface reaction rates (e.g. if the rate is limited by the accretion of gaseous particle) depend on the size distribution of grains. Ideally, the grain size distribution should be taken into account (Acharyya et al., 2011). Most chemical models of disks and molecular clouds, however, assume a single size of 0.1 m, for simplicity, which we follow in the present work. The rate coefficients of gas-dust interactions (e.g. adsorption) are basically proportional to the total grain surface area. The assumption of a single grain size in the chemical model is thus a reasonable approximation, as long as the total surface area of grains are consistent with that in the physical disk model. The total surface area of the 0.1 m dust model agrees with that of our dark cloud dust model within a factor of a few. In the chemical model for the disk model with millimeter grains, we adopt the same uniform grain size (0.1 m), but decrease the dust-gas ratio by one order of magnitude; according to the power-law size distribution, the number of small grains, which dominate in the grain surface area, is decreased compared with the dark cloud dust model by an order of magnitude. (Aikawa & Nomura, 2006). One caveat for this single-size approximation is that we may underestimate the rate of grain surface recombination. In the dense regions, such as disk midplane at small radii, recombinations are more efficient on grain surfaces than in the gas phase. Due to the Coulomb focusing, the cross section of grain-surface recombination is much larger than the geometrical cross section of dust grains. The rate of grain surface recombination thus cannot be scaled by the total grain surface area.
The photodissociation rates are calculated by convolving the attenuated stellar and interstellar UV spectrum and wavelength-dependent photodissociation cross sections at each position in the disk (Aikawa et al., 2002; van Dishoeck et al., 2006). UV radiation induced by X-ray and cosmic ray (Gredel et al., 1989) is also taken into account. For ice mantle species, we assume that only the uppermost layers can be dissociated; i.e. while the UV radiation can penetrate into deep layers of ice mantle, we assume that the photo products in deeper layers recombine immediately. The effective rate of photodissociation is thus reduced. Considering the fluffiness and pores on the grain surfaces, we let the uppermost two layers, rather than one, to be dissociated.
We take into account three non-thermal desorption processes: photodesorption, stochastic heating by cosmic-rays, and reactive desorption. We adopt the photodesorption yields per incident FUV photon derived from the laboratory experiment for H2O, CO2, CO, O2 , and N2 (Öberg et al., 2009a, b; Fayolle et al., 2011, 2013). A yield is set to for other species.
Initial molecular abundance in the disk is given by calculating the molecular evolution in a star-forming core model of Masunaga and Inutsuka (2000) (see also Masunaga et al., 1998; Aikawa et al., 2008). The initial abundances of assorted molecules and the elemental abundances in our model are listed in Table 2. Major carriers of oxygen and carbon are H2O and CO, while the major N-bearing species are NH3 and N2. We adopt the low-metal abundance; i.e. the abundances of metals such as Mg and Si are about two orders of magnitude lower than observed in diffuse clouds.
We calculate the chemical reaction network (i.e. rate equations) as an initial value problem at each position in the disk. As we will see in §3, the abundances of electron, HCO+, N2H+, and H reach the steady state, which are determined by the ionization rate, gas density, temperature, and the abundances of CO and N2, in a short timescale. On the other hand, CO and N2 decrease slowly with time mainly due to the sink effect. Vertical diffusion and radial accretion, which are not explicitly included in the present work, could suppress or slow-down the sink effect (Furuya et al., 2013; Furuya & Aikawa, 2014). Therefore we present molecular abundances at an early time yr, as well as at the typical timescale of T Tauri stars yr.
2.3 Chemical Model: No-Sink Model
In the full-network model, we will see that the distribution of N2H+ is significantly affected by the CO depletion via sink effect. Efficiency of the sink effect, however, depends on various parameters such as CO2 formation (CO + OH) rate on dust grains, initial CO abundance, ionization rate, and turbulent mixing (Bergin et al., 2014; Furuya & Aikawa, 2014). A strong vertical turbulence, for example, tends to smooth out the molecular abundances, so that the local CO abundance minima due to the sink could be less significant. Although the observation of TW Hya indicates the CO depletion via sink effect (Favre et al., 2013), the spatial distribution of CO abundance is not well constrained yet. It is therefore useful to calculate the distribution of N2H+ in a model without the sink effect.
In the no-sink model, we assume that the sum of gas-phase and ice-mantle abundances of CO is equal to its canonical abundance: i.e. relative to the hydrogen nuclei. The gas-phase abundance of CO is given by a simple balance between adsorption and desorption;
| (4) | |||
| (5) |
where and are number densities of CO in the gas phase and ice mantle. While the first term in the numerator represents the thermal desorption, the second term represents the non-thermal desorption. Although our full network model includes various mechanisms of non-thermal desorption, here we consider only the stochastic heating by cosmic-rays for simplicity. It is the effective desorption mechanism in the cold midplane for species with relatively low desorption energies (Hasegawa & Herbst, 1993). The frequency of CO oscillation on grain surface is set to be s-1. When a cosmic-ray particle hits a dust grain, the grain is heated temporally for sec. The peak temperature of the temporal heating is set to be K. The rate for a grain to encounter Fe ion particle, which is the most efficient in dust heating among cosmic-ray particles, is s-1. The denominator represents the sticking rate of gaseous CO onto grain surfaces. The sticking probability on collision is set to be . The grain size is 0.1 m (see §2.2), and is the thermal velocity of CO particle. The abundance of gaseous N2 is formulated similarly, with the total N2 abundance set to be . It should be noted that this desorption rate by the cosmic-ray heating is a rough estimate. In reality and in our physical disk models, the grains actually have a size distribution, and the parameters such as and depend on the grain size. Leger et al. (1985), however, showed that the desorption rate via cosmic-ray heating does not sensitively depend on the grain size as long as the grains are small m. Since the small grains contribute most to the total surface area of grains, the desorption rate obtained here would be reasonable.
In section §4, we analyze the results of full network model to find out that the abundances of electron, H, HCO+, and N2H+ can be well described by analytical formulas, which are the functions of density, temperature, ionization rate, and abundances of CO and N2. We use these analytical formulas to obtain the molecular ion abundances in the no-sink model. A combination of the analytical formulas of molecular ions and equilibrium abundances of gaseous CO and N2 (eq. 4 and 5) makes it very easy to investigate the dependence of N2H+ abundance on various parameters such as desorption energies of CO and N2 and ionization rate in the disk.
3 Results: Full Network
3.1 Disk with dark cloud dust
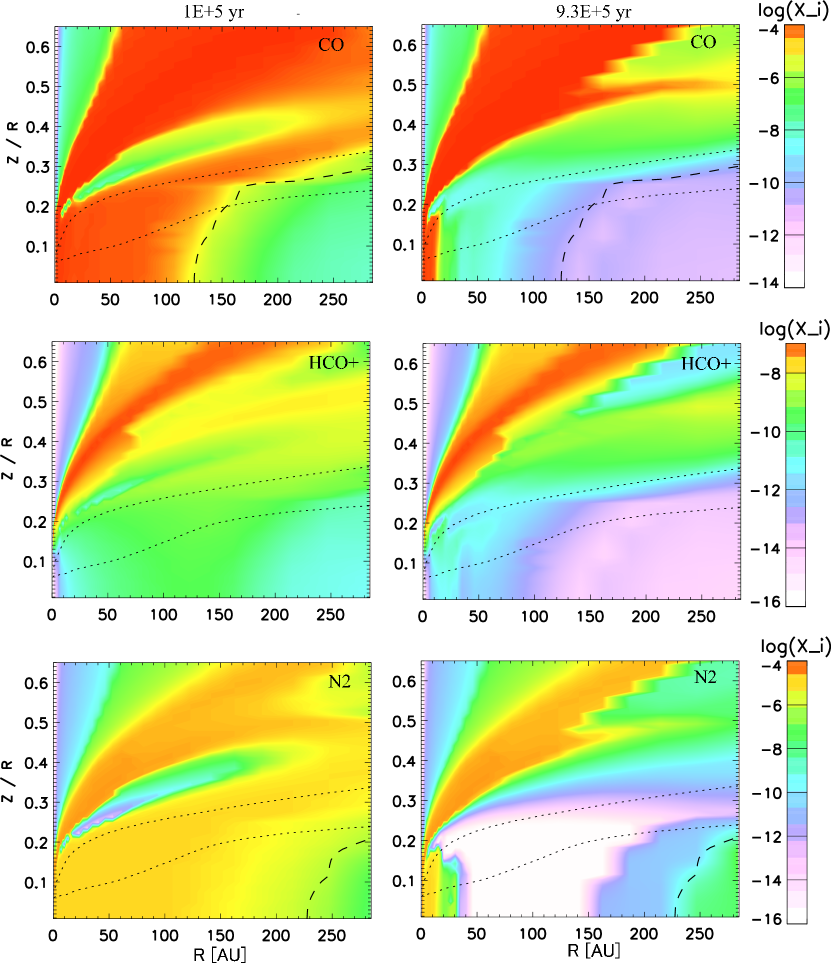
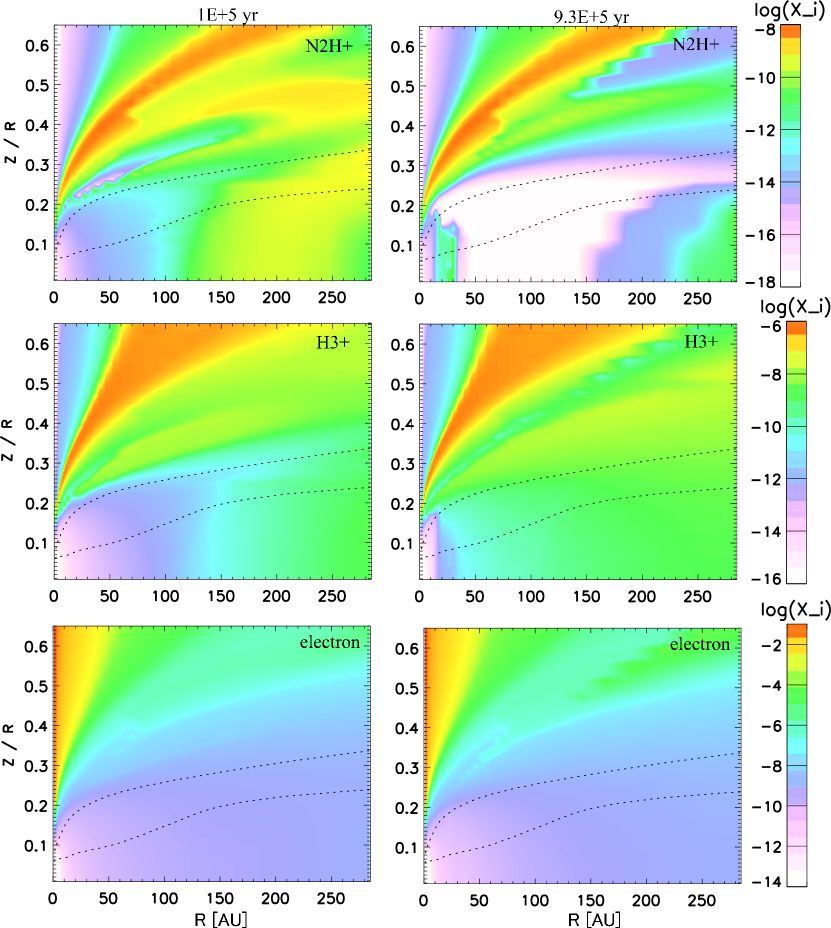
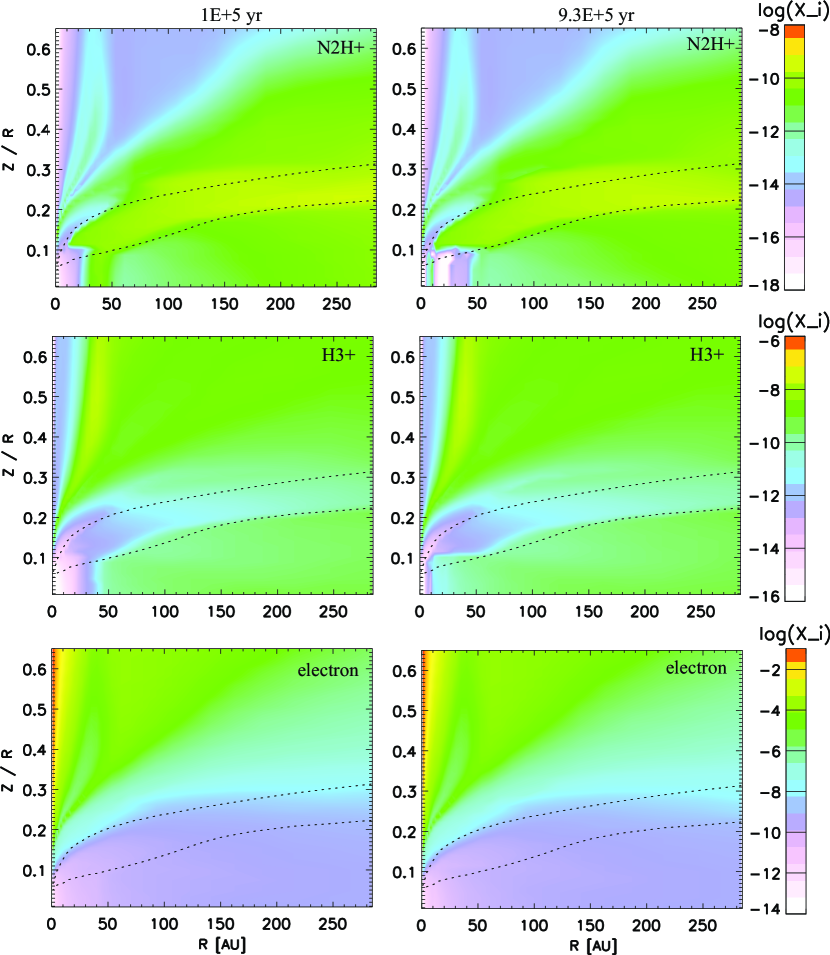
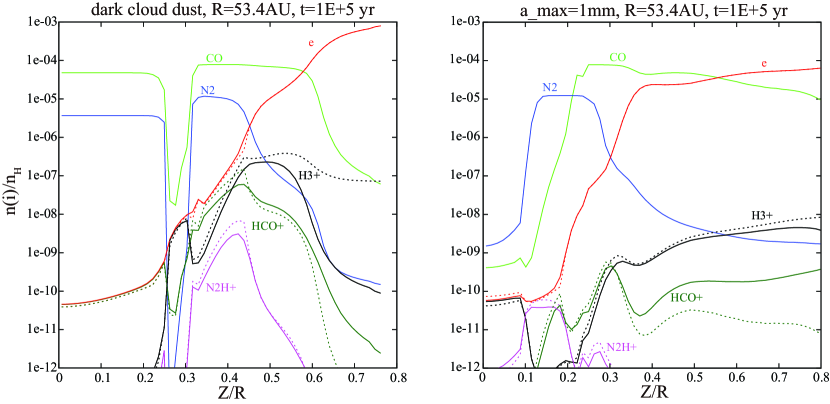
Figure 2 shows the distributions of CO, HCO+, N2, N2H+, H and electron abundances at the time of and yr in the model with dark cloud dust. N2H+ exists mostly in the upper layers of the disk. H is more abundant than HCO+ in the disk surface due to a relatively high abundance ratio of electron to CO (see §4.4). N2H+ is thus kept abundant there, via N2 + H, in spite of the destruction via the reaction (1).
The dashed lines in the panels of CO and N2 depict the position where the gas-phase abundance and ice abundance become equal in the adsorption-desorption equilibrium:
| (6) |
where and are number densities of CO (or N2) in the gas phase and ice mantle. It defines the ”snow surface” of volatile species in the disk. We define the CO and N2 ”snow line” as the radius at which the equation (6) is satisfied in the midplane.
In Figure 2, we can see that both CO and N2 are depleted in the midplane even inside their snow lines, especially at the later stage, yr; CO is converted to CO2 ice, CH3OH ice and hydrocarbons such as CH4 ice and C2H6 ice, while N2 is converted to NH3 ice. N2H+ is not abundant in the CO depleted region, since its mother molecule, N2, is depleted there as well. At yr, the sink effect is still moderate, and N2H+ abundance in the midplane has a local peak at AU. N2 is depleted in the outer radius, while N2H+ is destroyed by CO in the inner radius.
3.2 Disk with millimeter grains
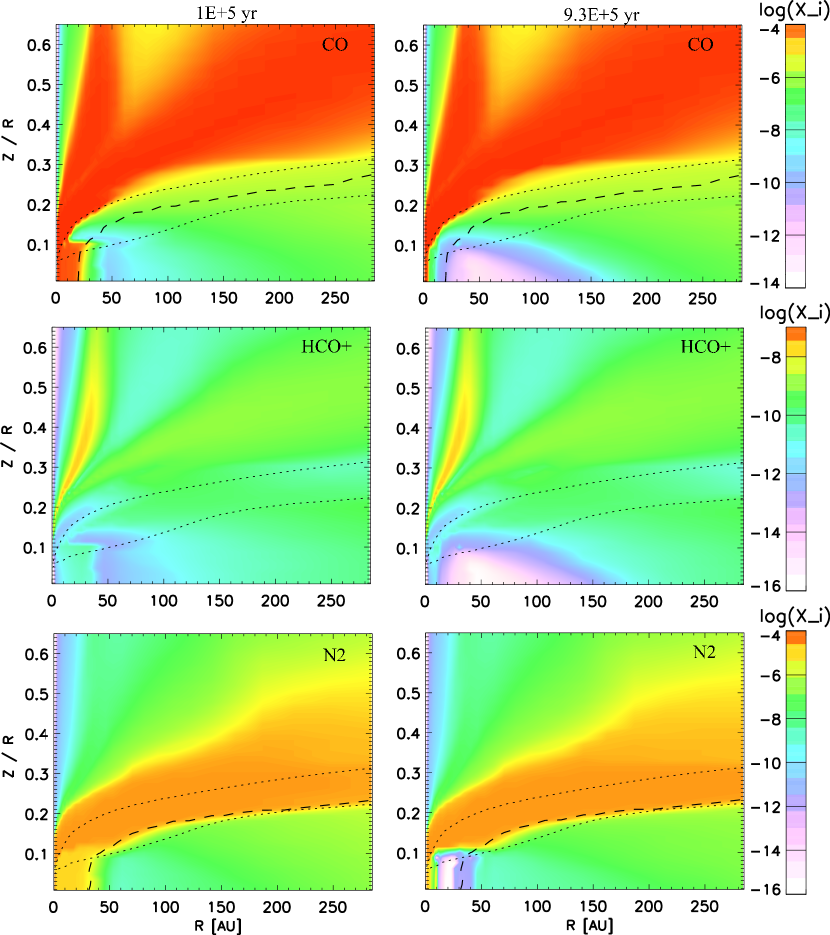
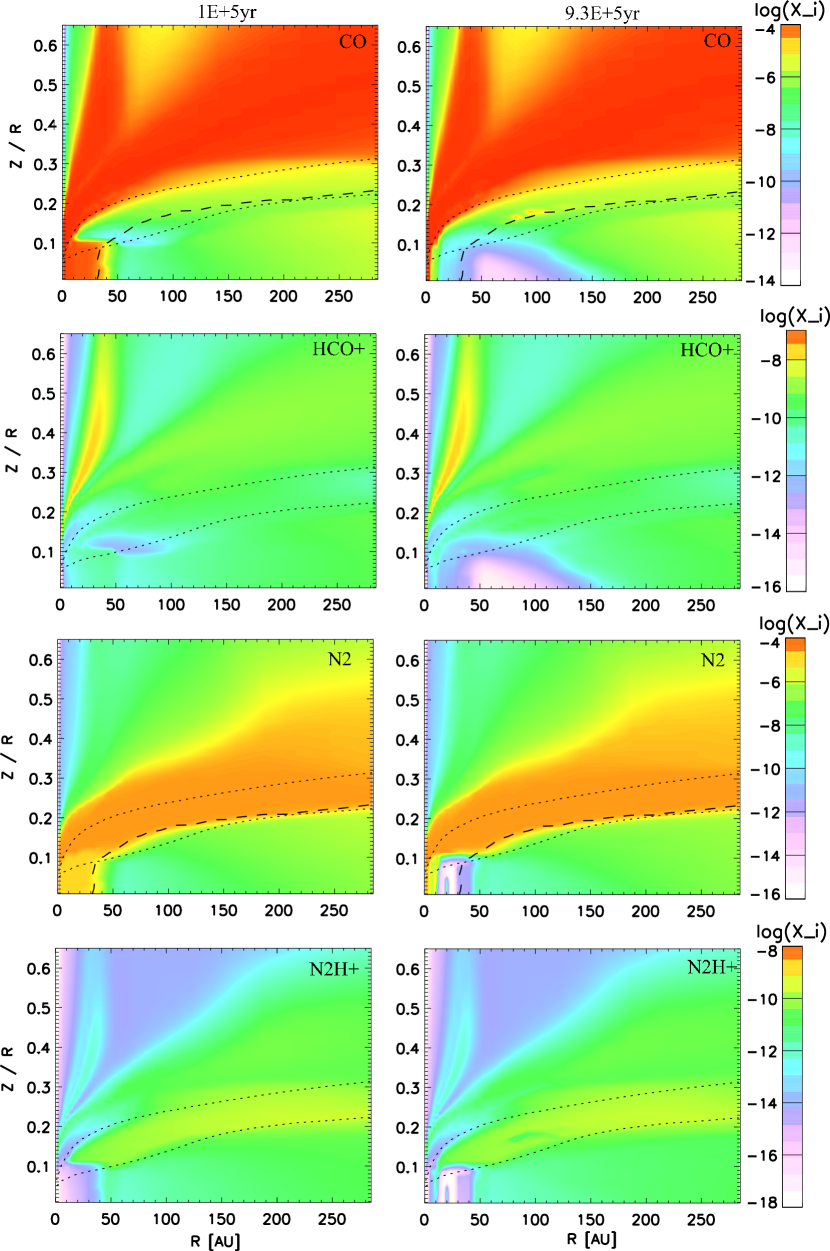
Figure 3 shows the distributions of CO, HCO+, N2, N2H+, H and electron abundances in the disk model with millimeter grains. The midplane temperature is warmer than 20 K and 30 K inside AU and AU, respectively. Although the sink effect is less significant due to the smaller total surface area of dust grains than in the model with dark cloud dust, CO is converted to CO2 ice via the grain-surface reaction of CO + OH, and is depleted from the gas phase even in the intermediate () layers above the dashed line, where the dust temperature is higher than the sublimation temperature of CO. In the midplane region with K, on the other hand, major carbon reservoirs are CO ice, CO2 ice and CH3OH ice.
While the spatial distributions of CO and N2 are similar in the dark cloud dust model, they are significantly different in the millimeter grain model; N2 is abundant in a layer at , where CO is depleted. In regions closer to the midplane, N2 ice and NH3 ice are the dominant N-bearing species. The conversion of N2 to NH3 ice proceeds via the gas-phase reactions of (2) and (3), and subsequent hydrogenation of NH on grain surfaces. At , the photodissociation of NH (NH N + H) is effective, which prevent the conversion of N2 to NH3 ice. The product of photodissociation, N atom, is converted back to N2 via the reaction of N + NO. In other words, a deeper penetration of UV radiation in the millimeter grain model is a key to suppress the sink effect on N2.
Another key difference between the models with dark cloud dust and millimeter grains is that H is not the dominant ion in the disk surface in the latter model. Since the UV shielding via dust grains is less effective in the millimeter grain model, UV radiation ionizes atoms, such as C and S, to make electrons abundant. Dissociative recombination of a molecular ion with an electron is much more efficient than the radiative recombination of an atomic ion. Thus the photoionization of atoms results in depletion of H and N2H+ in the disk surface (e.g. ). In lower layers, the distribution of N2H+ is basically similar to that of N2, except for the midplane in inner radius where CO is abundant (i.e. a few tens of AU at AU).
It should be noted that the layer with abundant N2 and CO depletion (and thus abundant N2H+) at is formed via the combination of sink effect on CO and photodissociation of NH, rather than via the difference in sublimation temperature of CO and N2. We performed a calculation of the same disk model but setting the both desorption energies of CO and N2 to be 1000 K. Distributions of CO, HCO+, N2 and N2H+ are shown in Figure 4. The resultant distribution of molecules are basically the same as in Figure 3.
3.3 Column densities
Although we do not aim to construct a best-fit model for a specific object, it is useful to briefly compare our models with observations to see which model reproduces the N2H+ ring better. Since the radiative transfer calculation is out of the scope of the present work, we compare the column density of N2H+ in our full-network models with the estimated values in TW Hya.
In the N2H+ observation by Qi et al. (2013), the 1-sigma detection limit corresponds to the N2H+ column density of cm-2. Qi et al. (2013) constructed disk models to fit their observational data. In the models that can reasonably fit the observational data, the N2H+ column density at the inner edge of the ring ranges from to cm-2. They also found that the column density contrast at the inner edge of the N2H+ ring is at least 20, and could be larger.
We also calculated the optical depth of N2H+ () line for a slab of H2 and N2H+ gas using the Radex code (van der Tak et al., 2007). Assuming the H2 density of cm-3 and line width of 0.15 km s-1, the N2H+ column density of cm-2 corresponds to the optical depth of and 0.49 for the gas temperature of 17 K and 30 K, respectively. In order to reproduce N2H+ ring, the column density of N2H+ should be at least higher than cm-2, which is consistent with Qi et al. (2013).
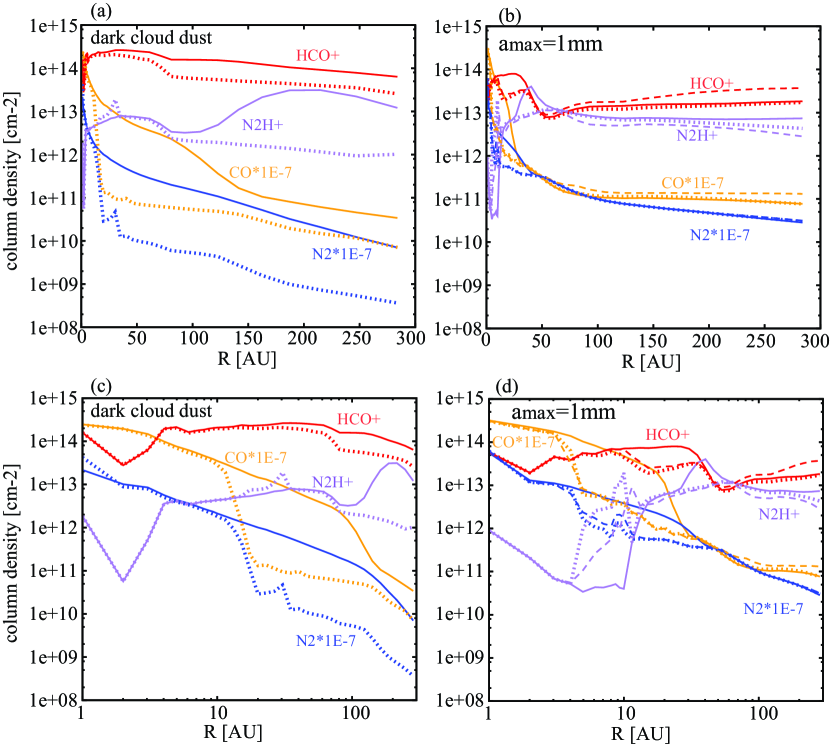
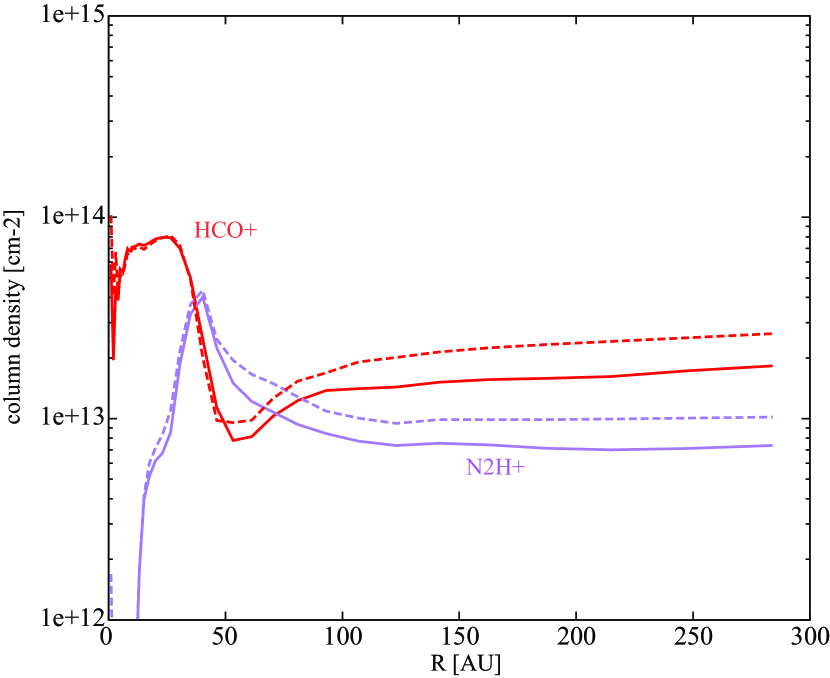
Radial distributions of column densities of CO, HCO+, N2 and N2H+ in the dark cloud dust model are plotted in Figure 5(a) and (c). The horizontal axis, , is linear in (a), while it is logarithmic to highlight the inner radius in (c). The distribution of N2H+ column density is rather flat. At yr, the N2H+ abundance has a peak in the midplane at AU, which is outside the CO snow line. But N2H+ column density does not sharply drop inwards at the CO snow line ( AU), because N2H+ is abundant in the disk surface even in the inner radius. At yr, the N2H+ is abundant only in the disk surface, and the N2H+ column density shows a peak at AU, which is inside the CO snow line.
The column densities of molecules in the millimeter grain model are shown in Figure 5 (b) and (d). At yr, the N2H+ column density has a peak at the radius of AU, and significantly decreases inwards at AU, which corresponds to the CO snow line in the disk model with millimeter grains. This model is thus in better agreement with the observation of TW Hya than the dark cloud dust model. At yr, the radius of N2H+ column density peak is shifted inwards due to the sink effect on CO and N2.
4 Analytical Solution for Molecular Ion Abundances
In the molecular layer, the major ions are HCO+, H and N2H+. In this section we derive analytical formulas for their abundances. The analysis helps us to better understand the spatial distributions of these species (Figure 2 and 3). We will show that we can calculate HCO+ and N2H+ abundances in a disk model, if the distributions of gas density, temperature, ionization rate, and abundances of CO and N2 are given. The formulas are useful in constraining the ionization rate from the observation of CO, HCO+ and N2H+.
4.1 Electron
Electron abundance, i.e. the ionization degree, is determined by the balance between ionization and recombination. Let us first assume that HCO+ is the dominant ion in the disk, for simplicity. A sequence of reactions starts with ionization of H2 via cosmic-ray, X-ray, or decay of radioactive nuclei;
| (7) | |||
| (8) | |||
| (9) | |||
| (10) |
We define the ionization degree (e) as (e)/ rather than (e)/(H2); while the latter is the usual definition, molecular abundances are relative to hydrogen nuclei in our numerical calculation. Considering the neutrality, the ionization degree in molecular gas is given by
| (11) |
The ionization rate is a sum of the rates by cosmic ray, X-ray (Figure 1), and decay of radioactive nuclei. The rate coefficients of relevant reactions are listed in Table 1 in Appendix A.
Now, it should be noted that the dominant ion varies within the disk. Although the rate coefficients of the dissociative recombination of molecular ions are mostly of the same order ( cm3 s-1), the values vary slightly among molecular ions. We thus adopt an iteration to evaluate the ionization degree. Initially, we assume that the reaction (10) dominates in the recombination of electron in the gas phase, and calculate the ionization degree, which is used to evaluate the abundances of molecular ions (see the following subsections). Then we re-calculate the equation (11) by replacing with the average of the recombination rate coefficients of molecular ions weighted by their abundances.
In the midplane at a few 10 AU, the gas density is so high that the grain surface recombination becomes more effective than the gas-phase recombination;
| (12) |
where G(-) and G(0) represent a negatively-charged grain and a neutral grain, respectively. Then the ionization balance is described as
| (13) |
where is the rate coefficient of the grain surface recombination of HCO+ (see e.g. Umebayashi, 1983). Assuming that most grains are negatively charged, which is valid when cm-3 s (Umebayashi, 1983), the electron abundances is calculated by solving this quadratic function. It should be noted that the equation (13) is equivalent to the equation (11), when the gas-phase recombination is more effective than the grain-surface recombination. Thus we use the equation (13) rather than (11) in the calculation of ionization degree in the whole disk, and is replaced by the weighted mean of the recombination rate coefficients in the iteration.
In deriving the equations (11) and (13), we have assumed that the molecular ions are the dominant charge carrier. In the disk surface however, atomic ions such as C+ and S+ are produced via photoionization and dominate over molecular ions (§3.2). In the transition layer from such an atomic-ion dominated (AID) layer to the molecular layer, many reactions contribute to the ionization balance, and the major reactions vary over the transition layer. It is thus difficult to derive analytical formula of electron abundances there. In the present work, we compare the electron abundance obtained by the equation (13) with the calculation of full reaction network at each position in the disk. We adopt the latter, when it is twice larger than the former. As we have seen in the previous section, the position of the transition region depends sensitively on the grain-size distribution in the disk model, as well as on the assumed UV flux from the central star and the interstellar radiation fields. Readers are advised to use the PDR (photon-dominated region) codes to calculate the electron abundance in the AID layer and transition region for a specific disk model. The PDR codes or their analogues are commonly used to calculate the vertical distributions of gas density and temperatures (e.g. Kamp & Dullemond, 2004; Nomura & Millar, 2005; Gorti & Hollenbach, 2008).
4.2 H
H is produced by the reaction (8). The major destruction paths of H are recombination and proton transfer to CO and N2. In the midplane at a few 10 AU, the grain surface recombination also becomes effective;
| (14) | |||
| (15) | |||
| (16) | |||
| (17) |
Considering the balance between the formation and destruction, H abundance is given by
| (18) |
4.3 N2H+
4.4 HCO+
HCO+ is formed by the reaction (1) and (16), and destroyed by the recombination in the gas phase (10) and on grain surfaces (12). Once the dust temperature exceeds K, molecules with higher proton affinity than CO, such as NH3, are desorbed to the gas phase to destroy HCO+. In this section, we neglect such a high temperature region, which is rather limited in our disk model. It is straightforward to derive
| (22) |
At the disk surface region, where the grain surface recombination is not effective and H dominates over N2H+, the equation is modified to
| (23) |
It shows that HCO+ is less abundant than H, if the abundance ratio of CO to electron is lower than (cf. §3.1).
4.5 Comparison with numerical results
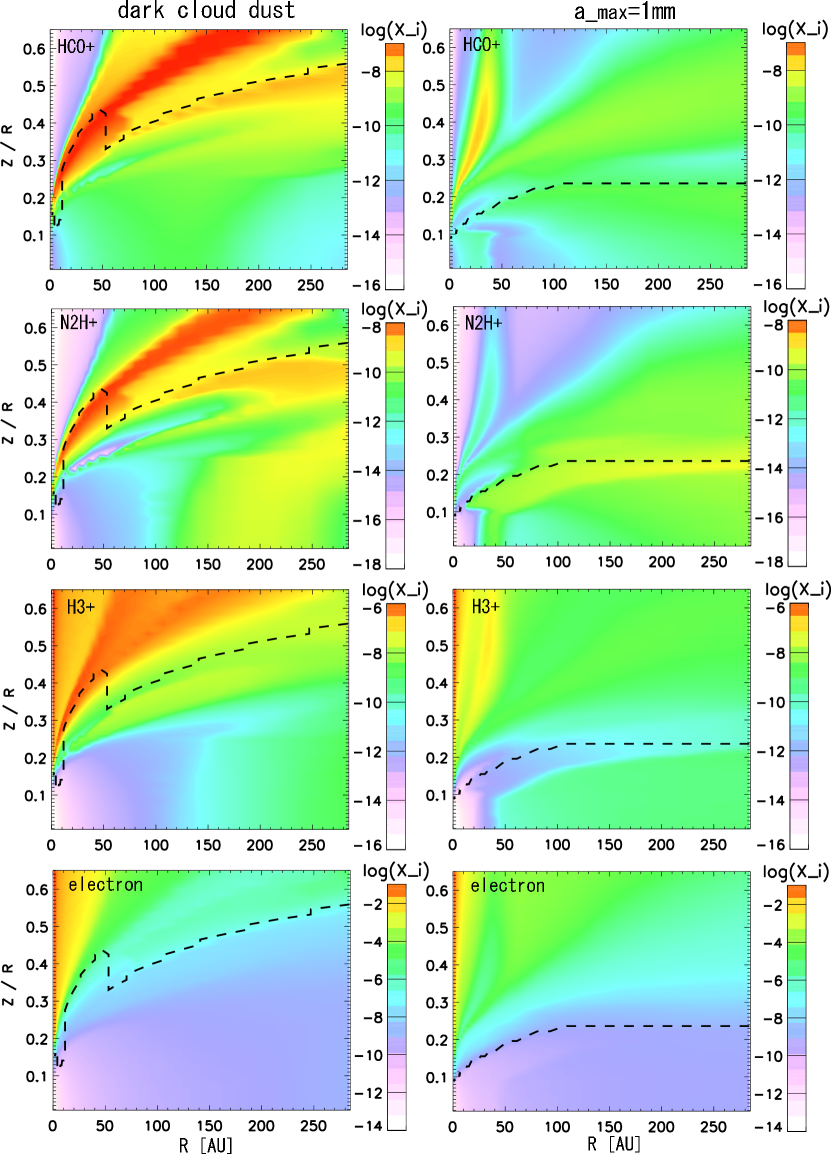
We now check how the analytical formulas compare with the full network calculation. We adopt the physical parameters (density, temperature, and ionization rate) and abundances of CO and N2 from the full network model at yr and calculate the abundances of electron, H, N2H+, and HCO+ using the analytical formulas at each position in the disk models with dark cloud dust and millimeter grains. As described in §4.1., our analytical solution applies to a layer in which the major ions are molecular ions. When the electron abundance obtained in the full network calculation is twice larger than given by the analytical formula (i.e. AID layer), we adopt the electron abundance from the former. It should be noted however, that the analytical formulas for H, N2H+ and HCO+ are appropriate even in the AID layer, if the electron abundance is adopted from the full network.
Figure 6 shows the 2D distributions of electron, H, N2H+ and HCO+ abundances calculated using the analytical formulas in the disk models with dark cloud dust (left panel) and millimeter grains (right panel). The distributions of molecular ions are to be compared with those in the left columns of Figure 2 and 3. The dashed lines indicate the height () above which we adopt the electron abundance of the full network calculation. For a more quantitative comparison, Figure 7 shows the molecular distribution in the -direction at AU in the disk models with dark cloud dust and millimeter grains. The solid lines depict the abundances calculated by the full reaction network, while the dotted lines depict the analytical solution.
We can see that the analytical formulas are in reasonable agreement with the results of the full network calculation in the both models. At high (e.g. at AU), H is overestimated; while the analytical formula (18) assumes that the hydrogen is all in H2, it is photodissociated in the full network model in such un-shielded low-density regions. In molecular layers at lower , on the other hand, the analytic formulas tend to slightly overestimate the molecular ion abundances, partly because the analytical formulas neglect the neutral species other than CO and N2. In the full network model, there are minor neutral species, such as OH, which have a larger proton affinity than N2 and CO. In the upper layers of the millimeter grain model, the analytical formula underestimates the HCO+ abundance; another formation path, CO+ + H2 becomes effective in this region.
Figure 8 shows the column densities of HCO+ and N2H+ obtained by the full network calculation in the millimeter grain model at yr (solid lines) and the analytical formulas (dotted lines). The column densities of the analytical model agree with the full network model within a factor of 2. Although the analytical formula underestimates the HCO+ abundance at the disk surface, the surface region does not contribute much to the HCO+ column density.
In summary, we have demonstrated that the analytical formulas of molecular ion abundances agree well with the full network results. The analytical formulas give reasonable spatial distributions of molecular ions, taking into account the spatial variation of gas density and ionization rate. They can thus be used to compare a disk model with molecular line observations without performing the full chemical network calculations. The input parameters of the formulas are density, temperature, ionization rate, and abundances of CO and N2. The distributions of density and temperature should be prepared for a specific object. Then the ionization rate can be calculated by X-ray radiation transfer and by assuming a cosmic-ray penetration depth and abundances of radioactive nuclei (e.g. Cleeves et al., 2014). The electron abundance in the disk surface is also needed, and can be obtained by the PDR calculation. Alternative option is to simply assume a height from the midplane below which molecular ions are more abundant than atomic ions. Finally we need spatial distributions of CO and N2. While the full network calculations show that they are subject to the sink effect and thus could decrease with time even in the region warmer than their sublimation temperature, the simplest assumption would be the equilibrium abundance between adsorption and desorption, as we will see in the next section.
5 Results: No Sink Model
In our full network calculations, N2H+ ring is reproduced in a millimeter grain model with a significant CO depletion due to the sink effect. Efficiency of the sink effect, however, depends on various parameters. It is therefore useful to calculate the distribution of N2H+ in a model without the sink effect. As described in §2.3, here we assume that the total (gas and ice) abundances of CO and N2 are constant, and that their gas/ice ratios are determined by the equilibrium between the adsorption onto and desorption from the grain surfaces (eq. 4 and 5).
A combination of the analytical formulas of molecular ions and equilibrium abundances of CO and N2 make it very easy to investigate the dependence of N2H+ abundance on various disk parameters. Here we demonstrate this merit of the analytical formulas by investigating the dependence of N2H+ abundance on desorption energies of CO and N2, and on ionization rate in the disk model with millimeter grains. We could apply the no-sink model to the disk model with dark cloud dust, as well, but the relatively high abundance of N2H+ in the disk surface makes the radial distribution of N2H+ column density flatter than observed (§3.1).
5.1 N2H+ in Disk Models Without Sink Effect
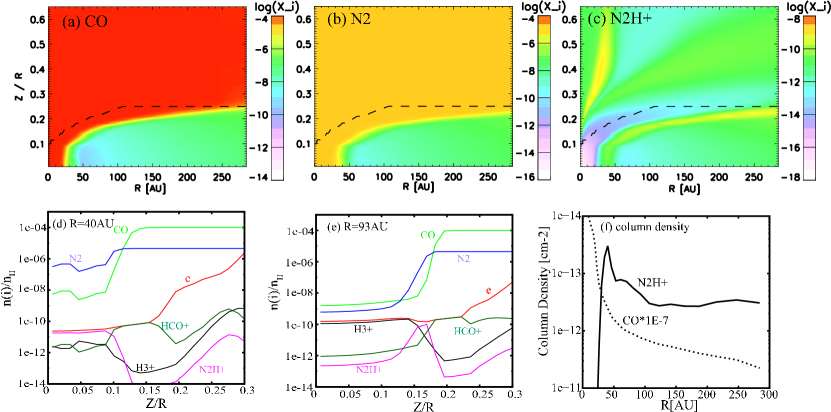
Figure 9 () shows the distributions of CO, N2, and N2H+ in the no-sink model in the disk model with millimeter grains. The desorption energies of CO and N2 are assumed to be 1150 K and 1000 K, respectively. The dashed line depicts the height above which the electron abundance is adopted from the full-network model. Figure 9 () shows the vertical distributions of molecules at the radius of 40 AU and 93 AU. At AU, the temperature is close to the sublimation temperatures of CO and N2 even in the midplane. The gas-phase abundances of CO and N2 are thus mostly determined by the thermal desorption. In the midplane at AU, on the other hand, the non-thermal desorption by cosmic-ray dominates over the thermal desorption. The abundance of N2H+ is determined by the equation (21). As expected, N2H+ abundance is high in layers where N2 is more abundant than CO. We note however, that N2H+ abundance is determined not only by the abundance ratio of N2/CO. For example, in Figure 9 (), the N2H+ abundance varies among the three positions where the abundances of CO and N2 are equal. The absolute values of CO and N2 abundances matter, since they control the abundance of H (eq. 18), from which N2H+ is formed. Note that N2H+ abundance in the very surface region of the disk (e.g. at AU) could be overestimated; its mother molecule, N2, is photodissociated in the disk surface in the full network model.
The radial distributions of N2H+ column density is shown in Figure 9 (). The dotted line depicts the CO column density multiplied by a factor of . In order to avoid the photodissociation region at the disk surface, N2H+ column density is calculated by the integration at ( AU), ( AU), and ( AU), while the CO column density is obtained by the integration along the whole disk height. We can see that N2H+ column density indicates a ring structure, as in the full-network model. The spatial distribution of N2H+ is however, different from that in the full-network model. Firstly, the N2H+ ring is sharp and exists right outside the CO snow line in the no-sink model, simply reflecting the lower desorption energy of N2 than that of CO, while it is broader in the full-network model, especially in the late stage ( yr). The peak N2H+ column density at AU and yr is lower in the full network model, because N2 is depleted via the sink effect in the midplane. Secondly, N2H+ is confined to a thin layer colder than the CO sublimation temperature in the no-sink model, while it is abundant also in the upper warmer layers in the full-network model. The two models can thus be distinguished by constraining the vertical distributions of N2H+ from observations.
In the case of TW Hya, N2H+ lines of and are observed (Qi et la., 2013; Qi et al., 2013). Assuming that the lines are optically thin under LTE conditions, the excitation temperature is derived to be K. The relatively high excitation temperature of N2H+, together with the low CO abundance indicated by C18O and HD observations (Favre et al., 2013), might be better explained by the full-network model. We postpone the discussion on TW Hya to a future work, in which we will apply our network model and analytical formulas to a disk model specified for TW Hya, and simulate molecular emission with non-LTE radiative transfer calculations for more quantitative comparisons with the observational data.
5.2 Dependence on desorption rates
So far, we set the desorption energies of CO and N2 to be 1150 K and 1000 K, respectively. It is well known however, that the desorption energies of molecules depend on the chemical compositions and physical structure (e.g. crystal or amorphous) of the ice mantle. While the values we adopted from Garrod & Herbst (2006) are desorption energies on water-dominated ice surfaces derived from the temperature programmed desorption (TPD) experiments (Collings et al., 2004), the desorption energies of pure ices of CO and N2 are (CO) K and (N K (Öberg et al., 2005). In §3.2, we have shown that in the full-network model the N2H+ distribution does not sensitively depend on the desorption energies of CO and N2, because the layer of CO depletion, where N2H+ is abundant, is determined by the sink effect rather than thermal desorption. If the CO sink is not effective, on the other hand, the abundance of N2H+ could be more sensitive to their desorption energies.
We also note that the equation (4) assumes the first-order desorption; i.e. the desorption rate is proportional to the abundance of the species in the ice mantle, . In the following, we call this model as ”2 phase”, since this equation is usually used in the 2-phase gas-grain chemical models, which do not discriminate the layers of ice mantle. In reality, the migration (and thus desorption) of molecules deeply embedded in the ice mantle could be inefficient, at least at low temperatures (e.g. Collings et al., 2004). We therefore consider another model, i.e. ”3-phase” model, in which only the surface monolayer is subject to desorption:
| (24) |
where cm-2 is the number density of adsorbing site on a grain surface. The desorption is zero-th order, as long as the ice is abundant enough to occupy more than a monolayer in the ice mantle, i.e. . Then the gaseous abundance is independent of the total abundance. In the 2-phase model, on the other hand, the gaseous CO (N2) abundance is proportional to the assumed total abundance of CO (N2).
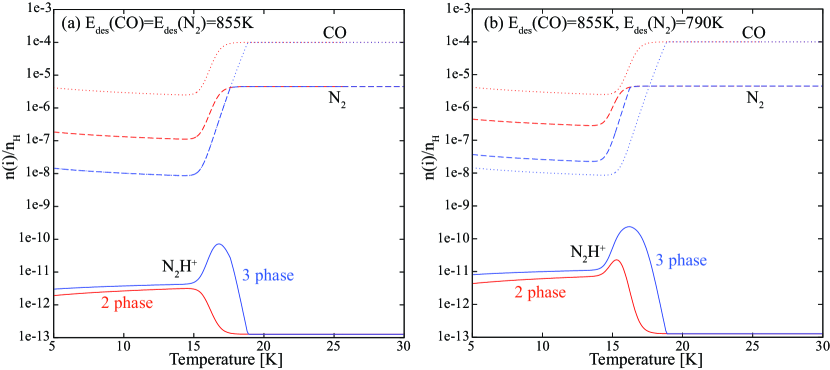
Before showing the N2H+ abundance in the disk model with various desorption rates, it is instructive to apply the analytical formulas to a simpler model, where the gas density and ionization rate are constant, cm-3 and s, respectively. Figure 10 shows the gaseous abundances of CO, N2 and N2H+ as a function of temperature. The gas and dust temperatures are set to be equal. The total (gas and ice) abundances of CO and N2 are and , respectively. The desorption energies are set to be (CO) (N2) K in Figure 10(a), and (CO) K and (N2) K in Figure 10(b). The desorption rate of 2-phase model (eq. 4) is assume for the red lines, while the 3-phase model is assume for the blue lines. The abundances change drastically at the sublimation temperature K. At K, the gaseous abundances of CO and N2 slightly increase with decreasing temperature; desorption rate is kept constant due to the non-thermal desorption, while the adsorption rate is proportional to . By comparing the red and blue lines, we can see that the sublimation temperature and gaseous abundances of CO and N2 at low temperatures are significantly different between the 2-phase and 3-phase models; the 3-phase model gives much smaller desorption rate than the 2-phase model, when the ice mantle is thick. In the 3-phase model with the same for CO and N2 (blue lines in panel a), the gaseous abundance of CO and N2 are the same below the sublimation temperature. It is interesting that the N2H+ abundance shows a sharp peak slightly below the sublimation temperature. It clearly shows that the N2H+ abundance depends not only on the abundance ratio of CO/N2, but also on the absolute values of their abundances. Specifically, the N2H+ abundance reaches the maximum value when the abundance ratio of CO to electron is , which is about at K (see Appendix B). In the models of Figure 10, the electron abundance is about several and varies slightly with temperature and desorption model. At warm temperatures where the abundance ratio of CO to electron is higher than this critical value, HCO+ is the dominant ion, while H dominates at lower temperatures. In the case of 2-phase model with the same for CO and N2(red lines), on the other hand, N2H+ abundance does not show such a sharp peak around the CO sublimation temperature, because the abundance ratio of CO to electron is always higher than the critical value mentioned above. In the case of (N2) (CO) (Figure 10 b), there is a narrow temperature range in which N2 is relatively abundant but CO is not, so that N2H+ abundance has the maximum value, even in the 2-phase model.
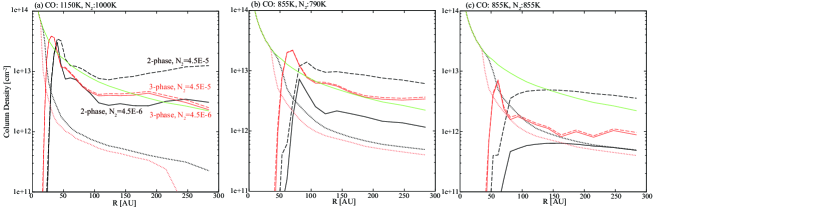
Figure 11 shows the radial distributions of N2H+ (solid lines) and CO (dotted lines) column densities in the disk model with millimeter grains as in Figure 9 (), but for three sets of desorption energies of CO and N2: (CO)=1150 K and (CO)=1000 K in panel (a), (CO)=855 K and (CO)=790 K in panel (b), and (CO)=855 K and (CO)=855 K in panel (c). The column density of hydrogen nuclei is multiplied by a factor of , and is shown by the green line. The black and red lines depict the 2-phase and 3-phase models, respectively. The total (gas and ice) abundance of N2 is relative to hydrogen for the solid lines. In order to investigate the dependence of N2H+ abundance on the total N2 abundance, it is set to be 10 times higher for the dashed lines. We can see that all the models show a ring-like structure of N2H+. The N2H+ column density and its radial gradient however, depend significantly on the desorption energies and the model of desorption. The CO snow line and the inner edge of N2H+ ring are at smaller radii in the model with higher (CO). They are also at smaller radii in the 3-phase model than in the 2-phase model, because of the lower desorption rate in the 3-phase model. While the N2H+ column density significantly depends on the total N2 abundance in the 2-phase model, the dependence is weak in the 3-phase model. Dependence of the N2H+ column density on the desorption energies of CO and N2 are complex, as expected from Figure 10. In the models with (CO) (N2), there is a region where N2 is thermally desorbed but CO is not, which results in a peak of N2H+ column density with a width of a few 10 AU. In the models with (CO) (N2) K, the N2H+ column density shows a sharp peak in the 3-phase model, but not in the 2-phase model, as expected from Figure 10.
5.3 Dependence on Ionization rate
Although we have assumed that the attenuation length of the cosmic ray ionization is 96 g cm-2(Umebayashi & Nakano, 1981), the stellar winds and/or magnetic fields could hamper the penetration of cosmic rays to the disk. Then X-ray would be the major ionization source (Cleeves et al., 2013; Glassgold et al., 1997). The dotted lines in Figure 3 depict the height from the midplane below which the X-ray ionization rate is lower than s-1 and s-1, respectively. The layer with abundant N2H+ are around or below these lines in both the full network model (i.e. with CO sink) and the no-sink model. Here we investigate how the N2H+ column density changes, if the cosmic ray does not reach the disk.
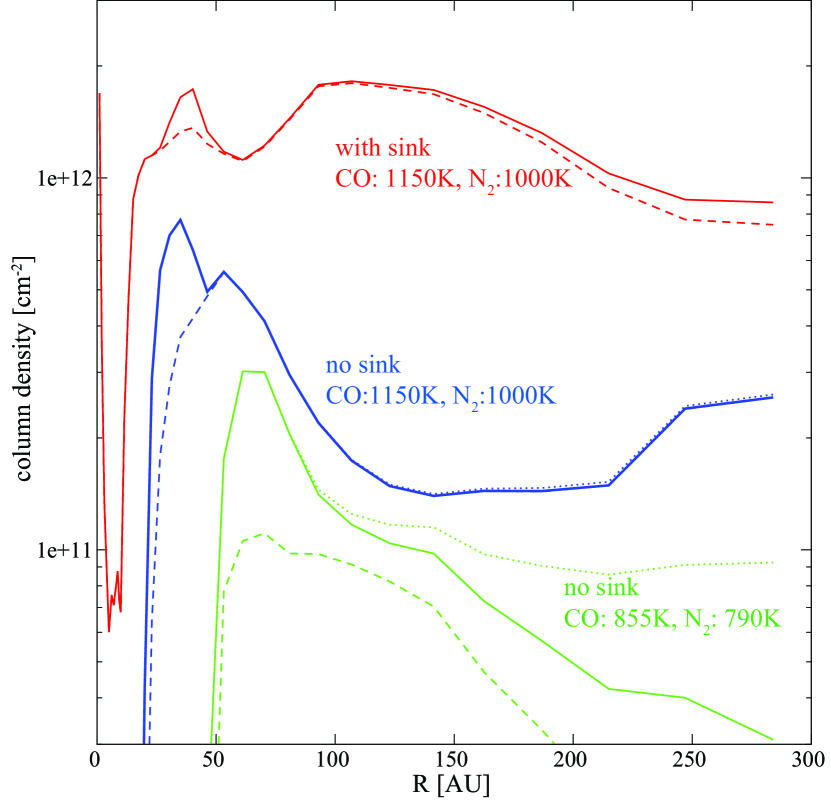
Figure 12 shows the radial distribution of N2H+ column density without the cosmic-ray ionization. X-ray is the only ionization source for the dashed lines, while the decay of radioactive nuclei is considered for the solid lines. It should be noted that cosmic ray also causes non-thermal desorption in our models; the non-thermal desorption by the cosmic-ray is neglected for the solid lines and dashed lines. For a comparison, the dotted lines depict the model in which the non-thermal desorption is included but ionization source is X-ray and radioactive nuclei; although such a model is not self-consistent, we can see the importance of the non-thermal desorption by comparing the solid lines with dotted lines. The blue and green lines depict the model in which CO and N2 abundances in the gas phase are given by the 3-phase model; labels in the figure depict the assumed desorption energies of CO and N2. For the red lines, we refer to the CO and N2 abundances in our full network model at yr, i.e. the model with sink. Note that there is thus no red dotted line. Compared with the models with cosmic ray ionization (Figure 8 and 11), the N2H+ column density is reduced significantly. The reduction factor, the ratio of the peak column density in the model with cosmic ray to that in the model without cosmic-ray, is the highest () in the no-sink model with low CO and N2 desorption energies, while it is the lowest (factor of ) for the model with sink. In the latter model, N2H+ is relatively abundant even in the layer with the X-ray ionization rate s-1 (i.e. ). In the no-sink models, on the other hand, N2H+ is depleted at . In the model with lower desorption energy of CO, the CO freeze-out region, where the N2H+ is abundant, is confined to the layer closer to the midplane with low X-ray ionization rate.
6 Summary
In this work we calculated the molecular abundances in disk models to investigate the origin of N2H+ ring recently found at the CO snow line in the disk of TW Hya (Qi et al., 2013). We adopt two disk models with different dust properties; dust grains are similar to dark cloud dust in one model, while they have grown to millimeter size in the other model. We first calculated a full network of gas-grain chemical reactions. Our findings in the full-network model are as follows.
-
•
In the model with dark cloud dust, N2H+ is abundant in the disk surface. Although N2H+ abundance near the midplane has a local maximum outside the radius of CO snow line, N2H+ column density is rather high even inside the CO snow line, because N2H+ in the disk surface contributes significantly to the column density.
-
•
In the model with millimeter grains, the column density of N2H+ shows a local peak around the CO snow line. N2H+ is abundant in the warm intermediate layer where CO is depleted via the sink effect, while N2H+ is destroyed by the proton transfer to CO inside the CO snow line. Penetration of UV radiation (i.e. lower extinction than the dark cloud dust model) plays two important roles. Firstly, UV radiation makes the atomic ions dominant in the disk surface, so that N2H+ is not abundant there. In the intermediate layer where CO is depleted via the sink effect, the conversion of N2 to NH3 (i.e. the sink effect on N2) is prevented by the photodissociation of NH, so that N2H+ is abundant.
-
•
In the model with millimeter grains, the distributions of N2H+ and its column density do not change significantly when the desorption energies of CO and N2 are varied. The N2H+ column density shows a local peak at the radius of CO snow line, even if the desorption energies of CO and N2 are equal, because in the region with abundant N2H+, CO is depleted via the sink effect rather than the adsorption of CO itself onto grain surfaces.
-
•
By analyzing the results of the full-network model, we derived analytical formulas of electron, H, N2H+ and HCO+ abundances as functions of gas density, temperature, ionization rate, and abundances of CO and N2. The analytical formulas would be useful for radio observers to derive the abundances of these molecular ions from the observational data using a reasonable physical model for a well-observed disk such as TW Hya.
While the sink effect on CO plays an important role in determining the N2H+ abundance in the full-network model, the efficiency of the sink depends on various parameters such as turbulence in the disk and the rates of chemical conversion of CO to less volatile species. We thus constructed the no-sink model, in which the total (gas and ice) abundances of CO and N2 are set constant, and their gas-phase abundances are determined by the balance between the adsorption and desorption. The abundances of molecular ions are calculated using the analytical formulas. The results of the no-sink models are as follows.
-
•
The column density of N2H+ shows a ring-like structure in the no-sink model with millimeter dust grains. Since the abundance of N2H+ is given by a non-linear function of CO and N2 abundances, it can reach a moderate value even in the cold N2 freeze-out region, depending on the abundances of CO and N2.
-
•
Even if the desorption energies of CO and N2 are the same, N2H+ abundance peaks at the temperature slightly below the CO (and N2) sublimation temperature, where the abundance ratio of CO to electron is .
-
•
Although the N2H+ ring is produced both in the full network model and in the no-sink model, the detailed distributions of N2H+ are different between the two models. In the no-sink model, N2H+ abundant layer is confined to a layer colder than the sublimation temperature of CO, while in the full-network model (i.e. with CO sink), N2H+ abundant layer extends to warmer layers. These models can thus be discriminated in observations if we can determine the vertical distribution of N2H+ in disks, specifically, starting with constraining the excitation temperature of N2H+ emission.
-
•
The column density of N2H+ in the no-sink model sensitively depends on the desorption rates of CO and N2.
-
•
If the cosmic ray does not reach the disk, the N2H+ column density is reduced by a factor of 20 in the model with CO sink, and by a factor of 70 in the no-sink model. The reduction is more significant in the model with lower desorption energy of CO, because N2H+ (i.e. CO freeze-out) is confined to a layer closer to the midplane, where X-ray ionization rate is lower.
Appendix A Reaction Rate Coefficients
We list the rate coefficients of the reactions relevant to the analytical formulas of molecular ions in Table 1. In the full network model, the spin state (ortho and para) of H is discriminated, and the reaction rates actually vary with the spin state. For those reactions, we use the rate coefficients from Garrod & Herbst (2006) in the analytical formulas, for simplicity.
| reaction | ||
|---|---|---|
| 1.61(-9)bb stands for | 0.0 | |
| 1.7(-9) | 0.0 | |
| 2.59(-8) | -0.5 | |
| 4.61(-8) | -0.5 | |
| 2.40(-7) | -0.69 | |
| 8.8(-10) | 0.0 | |
| 1.30(-8) | -0.84 | |
| 2.47(-7) | -0.84 |
Appendix B Dependence of N2H+ Abundance on Temperature
Figure 10 shows that N2H+ abundance reaches the maximum value at K in the 3-phase model, even if we assume the same desorption energy for CO and N2. Here we analyze the model to show that N2H+ abundance is maximized when the abundance ratio of CO to electron is .
At the density of cm-3, gas-phase recombination is more effective than the grain surface recombination. Then the analytic formula of the N2H+ abundance (eq. 21) becomes
| (B1) |
When the abundance ratio of CO to electron is higher than , which is about at K, the denominator is dominated by the second term. Substituting the analytical formula of H abundance (eq. 18) to (B1), it is straightforward to show that N2H+ abundance is proportional to (N2)/(CO), and thus increases with decreasing CO abundance at K. If the first term dominates in the denominator, on the other hand, N2H+ abundance is proportional to N2 abundance. The N2H+ abundance decreases with decreasing temperature at K.
References
- Acharyya et al. (2011) Acharyya, K., Hassel, G.E. & Herbst, E. 2011, ApJ, 732, 73
- Aikawa et al. (1997) Aikawa, Y., Umebayashi, T., Nakano, T & Miyama, S.M. 1997, ApJ, 486, L51
- Aikawa et al. (2001) Aikawa, Y., Ohashi, N., Inutsuka, S., Herbst, E. & Takakuwa, S. 2001, ApJ, 552, 639
- Aikawa et al. (2002) Aikawa, Y., van Zadelhoff, G.J., van Dishoeck, E.F. & Herbst, E. 2002, A&A, 386, 622
- Aikawa & Nomura (2006) Aikawa, Y. & Nomura, H. 2006, ApJ, 642, 1152
- Aikawa et al. (2008) Aikawa, Y., Wakelam, V., Garrod, R. T., & Herbst, E. 2008, ApJ, 674, 993
- Al-Halabi & van Dishoeck (2007) Al-Halabi, A. & van Dishoeck, E. F. 2007, MNRAS, 382, 1648
- Balbus & Hawley (1991) Baulbus, S.A. & Hawley, J.F. 1991, ApJ, 376, 214
- Bergin & Tafalla (2007) Bergin, E.A. & Tafalla, M. 2007, ARA&A45, 339
- Bergin et al. (2014) Bergin, E.A., Cleeves, L. I., Crockett, N. & Blake, G.A. 2014, Faraday Discussion 168, 61
- Caselli et al. (1998) Caselli, P., Walmsley, C. M., Terzieva, R., & Herbst, E. 1998, ApJ499, 234
- Caselli et al. (2002) Caselli, P., Stantcheva, T., Shalabiea, O., Shematovich, V. I., & Herbst, E. 2002, Planet. Space Sci., 50, 1257
- Cleeves et al. (2013) Cleeves, L.I., Adams, F.C. & Bergion, E.A. 2013, ApJ, 772, 5
- Cleeves et al. (2014) Cleeves, L. I., Bergin, Edwin A. & Adams, Fred C. 2014, ApJ, in press
- Collings et al. (2004) Collings, M. P., Anderson, M.A., Chen, Rui, Dever, J.W., Viti, S., Williams, D.A.& McCoustra, R.S. 2004, MNRAS, 354, 1133
- Dalgarno (2006) Dalgarno, A. 2006, PNAS, 103, 12269
- Favre et al. (2013) Favre, C., Cleeves, L.I., Bergin, E.A., Qi, C. & Blake, G.A. 2013, ApJ, 776, L38
- Fayolle et al. (2011) Fayolle, E. C., Bertin, M., Romanzin, C., et al. 2011, ApJ, 739, L36
- Fayolle et al. (2013) Fayolle, E. C., Bertin, M., Romanzin, C., et al. 2013, A&A, 556, 122
- Furuya et al. (2012) Furuya, K., Aikawa, Y., Tomida, K.,Matsumoto, T., Saigo, K., Tomisaka, K. Hersant, F. & Wakelam, V. 2012, ApJ, 758, 86
- Furuya et al. (2013) Furuya, K., Aikawa, Y., Nomura, H., Hersant, F. & Wakelam, V. 2013, ApJ, 779, 11
- Furuya & Aikawa (2014) Furuya, K. & Aikawa, Y. 2014, ApJ, 790, 97
- Garrod & Herbst (2006) Garrod, R.T. & Herbst, E. 2006, A&A, 457, 927
- Glassgold et al. (1997) Glassgold, A. E., Najita, J., & Igea, J. 1997, ApJ, 480, 344
- Gorti & Hollenbach (2008) Gorti, U. & Hollenbach, D. 2008, ApJ, 683, 287
- Gredel et al. (1989) Gredel, R., Lepp, S., Dalgrano, A., & Herbst, E. 1989, ApJ, 347, 289
- Hasegawa & Herbst (1993) Hasegawa, T.I. & Herbst, E. 1993, MNRAS, 261, 83
- Kamp & Dullemond (2004) Kamp, I. & Dullemond, C.P. 2004, ApJ, 615, 991
- Leger et al. (1985) Léger, A., Jura, M. & Omont, A. 1985, A&A, 144, 147
- Li et al. (2013) Li, X., Heays, A. N., Visser, R., Ubachs, W., Lewis, B. R., Gibson, S. T. & van Dishoeck, E. F. 2013, A&A 555, 14
- Maret et al. (2006) Maret, S., Bergin, E.A. & Lada, C. 2006, Nature, 442, 425
- Masunaga and Inutsuka (2000) Masunaga, H., & Inutsuka, S. 2000, ApJ, 531, 350
- Masunaga et al. (1998) Masunaga, H., Miyama, S. M., & Inutsuka, S. 1998, ApJ, 495, 346
- Mathis et al. (1977) Mathis, J.S., Rumpl, W. & Nordsieck, K.H. 1977, ApJ, 217, 425
- Nomura & Millar (2005) Nomura, H. & Millar, T.J. 2005, A&A, 438, 923
- Nomura et al. (2007) Nomura, H., Aikawa, Y., Tsujimoto, M., Nakagawa, Y. & Millar, T.J. 2007, ApJ, 661, 334
- Öberg et al. (2005) Öberg, K.I., van Broekhuizen,F, Fraser, H. J., Bisschop, S.E., van Dishoeck, E.F. & Schlemmer, S. 2005, ApJ, 621, L33
- Öberg et al. (2009a) Öberg, K. I., Linnartz, H., Visser, R., & van Dishoeck, E. F. 2009a, ApJ, 693, 1209
- Öberg et al. (2009b) Öberg, K. I., van Dishoeck, E. F., & Linnartz, H. 2009b, A&A, 496, 281
- Okuzumi (2009) Okuzumi, S. 2009, ApJ, 698, 1122
- Qi et al. (2008) Qi, C., Wilner, D. J., Aikawa, Y., Blake, G. A. & Hogerheijde, M. R. 2008, ApJ, 681, 1396
- Qi et la. (2013) Qi, C,, Öberg, K. I., & Wilner, D. J. 2013, ApJ, 765, 34
- Qi et al. (2013) Qi, C,, Öberg, K. I., Wilner, D. J., D’Alessio, P.,Bergin, E.A., Andrews, S. M., Blake, G. A., Hogerheijde, M. R., & van Dishoeck, E. F. 2013, Science, 341, 6146
- Tafalla et al. (2004) Tafalla, M., Myers, P.C., Caselli, P. & Walmsley, C.M. 2004, A&A, 416, 191 2002a, Planet. Space Sci., 50, 1257
- Umebayashi & Nakano (1981) Umebayashi, T., & Nakano, T. 1981, PASJ, 33, 617
- Umebayashi (1983) Umebayashi, T. 1983, Prog. Theo. Phys. 69, 480
- Umebayashi & Nakano (1988) Umebayashi, T. & Nakano, T. 1988, Prog. Theo. Phys. Suppl. 96, 151
- Umebayashi & Nakano (2009) Umebayashi, T., & Nakano, T. 2009, ApJ, 690, 69
- van der Tak et al. (2007) Van der Tak, F.F.S., Black, J.H., Schöier, F.L., Jansen, D.J., van Dishoeck, E.F. 2007, A&A 468, 627
- van Dishoeck et al. (2006) van Dishoeck, E. F., Jonkheid, B., & van Hemert, M. C. 2006, FaDi, 133, 231
- Weingartner & Draine (2001) Weingartner, J. C., & Draine, B. T. 2001, ApJ, 548, 296
- Williams & Cieza (2011) Williams, J. P. & Cieza, L. A. 2011, ARAA, 49, 67
| Element | Abundanceaa means . | Element | Abundance |
| H | 1.0 | He | 9.75(-2) |
| N | 2.47(-5) | O | 1.80(-4) |
| C | 7.86(-5) | S | 9.14(-8) |
| Si | 9.74(-9) | Fe | 2.74(-9) |
| Fe | 2.74(-9) | Na | 2.25(-9) |
| Mg | 1.09(-8) | ||
| Species | Abundance | Species | Abundance |
| H2O | 1.15(-4) | CO | 3.57(-5) |
| CO2 | 3.52(-6) | CH4 | 1.50(-5) |
| H2CO | 1.20(-5) | CH3OH | 6.50(-6) |
| N2 | 4.47(-6) | NH3 | 1.44(-5) |