Inhomogeneous screening near a dielectric interface
Abstract
Screening is one of the most important concepts in the study of charged systems. Near a dielectric interface, the ion distribution in a salt solution can be highly nonuniform. Here, we develop a theory that self-consistently treats the inhomogeneous screening effects. At higher concentrations when the bulk Debye screening length is comparable to the Bjerrum length, the double layer structure and interfacial properties are significantly affected by the inhomogeneous screening. In particular, the depletion zone is considerably wider than that predicted by the bulk screening approximation or the WKB approximation. For asymmetric salts, the inhomogeneous screening leads to enhanced charge separation and surface potential.
pacs:
82.45.Gj, 61.20.Qg, 05.20.-y, 68.03.CdScreening due to the ionic atmosphere, introduced by Debye and Hückel more than 90 years agoDebye , is one of the most important concepts in the study of charged systems. Screening has profound effects on essentially all properties of biophysical and salt-containing soft matter systemsIsraelachvili ; McQuarrie ; Andelmanreview ; Levinreview ; Hansen ; Honig ; Gelbart . In a homogeneous bulk solution, screening is most commonly manifested as an exponential damping of the long-range Coulomb interactions between two test charges. When the ion distribution is nonuniform, as in the vicinity of a charged surface or an interface with dielectric discontinuity, screening also becomes inhomogeneous. However, in spite of the ubiquity of systems with nonuniform ion distributions, a rigorous treatment of screening in such systems is still lacking.
For a salt solution near a dielectric interface, e.g., the water/air interface, the repulsive image force creates a depletion layer, whose theoretical treatment was pioneered by Onsager and Samaras (OS) onsager . This problem is related to a number of phenomena, such as conductivity in artificial and biological ion-channelsChannel1 ; Channel2 ; Channel3 ; Channel4 , stability of colloidal, bubble and protein suspensionsStability1 ; Stability2 ; Stability3 ; Stability4 , and the rate of ozone consumptionOzone1 ; Ozone2 . Assuming that the image force is screened by the bulk screening length, the OS theory qualitatively explains the excess surface tension and yields agreement with experimental data at low salt concentrations (). However, there is large discrepancy between the OS theory and experiment data at high salt concentrations ()surfacetension1 ; surfacetension2 . The OS theory predicts an ever decreasing width of the depletion layer with salt concentration, which results in a concave downwards curve for the surface tension vs. . In contrast, experimental data show essentially a linear increase of the surface tension. To reconcile this discrepancy, an exclusion zone of constant width or large hydration radius of the ion is usually invokedLevin1 ; Levin2 .
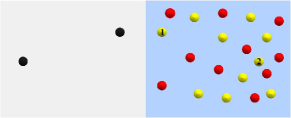
An obvious effect missing in the OS theoryonsager and in subsequent modificationsLevin1 ; Levin2 ; Levin3 ; Monica ; Bell2 ; Ninham ; Parsons ; Onuki1 ; Onuki2 ; Buyukdagli ; Dean ; Markovich is the spatially varying screening of the image force near a dielectric interface (see Fig. 1): the ion concentration changes gradually from zero at the interface to the bulk value. In this depletion layer, the ionic cloud is highly anisotropic, giving rise to different features of the screening near the interface from the homogeneous and isotropic bulk. Close to the interface, ions are strongly depleted; the local ionic strength around the test ion (Ion 1 in Fig. 1) is much lower than the bulk. The bulk screening approximation clearly overestimates the screening effect and hence underestimates the image force. Even for an ion approaching the bulk (Ion 2 in Fig. 1), the screening is still weaker than in the bulk due to the long-range, accumulative effects from the depletion zone. This feature extends the effective range of the image force beyond the Debye screening length. The WKB approximationBuff provides an approximate treatment of the inhomogeneous nature of screening by using the local ionic strength; however, it does not capture the long-range, accumulative effects.
Since approximate treatments cannot fully account for all the features of inhomogeneous screening, previous calculations using these approximations for the double layer structure and interfacial properties are likely to be inaccurate. Such inaccuracy in treating the essential electrostatic contributions makes it impossible to evaluate the relative importance of the various non-electrostatic effects invoked, for example, to explain the surface tension behavior, such as the cavity energyLevin1 ; Levin2 , hydrationLevin2 , and dispersion forcesNinham ; Parsons . In this Letter, we examine the issue of inhomogeneous screening in salt solutions near a dielectric interface, by comparing the result from numerical solution of the full Green function with results obtained using approximate methods. We find that the effects of inhomogeneous screening on the double layer structure and interfacial properties are quite pronounced as the Debye screening length becomes comparable to the Bjerrum length.
We have recently developed a general theory for weak-coupling systems with a fixed charge distribution in the presence of mobile cations with charge and anions with charge , in a dielectric medium of a spatially varying dielectric function Wangzg ; wang2 . The key result is the set of self-consistent equations for the mean electrostatic potential (nondimensionized by ), the Green function , and the self-energy of the ions:
| (1) |
| (2) |
| (3) |
where is the scaled permittivity and is the fugacity of ions. is introduced to constrain the mobile ions to the solvent region. is the local ionic strength, with the ion concentration given by . The short-range charge distribution on the ion is introduced to yield a finite Born solvation energy. Eq. 1 is the self-energy modified Poisson-Boltzmann equation, reflecting that the ion distribution is determined by both the mean electrostatic potential and the self energy. From Eqs. 2 and 3, the inhomogeneity in the ionic strength affects the solution of the Green function and the self energy, which consequently affect the double layer structure through Eq. 1.
We now specify to a salt solution in contact with a low dielectric medium through a sharp interface (at ) with fixed surface charge density . Mobile ions are excluded from the low dielectric side. Both and are then step functions: and for ; and for . In the solvent region (), Eq. 1 becomes
| (4) |
with boundary condition . Assuming the solvent has a uniform dielectric constant in the entire region, the Born energy is constant and can be absorbed into the reference chemical potential. The remaining contribution is finite in the point-charge limit [], leading to the nontrivial and nonsingular part of the self energy as .
To solve the Green function in the planar geometry, it is convenient to work in a cylindrical coordinate and use the Fourier representation in the transverse directions:
| (5) |
where is the 0th-order Bessel function. It is easy to show that satisfies:
| (6) |
for , with the boundary condition at boundary . can be considered the inverse of the local Debye screening length.
The bulk screening approximation widely used in the literature Monica ; onsager ; Levin1 ; Levin3 ; Levin2 ; Bell2 ; Ninham ; Parsons ; Onuki1 ; Onuki2 ; Buyukdagli ; Dean ; Markovich , replaces the spatially varying screening length in Eq. 6 by the constant bulk screening length , which enables an analytical solution for the Green function as , where and . Substituting into Eq. 5 leads to the following intuitive form for the self energy when :
| (7) |
with the dielectric contrast. The WKB approximationBuff ; wang1 ; Levine is simply to replace the bulk in Eq. 7 by the local .
In this work, we perform the full numerical calculation of the Green function using the finite difference methodnumerical ; Jiaotong . In order to ensure consistent numerical accuracy in removing the singularity of the same-point Green function, the free-space Green function satisfying , is also solved numerically along with Eq. 6. is then
| (8) |
Far away from the interface (), the ion concentration approaches the bulk value . It is straightforward to show Wangzg .
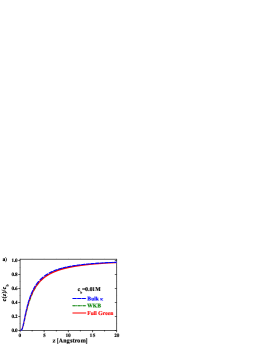
We now apply the theory to salt solutions near the water/air interface ( and ) with zero fixed surface charge (). This is the same system studied by Onsager and Samaras. Figure 2(a) and 2(b) show the concentration profile of the ions in a 1:1 salt solution for two bulk concentrations. At low salt concentrations when ( is the Bjerrum length), the effect of inhomogeneous screening is insignificant, because screening is weak even in the bulk. In this regime, both the bulk screening approximation and the WKB approximation are valid.
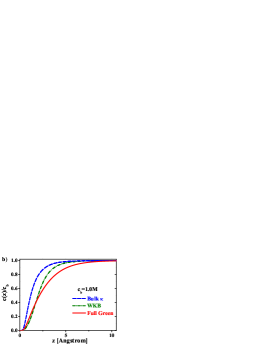
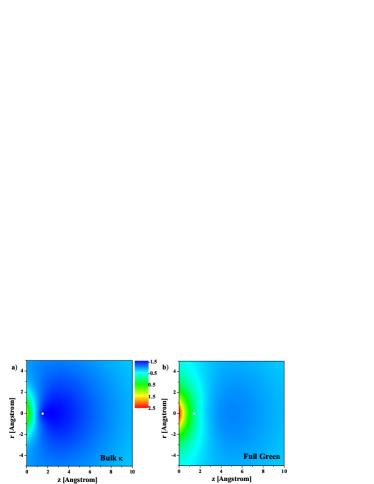
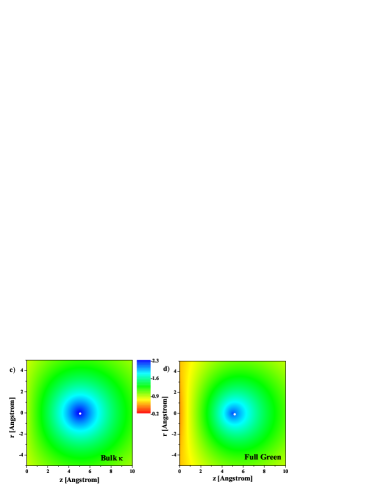
In contrast, at higher salt concentrations when becomes comparable to or even smaller than , inhomogeneous screening affects the entire range of the depletion layer as shown in Fig. 2(b). Close to the interface (), the ion concentration calculated by fully solving the Green function is significantly lower than that predicted by the bulk screening approximation, because the local ionic strength that screens the image force is obviously smaller than the bulk. In Figs. 3(a) and 3(b) we provide a more visual representation of inhomogeneous screening by plotting the nondivergent part of the Green function, , i.e., the nondivergent part of the linear response electrostatic potential generated by point charge at a given distance from the interface. The potential generated by the ion close to the interface () is much stronger than that predicted by the bulk screening approximation, the latter severely overestimating the local screening effect on the image charge interaction. Although this local effect is captured by the WKB approximation, neither of these two approximations capture the long-range and accumulative nature of the screening. The depletion layer calculated by fully solving the Green function extends to a range significantly longer than the bulk Debye screening length. As shown in Fig 3(d), even for an ion approaching the bulk solution (, which is larger than the bulk screening length of ), the electric field from its image charge is not screened out. This remaining image charge interaction in turn has a long-range and accumulative effect that reinforces the field at the position of the point charge. The two approximate methods become progressively poorer as the salt concentration increases.
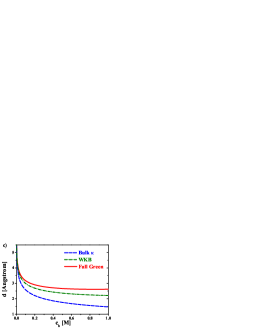
We define to characterize the width of the ion depletion layer, which is shown in Fig 2(c) as a function of the salt concentration. The two approximate methods predict to be an ever decreasing function of , determined by the bulk Debye screening length (). In contrast, calculated by fully solving the Green function deviates significantly from the results of the approximate methods as becomes comparable to , and reaches a constant value as further increases up to . Thus, at high salt concentrations the image-charge repulsion renormalized by the inhomogeneous screening creates a depletion layer of nearly constant width scaled by the Bjerrum length () in stead of and becomes nearly independent of the salt concentration.
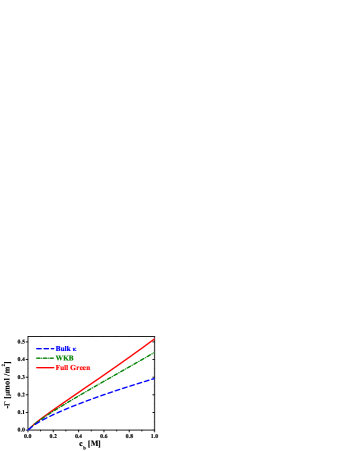
As a consequence of the different behavior in the width of the depletion layer due to inhomogeneous screening, there is pronounced difference in the negative adsorption of ions () at the interface between results obtained by fully solving the Green function and those using the approximate methods as shown in Fig 4. Because the approximate methods predict an ever decreasing as increases , is a concave downwards function of , as first shown by Onsager and Samarasonsager . However, experimentally both and the surface tension of the 1:1 salt solution increases essentially linearly with in the range of surfacetension1 ; surfacetension2 . To fit the experimental data, an ion-exclusion zone with constant width has been invoked in previous theoretical treatmentsLevin1 ; Levin2 . By fully accounting for the inhomogeneous screening, our theory naturally predicts that increases linearly with for , as a consequence of a nearly constant . In light of these results, it is quite possible that the inhomogeneous screening of the image force provides an explanation on the linear increase of the surface tension with the salt concentration; we are currently exploring this possibility.
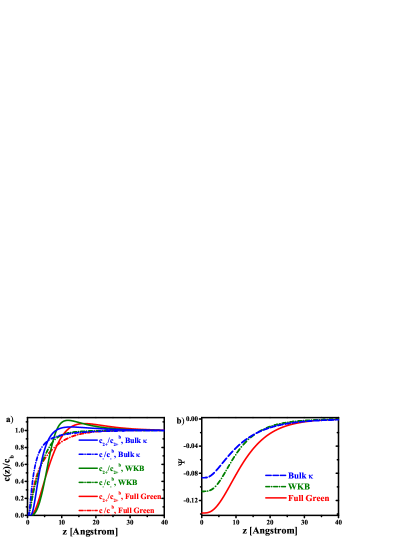
Inhomogeneous screening has an even more pronounced effect on asymmetric salt solutions containing multivalent ions, because multivalent ions are more strongly depleted than monovalent ions and are more effective in screening. For a 2:1 salt solution, the divalent cations calculated by fully solving the Green function are pushed further away from the interface than predicted by the approximate methods as shown in Fig 5(a), leading to a larger degree of charge separation. As a result, the induced electrostatic potential is much larger than that obtained using the approximate methods; see Fig. 5(b). Such a large self-induced surface potential can significantly affect the interpretation of the zeta potential of colloidal surfacesIsraelachvili and is a major contribution to the Jones-Ray effect in the surface tension of salt solutionOnuki2 ; JonesRay ; Bier ; wang3 .
In conclusion, we have presented a self-consistent treatment of the inhomogeneous screening in salt solutions near a dielectric interface. The effect of inhomogeneous screening is twofold: the lower ionic strength near the interface results in less screening on the image force and hence stronger ion depletion, and the depletion zone has a long-range and accumulative effect on screening, which extends the range of the depletion layer. Consequently, the ion distribution is significantly affected when the bulk screening length is comparable to or smaller than the Bjerrum length. In this regime, the double layer structure and the interfacial properties cannot be described by either the bulk screening approximation or the WKB approximation. The characteristic length of the depletion layer scales with the Bjerrum length, resulting in a linear increase of the negative adsorption of ions with concentration, in agreement with experiments. The inhomogeneous screening effect becomes is pronounced in the less polar solvent and for the ions of higher valency.
Nonuniform ion distribution near a dielectric interface exists in many colloidal and biophysical systems. An accurate treatment of inhomogeneous screening is important to fully understand the role of electrostatic interactions, which in turn is necessary for evaluating the various nonelectrostatic contributions, such as the cavity energy, hydration, and dispersion forces in these systems. The relative importance of these nonelectrostatic contributions, and even their existence, have been a subject of controversyNinhamrev . By a more accurate treatment of the inhomogeneous screening effect, we are in a better position to understand some long-standing problems, such as the specific ion effects and salt concentration effects in the surface tension.
Acknowledgment is made to the donors of the American Chemical Society Petroleum Research Fund for partial support of this research.
References
- (1) P. Debye and E. Hückel, Phys. Z., 24, 185 (1923).
- (2) J. N. Israelachvili, Intermolecular and Surface Forces, 2nd Ed. (Academic, London, 1992).
- (3) D. Andelman, in Soft Condensed Matter Physics in Molecular and Cell Biology, W. C. K. Poon and D. Andelman, eds. (Taylor and Francis, Boca Raton, Florida, 2000).
- (4) D. A. McQuarrie, Statistical Mechanics, (University Science Books, Sausalito, California, 2000).
- (5) Y. Levin, Rep. Prog. Phys., 65, 1577 (2002).
- (6) J. P. Hansen and H. Löwen, Annual Rev. Phys. Chem., 51, 209-242 (2000).
- (7) B. Honig and A. Nicholls, Science, 268, 1144 (1995). W.
- (8) M. Gelbart, R. F. Bruinsma, P. A. Pincus, and V. A. Parsegian, Phys. Today, 53, 38 (2000).
- (9) L. Onsager and N. N. T. Samaras, J. Chem. Phys., 2, 528 (1933).
- (10) C. Wagner, Phys. Z. 25, 474 (1924).
- (11) A. Parsegian, Nature, 221, 844 (1969).
- (12) T. Bastug and S. Kuyucak, Biophys. J., 84, 2871 (2003).
- (13) S. Buyukdagli, M. Manghi and J. Palmeri, Phys. Rev, Lett., 105, 158103 (2010).
- (14) E. D. Gomez, A. Panday, E. H. Feng, V. Chen, G. M. Stone, A. M. Minor, C. Kisielowski, K. H. Downing, O. Borodin, G. D. Smith, and N. P. Balsara, Nano Lett., 9, 1212-1216 (2009).
- (15) Tavares, F. W., Bratko, D., Prausnitz, J. M. Curr. Opin. Colloid Interface Sci. 9, 81 (2004).
- (16) Gradzielski, M. Curr. Opin. Colloid Interface Sci. 9, 256 (2004).
- (17) V. S. J. Craig, B. W. Ninham and R. M. Pashley, Nature 364, 317 (1993).
- (18) S. Kumar and R. Nussinov, Chembiochem 3, 604 (2002).
- (19) J. H. Hu, Q. Shi, P. Davidovits, D. R. Worsnop, M. S. Zahniser and C. E. Kolb, J. Phys. Chem., 99, 8768 (1995).
- (20) E. M. Knipping, M. J. Lakin, K. L. Foster, P. Jungwirth, D. J. Tobias, R. B. Gerber, D. Dabdub, and B. J. Finlayson-Pitts, Science, 288, 301 (2000).
- (21) N. Matubayasi, K. Yamamoto, S. Yamaguchi, H. Matsuo and N. Ikeda, J. Colloid Interface Sci., 214, 101 (1999).
- (22) N. Matubayasi, K. Tsunemoto, I. Sato, R. Akizuki, T. Morishita, A. Matuzawa, and Y. Natsukari, J. Colloid Interface Sci., 243, 444 (2001).
- (23) Y. Levin and J. E. Flores-Mena, Europhys. Lett., 56, 187 (2001).
- (24) Y. Levin, A. P. dos Santos and A. Diehl, Phys. Rev. Lett., 103, 257802 (2009).
- (25) A. Bakhshandeh, A. P. dos Santos and Y. Levin, Phys. Rev. Lett., 107, 107801 (2011).
- (26) J. W. Zwanikken and M. Olvera de la Cruz, Proc. Natl. Acad. Sci. USA, 110, 5301 (2013).
- (27) G. M. Bell and P. D. Rangecroft, Trans. Faraday Soc., 67, 649 (1971).
- (28) M. Boström, W. Kunz and B. W. Ninham, Langmuir, 21, 2619 (2005).
- (29) T. T. Duignan, D. F. Parsons and B. W. Ninham, J. Phys. Chem. B, 118, 8700 (2014).
- (30) A. Onuki, Phys. Rev. E, 73, 021506 (2006).
- (31) A. Onuki, J. Chem. Phys., 128, 224704 (2008).
- (32) S. Buyukdagli, M. Manghi and J. Palmeri, Phys. Rev. E, 81, 041601 (2010).
- (33) D. S. Dean and R. R. Horgan, Phys. Rev. E, 69, 061603 (2004).
- (34) T. Markovich, D. Andelman and R. Podgornik, Europhys. Lett., 106, 16002 (2014).
- (35) Z. -G. Wang, Phys. Rev. E, 81, 021501 (2010).
- (36) R. Wang and Z. -G. Wang, J. Chem. Phys., 142, 104705 (2015).
- (37) This boundary condition is obtained by combining the continuity of at with the form of the analytical solution for in the region.
- (38) R.R. Netz and H. Orland, Eur. Phys. J. E,11, 301 (2003).
- (39) F. P. Buff and F. H. Stillinger, J. Chem. Phys., 39, 1911 (1963).
- (40) G. M. Bell and S. Levine, J. Chem. Phys., 49, 4584 (1968).
- (41) R. Wang and Z. -G. Wang, J. Chem. Phys., 139, 124702, (2013).
- (42) For each , Eq. 6 is solved with 2000 grid points for the variable and 20000 grid points for the variable . We use different discretization between and to increase the numerical accuracy for the self energy of the ions very close to the interface. The Dirac delta function is approximated by the Kronecker delta. Numerical integration in the space (Eq. 8) is performed using the Simpson method with 200 grid points.
- (43) Z. L. Xu, M. M. Ma and P. Liu, Phys. Rev. E, 90, 013307 (2014).
- (44) M. E. Fisher and Y. Levin, Phys. Rev. Lett. 71, 3826 (1993).
- (45) G. Jones and W. A. Ray, J. Am. Chem. Soc. 59, 187 (1937).
- (46) M. Bier, J. Zwanikken and R.van Roij, Phys. Rev. Lett. 101, 046104 (2008).
- (47) R. Wang and Z.-G. Wang, J. Chem. Phys. 135, 014707 (2011).
- (48) K. Lum, D. Chandler, and J. D. Weeks, J. Phys. Chem. B 103, 4570 (2005); D. Chandler, Nature 437, 640 (2005).
- (49) S. Rajamani, T. M. Truskett, and S. Garde, Proc. Natl. Acad. Sci. U.S.A. 102, 9475 (2005).
- (50) M. Boström, D. R. M. Williams and B. W. Ninham, Langmuir 17, 4475 (2001).
- (51) P. L. Nostro and B. W. Ninham, Chem. Rev. 112, 2286 (2012).