Unusual A2142 supercluster with a collapsing core:
distribution of light and mass
Abstract
Context. Superclusters of galaxies can be used to test cosmological models of the formation and evolution of the largest structures in the cosmic web, and of galaxy and cluster evolution in superclusters.
Aims. We study the distribution, masses, and dynamical properties of galaxy groups in the A2142 supercluster.
Methods. We analyse the global luminosity density distribution in the supercluster and divide the supercluster into the high-density core and the low-density outskirts regions. We find galaxy groups and filaments in these regions, calculate their masses and mass-to-light ratios and analyse their dynamical state with 1D and 3D statistics. We use the spherical collapse model to study the dynamical state of the supercluster.
Results. In the A2142 supercluster rich groups and clusters lie along an almost straight line forming the Mpc long main body of the supercluster. The A2142 supercluster has a very high density core surrounded by lower-density outskirts. The total estimated mass of the supercluster is . More than a half of groups with at least ten member galaxies in the supercluster lie in the high-density core of the supercluster, centred at the X-ray cluster A2142. Most of the groups in the core region are multimodal. In the outskirts of the supercluster, the number of groups is larger than in the core, and groups are poorer. The orientation of the axis of the cluster A2142 follows the orientations of its X-ray substructures and radio halo, and is aligned along the supercluster axis. The high-density core of the supercluster with the global density and perhaps with may have started to collapse.
Conclusions. A2142 supercluster with collapsing core and straight body, is an unusual object among superclusters. In the course of the future evolution, the supercluster may split into several systems.
Key Words.:
large-scale structure of the Universe; galaxies: groups: general1 Introduction
Galaxy superclusters are the largest relatively isolated systems in the Universe (de Vaucouleurs 1956; Abell 1958; Jõeveer et al. 1978; Einasto et al. 1980b, 1984, 1994; Zucca et al. 1993). Superclusters, with their high-density environment and complex inner structure, are excellent laboratories with which to study the properties and evolution of galaxies and the groups of galaxies in them (Einasto et al. 2007b; Swinbank et al. 2007; Einasto et al. 2008; Gal et al. 2008; Faloon et al. 2013; Krause et al. 2013; Luparello et al. 2013; Schirmer et al. 2011; Einasto et al. 2014; Chon et al. 2014; Chow-Martínez et al. 2014; Lee et al. 2015).
The contemporary cosmological paradigm tells us that the formation and evolution of the cosmic web is governed by gravitational attraction of the dark matter (DM), and repulsion of the dark energy (DE). Superclusters, which are the largest galaxy systems in the Universe, can be used to test cosmological models in many different ways. Their sizes, richness, masses, and frequencies have to be reproduced by cosmological models (Einasto et al. 2006; Sheth & Diaferio 2011; Park et al. 2012), their evolution may lead to virialised structures in the future (Araya-Melo et al. 2009; Luparello et al. 2011; Chon et al. 2015), a few systems among them may already have started collapsing (Small et al. 1998; Reisenegger et al. 2000; Gramann & Suhhonenko 2002; Pearson et al. 2014; Teerikorpi et al. 2015). Nearby superclusters can be studied using galaxy velocity field (Tully et al. 2014). The spatial distribution of superclusters can be used as a test for characteristic scales in the cosmic web (Einasto et al. 1994, 1997b; Hong et al. 2012; Roukema et al. 2015). Superclusters may embed large amounts of warm-hot intergalactic medium (WHIM) (Rines et al. 2001; Nevalainen et al. 2014, and references therein). Superclusters and supervoids can leave imprints on the cosmic microwave background as hot and cold spots (Granett et al. 2008, and references therein).
Galaxy superclusters have complex inner structures which can be quantified with morphological descriptors such as Minkowski functionals. The morphology of superclusters can be used as a test for cosmological models (Kolokotronis et al. 2002; Einasto et al. 2007a, c). The morphology of superclusters has been studied, for example, by Costa-Duarte et al. (2011) and Einasto et al. (2007c). Einasto et al. (2007c, 2011c) found in the large morphological variety of superclusters two main types of superclusters, filaments and spiders. In filaments high-density core(s) of superclusters are connected by a small number of galaxy chains (filaments). In spiders there is a large number of galaxy chains between high-density cores in superclusters. Poor spider-type superclusters are similar to our Local Supercluster with one rich cluster and filaments of galaxies and poor groups of galaxies around it (Einasto et al. 2007c). Einasto et al. (2014) showed that galaxy content of filament- and spider-type superclusters differ: filament-type systems contain relatively more red, passive galaxies than spider-type systems. A large morphological variety of superclusters and their galaxy content has not yet reproduced by cosmological models (Einasto et al. 2007c, 2011d).
Among the galaxy superclusters analysed in Einasto et al. (2011c), the supercluster SCl 001 from Liivamägi et al. (2012) list of superclusters (we call it the A2142 supercluster because of the brightest galaxy cluster in the supercluster, Abell cluster A2142) has an exceptional shape and density. The main body of the supercluster is a Mpc straight filament of galaxy groups and clusters, it is the only supercluster in the study by Einasto et al. (2011c) with such a shape. In addition, in this supercluster the value of the luminosity density in the Sloan Digital Sky Survey (SDSS) is the highest (Liivamägi et al. 2012). Exceptional objects are always interesting; they may represent a challenge for cosmological models (Einasto et al. 2007c; Sheth & Diaferio 2011; Park et al. 2012).
The goal of the present study is to analyse the structure of the A2142 supercluster as determined by galaxy groups, clusters, filaments and single galaxies. We analyse the global density distribution in the supercluster, divide the supercluster into a high-density core and lower-density outskirts regions, and analyse the properties of these regions. We apply 1D and 3D tests as estimators of the dynamical state of groups and clusters in regions of different global density. We use a spherical collapse model to find whether this supercluster may already be collapsing. In a forthcoming paper we shall analyse the galaxy populations in the A2142 supercluster. This is the first detailed study of the A2142 supercluster.
At http://www.aai.ee/~maret/SCl1structure.html we present an interactive 3D model showing the distribution of galaxies in the regions of different global density in the A2142 supercluster.
We assume the standard cosmological parameters: the Hubble parameter km s-1 Mpc-1, the matter density , and the dark energy density (Komatsu et al. 2011).
2 Data
We use the MAIN sample of the 8th and 10th data release of the Sloan Digital Sky Survey (Aihara et al. 2011; Ahn et al. 2014) with the apparent Galactic extinction corrected magnitudes , and the redshifts . We corrected the redshifts of galaxies for the motion relative to the CMB and computed the comoving distances (Martínez & Saar 2002) of galaxies. For details of sample selection we refer to Liivamägi et al. (2012), Tempel et al. (2012), and Tempel et al. (2014b).
2.1 Luminosity density field and superclusters
We calculate the galaxy luminosity density field to reconstruct the underlying matter distribution, and to determine superclusters (extended systems of galaxies) in the luminosity density field at the smoothing length 8 Mpc using spline kernel. We created a set of density contours by choosing a density thresholds and defined connected volumes above a certain density threshold as superclusters. In order to choose the proper density level for determining individual superclusters, we analysed the properties of the density field superclusters at a series of density levels. As a result we used the density level (in units of mean density, = 1.65 ) to determine individual superclusters. At this density level superclusters in the richest chains of superclusters in the volume under study still form separate systems; at lower density levels they join into huge percolating systems. At higher threshold density levels superclusters are smaller and there are fewer superclusters. The calculation of the luminosity density field and determination of superclusters is described in detail in Liivamägi et al. (2012).
The morphology of superclusters up to a distance of Mpc was determined in Einasto et al. (2012a) who classified superclusters as filaments and spiders on the basis of their morphological information and visual appearance. The details about supercluster morphology are given in Einasto et al. (2007c, 2011c).
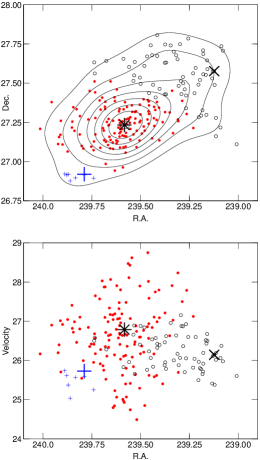
In Table 1 we present data about the A2142 supercluster, classified as a filament-type in Einasto et al. (2011c). The maximum global density in A2142 supercluster is , this is the highest in the whole SDSS volume (in Liivamägi et al. 2012, the volume used to determine superclusters was ). Figure 1 shows the location of the A2142 supercluster among neighbouring relatively rich superclusters. The A2142 supercluster is surrounded by voids. The nearest rich supercluster to the A2142 supercluster is the Corona Borealis supercluster at the distance of about Mpc. The distribution of rich superclusters was described in more detail in Einasto et al. (2011c). In Fig. 2 we plot the sky distribution of galaxies in the A2142 supercluster. Figure 2 shows that galaxy groups and clusters in this supercluster lie along an almost straight line on the plane of the sky. Such a straight filament as the main body of the supercluster is unique among superclusters analysed in Einasto et al. (2011c).
| (1) | (2) | (3) | (4) | (5) | (6) | (7) | (8) |
|---|---|---|---|---|---|---|---|
| ID | |||||||
| [ Mpc] | [] | [ Mpc] | |||||
| 239+027+009 | 1038 | 108 | 14 | 264.5 | 1591.5 | 50.3 | 21.6 |

2.2 Galaxy groups
We selected galaxy groups belonging to the A2142 supercluster from the group catalogue based on the 10th data release of the Sloan Digital Sky Survey by Tempel et al. (2014b). In this catalogue galaxy groups were determined using the friends-of-friends cluster analysis method introduced in cosmology by Zeldovich et al. (1982) and Huchra & Geller (1982). A galaxy belongs to a group of galaxies if this galaxy has at least one group member galaxy closer than a linking length. In a flux-limited sample the density of galaxies slowly decreases with distance. To take this selection effect into account properly when constructing a group catalogue from a flux-limited sample, the linking length was rescaled with distance, calibrating the scaling relation by observed groups. As a result, the maximum sizes in the sky projection and the velocity dispersions of our groups are similar at all distances. The details about the data reduction, the group finding procedure, and the description of the group catalogue can be found in Tempel et al. (2014b).
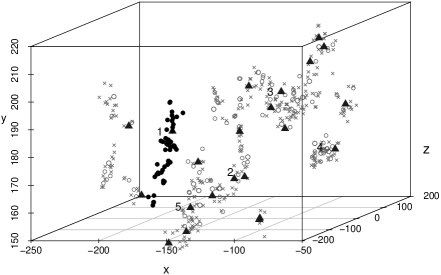
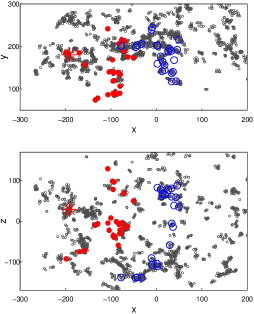
The A2142 supercluster embeds 14 galaxy groups with at least ten member galaxies. We list them in Table LABEL:tab:gr10. The richest group, Gr 3070, corresponds to the Abell cluster A2142. Figure 3 shows the distribution of galaxy groups in cartesian coordinates. Galaxy groups in the A2142 supercluster cover only a narrow distance interval ( Mpc, Table LABEL:tab:gr10); therefore, we use group data from flux-limited group catalogue.
| (1) | (2) | (3) | (4) | (5) | (6) | (7) | (8) | (9) | (10) | (11) | (12) |
|---|---|---|---|---|---|---|---|---|---|---|---|
| No. | ID | ||||||||||
| [deg] | [deg] | [ Mpc] | [ Mpc] | [] | [] | [/] | |||||
| 1 | 10570 | 27 | 238.53 | 27.47 | 268.57 | 247.76 | 1.26 | 51.3 | 59.5 | 116.2 | 13.65 |
| 2 | 3070 | 212 | 239.52 | 27.32 | 264.64 | 769.02 | 2.39 | 382.0 | 906.5 | 237.3 | 20.70 |
| 3 | 4952 | 54 | 239.78 | 26.56 | 260.11 | 447.24 | 1.30 | 111.0 | 214.4 | 193.1 | 17.13 |
| 4 | 32074 | 11 | 240.11 | 26.71 | 262.42 | 337.05 | 0.61 | 15.7 | 59.5 | 378.2 | 19.89 |
| 5 | 35107 | 10 | 240.13 | 27.01 | 258.69 | 221.02 | 0.77 | 13.9 | 30.3 | 218.4 | 14.20 |
| 6 | 14960 | 27 | 240.20 | 25.87 | 263.58 | 382.58 | 1.30 | 46.6 | 147.5 | 316.6 | 15.32 |
| 7 | 17779 | 20 | 240.38 | 26.16 | 261.06 | 371.74 | 1.15 | 35.1 | 104.1 | 296.9 | 16.39 |
| 8 | 6885 | 32 | 240.75 | 25.40 | 258.85 | 428.12 | 1.22 | 70.5 | 164.1 | 232.8 | 11.38 |
| 9 | 21183 | 21 | 240.83 | 26.95 | 265.02 | 280.10 | 1.29 | 36.5 | 61.2 | 167.6 | 15.20 |
| 10 | 20324 | 11 | 240.95 | 24.95 | 259.72 | 335.77 | 0.73 | 17.4 | 77.5 | 446.2 | 10.42 |
| 11 | 10818 | 28 | 241.23 | 24.52 | 259.56 | 328.02 | 1.29 | 51.3 | 105.1 | 205.1 | 9.31 |
| 12 | 14283 | 19 | 241.90 | 23.21 | 260.28 | 323.03 | 0.86 | 34.4 | 65.1 | 189.0 | 7.27 |
| 13 | 10224 | 32 | 242.91 | 21.02 | 254.55 | 633.40 | 0.86 | 60.4 | 232.5 | 385.0 | 6.01 |
| 14 | 26895 | 12 | 243.08 | 20.77 | 254.80 | 257.42 | 0.92 | 16.5 | 49.1 | 297.9 | 5.91 |
2.3 Galaxy filaments
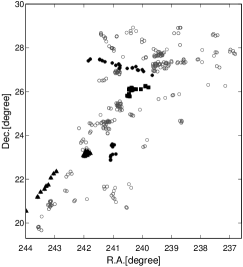
We use the catalogue of galaxy filaments from the flux-limited filament catalogue by Tempel et al. (2014a) that was built by applying the Bisous process to the distribution of galaxies as outlined in Tempel et al. (2014a). From this catalogue we extracted galaxy filaments which had at least one member galaxy from the A2142 supercluster with distance Mpc from the filament axis, as defined for filament members in Tempel et al. (2014a). From this initial sample we included in our sample of A2142 filaments those with member galaxies with global density . With this limit we excluded those filaments that were outgoing from the supercluster to the surrounding voids. Our final filament list contains 31 filaments, four which are longer than Mpc: F00580 with the length of Mpc, F03116 with the length of Mpc, F03894 with the length of Mpc, and F04462 with the length of Mpc. The shortest galaxy filaments in the A2142 supercluster are Mpc long; the median length of filaments shorter than Mpc is Mpc. In total, approximately one-third of all galaxies in the A2142 supercluster are filament members. The distribution of galaxies in filaments in the sky is plotted in Fig. 4. Figure 4 shows filaments radially going out of the central part of the supercluster. This is more clearly seen from the 3D model at our web pages. We plan to study this feature and other properties of galaxy filaments in the A2142 supercluster in more detail in a separate paper.
Catalogues of galaxy superclusters, groups and filaments used in this study are available from the database of cosmology-related catalogues at http://cosmodb.to.ee/.
3 Methods
3.1 Multidimensional normal mixture modelling
To search for possible components (substructure) in clusters, we employ multidimensional normal mixture modelling based on the analysis of a finite mixture of distributions, in which each mixture component is taken to correspond to a different component or subgroup in sky coordinates and velocity of galaxies in groups and clusters. The most common component distribution considered in model-based clustering is a multivariate Gaussian (or normal) distribution. To model the collection of components, we apply the Mclust package for classification and clustering (Fraley & Raftery 2006) from R, an open-source free statistical environment developed under the GNU GPL (Ihaka & Gentleman 1996, http://www.r-project.org). This package searches for an optimal model for the clustering of the data among models with varying shape, orientation, and volume, finds the optimal number of components and the corresponding classification (the membership of each component). For every galaxy, Mclust calculates the probability of it belonging to any of the components. The uncertainty of classification is defined as one minus the highest probability that a galaxy belongs to a component. The mean uncertainty for the full sample is used as a statistical estimate of the reliability of the results.
In Einasto et al. (2012b) we tested how the possible errors in the line-of-sight positions of galaxies affect the results of Mclust, randomly shifting the peculiar velocities of galaxies 1000 times and searching each time for the components with Mclust. The random shifts were chosen from a Gaussian distribution with the dispersion equal to the velocity dispersion of galaxies in a cluster. The number of the components found by Mclust remained unchanged, demonstrating that the results of Mclust are not sensitive to such errors.
3.2 One-dimensional tests
One indicator of multimodality in clusters is the deviation of the distribution of the galaxy velocities in clusters from a Gaussian. An early use of the Gaussianity test was by Einasto (1952, 1954) where it was applied to test the homogeneity of stellar populations in our Galaxy. We tested the hypothesis of the Gaussian distribution of the peculiar velocities of galaxies in clusters with the Shapiro-Wilk normality test (Shapiro 1965), which is considered the best for small samples, and with the Anderson-Darling test, which is very reliable according to Hou et al. (2009). To test for the asymmetry of the distributions of galaxy velocities we calculated the kurtosis of the peculiar velocity distribution using the Anscombe-Glynn test (Anscombe & Glynn 1983) from the package moments by L. Komsta and F. Novomestky. Kinematic models show that the shape of the velocity distribution of galaxies in groups is defined by the ratio of different types of galaxy orbits (Merritt 1987). The tests described here serve mostly to check if the galaxy velocity distribution is unimodal and symmetrical.
In virialised clusters galaxies follow the potential well of the cluster. We would expect that the main galaxies in clusters lie at the centres of groups (group haloes) and have small peculiar velocities (Ostriker & Tremaine 1975; Merritt 1984; Malumuth 1992). Therefore we calculated the peculiar velocities of the main galaxies and the normalised peculiar velocities of the main galaxies, , where is group rms velocity. In the group catalogue the main galaxy of a group is defined as the most luminous galaxy in the -band. We also use this definition in the present paper. Einasto et al. (2012b) showed for very rich groups with that in groups with the peculiar velocities of the main galaxies () main galaxies are located near the centre of the group. Higher peculiar velocities of the main galaxies suggest that the main galaxy is located far from the centre, a sign of a possible dynamically young group.
Recently Ribeiro et al. (2013) used several methods to analyse the structure and dynamical state of galaxy groups and showed that these methods give quite reliable results for groups with more than ten member galaxies. To be on the safe side, we applied 3D normal mixture modelling to groups with , and used groups with in 1D tests.
4 Results
4.1 Luminosity density distribution in the A2142 supercluster
| (1) | (2) | (3) | (4) | (5) | (6) | (7) | (8) | (9) | (10) | (11) |
| [] | [] | [] | [h/] | [h/] | ||||||
| Full scl | 1038 | 0.21 | 14 | 93 | 31 | 2.90 | 4.33 | 15.1 | 192 | 287 |
| 300 | 0.03 | 3 | 8 | 1 | 1.21 | 1.38 | 5.3 | 226 | 260 | |
| 167 | 0.10 | 5 | 8 | 2 | 0.48 | 0.62 | 2.5 | 198 | 248 | |
| 197 | 0.29 | 3 | 24 | 5 | 0.54 | 0.90 | 2.9 | 186 | 310 | |
| 374 | 0.35 | 3 | 53 | 11 | 0.67 | 1.41 | 4.3 | 156 | 398 |

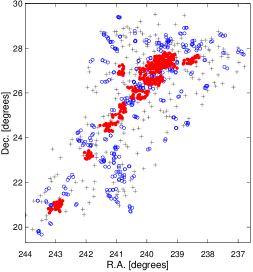
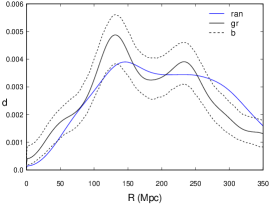
Figure 5 shows the probability density distribution of the global densities around galaxies in the A2142 supercluster. This distribution shows several maxima and minima that can be used to divide the supercluster into several global density regions. Table LABEL:tab:D8prop summarises the properties of these global density regions in A2142 supercluster, their galaxy, group, and filament content, masses, and mass-to-light ratios. In Fig. 6 we show the sky distribution of galaxies in different global density regions. At http://www.aai.ee/~maret/SCl1structure.html we present an interactive 3D version of Fig. 6.
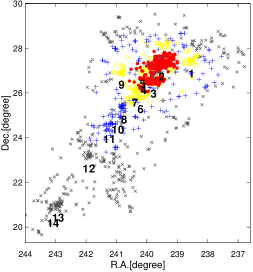
In the highest density core of A2142 supercluster global density is as high as , the radius of this region is Mpc. Here lie rich clusters A2142 (Gr 3070 in Table LABEL:tab:gr10) and Gr 4952 with 54 galaxies. The region with and radius approximately Mpc embeds five rich groups and clusters (see Table LABEL:tab:gr10). These regions form the high-density core of the supercluster which morphologically resembles a spider with many short outgoing filaments.
In the intermediate global density region where lie three rich groups, the richest group has 28 member galaxies. Three rich groups lie in the outskirts of the supercluster with global density . The global density limit is approximately the same as the density limit between high-density cores of rich superclusters and their outskirts (Einasto et al. 2007b). Figure 6 shows that rich groups and clusters in the A2142 supercluster lie along a straight line in the sky plane, forming the Mpc long main body of the supercluster. The high-density core of the supercluster occupies approximately one-third of the size of the supercluster, and two-thirds is covered by a lower density ”tail”, therefore the supercluster as a whole is classified as being of filament morphology (Einasto et al. 2011c). The number of poor groups with less than ten galaxies is more than three times higher in the outskirts than in the core region; these groups are mostly very poor, with two or three member galaxies.
Table LABEL:tab:D8prop shows that the highest density core of A2142 supercluster contains almost 30% of all galaxies from A2142 supercluster. Almost all galaxies here belong to galaxy groups; only 3% of galaxies are single. At lower global densities the fraction of single galaxies increases, and in the outskirts of supercluster they form about one-third of galaxy populations.
In Table LABEL:tab:D8prop we give the number of galaxy filaments in each global density region. Here we list only those filaments that are fully inside a given global density region. In our list of filaments twelve cross several global density regions. For example, the Mpc filament F03116 starts in the highest density core of the supercluster and extends to the outskirts of the supercluster. Other filaments longer than Mpc lie in the global density region with out of high-density core of the supercluster. Table LABEL:tab:D8prop shows that the number of galaxy filaments increases in the outskirts of the supercluster.
4.2 Masses and mass-to-light ratios
To calculate total masses and mass-to-light ratios of galaxy groups in the regions of different global density we used dynamical masses of galaxy groups calculated in Tempel et al. (2014b). To calculate masses of galaxy groups Tempel et al. (2014b) used virial theorem, assuming symmetry of galaxy velocity distribution and the Navarro-Frenk-White (NFW) density profile for galaxy distribution in the plane of the sky. For a detailed description how the dynamical masses of groups were calculated we refer to Tempel et al. (2014b). For groups with and we use the median values of group masses. We also calculated stellar-to-dynamical mass ratios for groups in the core and in the outskirts of the superclusters. Data about the stellar masses of galaxies were taken from the MPA-JHU spectroscopic catalogue (Tremonti et al. 2004; Brinchmann et al. 2004) in the SDSS CAS database. In this catalogue the different properties of galaxies are obtained by fitting SDSS photometry and spectra with the stellar population synthesis models developed by Bruzual & Charlot (2003). The stellar masses of galaxies are estimated from the galaxy photometry (Kauffmann et al. 2003).
Table LABEL:tab:D8prop presents sums of dynamical masses of galaxy groups and mass-to-light ratios in the high-density core and the outskirts of the A2142 supercluster. Two mass values are given. First, we give the sums of the dynamical masses of galaxy groups in a region. In the second case we add to this the estimated mass of faint galaxy groups as follows. In each region some galaxies are single. They may be the brightest galaxies of faint groups in which other member galaxies are too faint to be observed within SDSS survey magnitude limits (Tempel et al. 2009). We estimated the masses of these faint groups using the number of single galaxies in a region, and median masses of groups with less then five member galaxies. In addition, the mass of intracluster gas is about 10% of the total mass (Chiu et al. 2014), we added this to the estimated mass and mass-to-luminosity ratio of each global density region ( and in Table LABEL:tab:D8prop).
Table LABEL:tab:D8prop gives the values of masses for , as used in the present paper. The total estimated mass of the supercluster is for (Planck Collaboration et al. 2015).
Table LABEL:tab:D8prop shows that the highest density regions () with their rich clusters contain most of the mass and most of the light of the supercluster, if we calculate masses using group dynamical masses. In the outskirts of the supercluster the estimated mass is approximately twice as large as the sum of dynamical mass of galaxy groups. The supercluster total estimated mass is approximately 1.5 times larger than the sum of dynamical mass of galaxy groups and clusters. Chon et al. (2014) showed that the bias factor of the mass of superclusters constructed using galaxy groups and clusters is approximately 1.83. This suggests that we may still underestimate the total mass of the supercluster.
The ratio of stellar masses to dynamical masses of groups is in the high-density core of the supercluster, and in the outskirts of supercluster. Several studies have shown that stellar mass-to-total mass ratio increases toward lower halo masses; this may be the reason why this ratio is larger in the supercluster outskirts where poor groups dominate than in the core region of the supercluster (Andreon 2010; Bahcall & Kulier 2014; Patel et al. 2015).
Mean dynamical mass-to-light ratios have the highest values in the high-density core of the supercluster, and the lowest values in the outskirts where poor groups with lower values of dominate. Estimated mass-to-light ratios have higher values in the supercluster outskirts where the fraction of single galaxies is the highest, and the difference between the dynamical masses and estimated masses is the highest.
In Table LABEL:tab:gr10 we give dynamical masses, total luminosities, and mass-to-light ratios for galaxy groups with at least ten member galaxies.
Bahcall & Kulier (2014) showed that mass-to-light ratios for groups . In our sample only four groups have (Table LABEL:tab:gr10). These are either rather poor groups with eleven member galaxies or groups with substructure for which dynamical masses are not reliable. Mean dynamical group mass-to-light ratios are lower in the supercluster outskirts regions with lower global density (Table LABEL:tab:D8prop). Eight groups with at least ten member galaxies lie in the high-density core of the supercluster while the low density outskirts is mainly populated by poor groups. So the decrease in at lower global densities probably reflects group richness distribution, in agreement with Bahcall & Kulier (2014) who showed that mass-to-light ratios of groups have lower values for poor groups, and does not depend on large-scale environment of groups.
We also calculated stellar masses of groups with at least ten member galaxies and stellar-to-dynamical mass ratios. The median value of the stellar-to-dynamical mass ratio for these groups is , in agreement with other studies, which have found that the fraction of stellar mass in groups and clusters is about 1% of the total mass of clusters (Chiu et al. 2014, and references therein).
Recently, different methods to calculate galaxy group and cluster masses, and their uncertainties were discussed by Noh & Cohn (2012); Tully (2015a, b). Old et al. (2014) and Old et al. (2015) compared several mass estimation methods using simulated mock galaxy catalogues. The compared mass estimation methods can be divided into several classes: abundance matching, richness-based methods, virial theorem, various phase-space based methods, caustic technique (see Old et al. 2014, 2015, for references and more details about various methods). According to the comparison results the virial theorem based method used in Tempel et al. (2014b) produces quite reliable masses with reasonable scatter compared with the true masses of the galaxy groups/clusters.
4.3 Dynamical state of groups
Table LABEL:tab:dyn10 presents the results of the 3D and the 1D tests for groups with at least ten member galaxies. The number of components determined with the 3D normal mixture modelling is denoted as . For the 1D test we give the statistical significance of the deviations from Gaussianity in their galaxy distributions (the -values: means statistically highly significant deviations from Gaussianity). The -values for the Anderson-Darling and Shapiro-Wilk Gaussianity tests are denoted, correspondingly, and . The -value for the kurtosis test is . We also give in this table the values of the peculiar velocities and normalised peculiar velocities, and . The uncertainty of the 3D normal mixture modelling was less than for all clusters, we do not show this in the table.
| (1) | (2) | (3) | (4) | (5) | (6) | (7) | (8) |
| No. | |||||||
| High-density core of the supercluster | |||||||
| 1 | 27 | 236.4 | 0.95 | 2 | 0.330 | 0.312 | 0.835 |
| 2 | 212 | 334.4 | 0.43 | 3 | 0.178 | 0.170 | 0.687 |
| 3 | 54 | 148.6 | 0.33 | 3 | 0.002 | 0.012 | 0.806 |
| 4 | 11 | 284.1 | 0.84 | 1 | 0.137 | 0.194 | 0.063 |
| 5 | 10 | 387.4 | 1.75 | 1 | 0.470 | 0.453 | 0.275 |
| 6 | 27 | 607.5 | 1.59 | 2 | 0.171 | 0.143 | 0.038 |
| 7 | 20 | 565.8 | 1.52 | 1 | 0.502 | 0.525 | 0.819 |
| 9 | 21 | 292.6 | 1.04 | 4 | 0.117 | 0.083 | 0.581 |
| Low-density outskirts of the supercluster | |||||||
| 8 | 32 | 659.3 | 1.54 | 1 | 0.764 | 0.623 | 0.892 |
| 10 | 11 | 394.5 | 1.17 | 1 | 0.229 | 0.150 | 0.074 |
| 11 | 28 | 55.7 | 0.17 | 3 | 0.409 | 0.494 | 0.475 |
| 12 | 19 | 358.6 | 1.11 | 1 | 0.874 | 0.894 | 0.897 |
| 13 | 32 | 651.1 | 1.03 | 3 | 0.024 | 0.028 | 0.002 |
| 14 | 12 | 389.5 | 1.51 | 1 | 0.855 | 0.649 | 0.344 |
Table LABEL:tab:dyn10 shows that among galaxy groups with in the high-density core of the supercluster seven are multicomponent groups suggesting that these groups are dynamically active. Only one group here is unimodal (no. 7). This group lies in the outer region of the high-density core of the supercluster. In the outskirts of the supercluster there are both unimodal and multimodal groups.
According to the 1D tests only two groups have and showing statistically highly significant deviations from Gaussian distribution. Group Gr4952 (no. 3 in Table LABEL:tab:dyn10) is located in supercluster high-density core and Gr10224 (no. 13) in the outskirts of supercluster.
The two most Gaussian groups with the highest -values from the 1D tests in the A2142 supercluster are groups Gr14283 (no. 12), and Gr26895 (no. 14) located out of supercluster high-density core with global density and (Table LABEL:tab:gr10).
Only for one group in the high-density core of the supercluster (no. 3 with 54 member galaxies in Table LABEL:tab:dyn10) and for one group in the outskirts (no. 11 with 28 member galaxies) both the peculiar velocity and the normalised peculiar velocity of its main galaxy have lower values than the limits and , which suggests that the main galaxy is located close to the centre of the group (Einasto et al. 2012b). In all other groups the main galaxy has large peculiar and/or normalised peculiar velocity, a possible sign that the groups are still dynamically active. Even group no. 3 with three components is not virialised yet; here the main galaxy lies in the central component.
| (1) | (2) | (3) | (4) | (5) | (6) | (7) |
| [deg] | [deg] | [ | ||||
| 212 | 239.5 | 27.3 | 264.6 | 769.0 | 906 | |
| 135 | 239.6 | 27.2 | 266.3 | 851.9 | 707 | |
| 64 | 239.3 | 27.5 | 262.3 | 406.0 | 196 | |
| 8 | 239.8 | 26.9 | 254.9 | 235.7 | 15 |
4.4 Abell cluster A2142
In Fig. 7 we show the distribution of galaxies from three components detected with Mclust in the Abell cluster A2142 (the richest group in the A2142 supercluster, Gr3070). We show also the overall density distribution of galaxies in the cluster. We note that the orientation of density contour ellipses coincides with the orientation of the supercluster axis as determined by groups of galaxies (see, e.g. Fig. 6 and the other figures showing sky distribution of galaxies and groups in the A2142 supercluster).
The centre coordinates, velocity dispersions, and dynamical masses of the components in this group are given in Table LABEL:tab:a2142. Five galaxies do not belong to any component. Table LABEL:tab:dyn10 shows that 1D tests did not detect statistically significant deviations from Gaussianity, and the reason can be seen in Fig. 7, where the distribution of galaxy velocities in the components of this group partially overlap and cannot be clearly distinguished.
The main galaxy of the group is located in the centre of the main component. In the second and third components the brightest galaxy lies near the edge of the component (Fig. 7).
A2142 is a well-known cold front X-ray cluster with a radio halo that shows signs of merging and sloshing (Markevitch et al. 2000; Forman et al. 2001; Owers et al. 2011; Rossetti et al. 2013; Farnsworth et al. 2013; Munari et al. 2014). Rossetti et al. (2013) describe A2142 as a unique cluster with giant radio halo where the sloshing occurs at much larger scales compared to simulations and to most clusters with sloshing cold fronts, up to about Mpc. X-ray studies show a complex substructure in this cluster (Okabe & Umetsu 2008; Umetsu et al. 2009). Rossetti et al. (2013) suggest that the cluster A2142 shows indication for a merger mainly along the line of sight, which could trigger the radio emission without significantly disturbing the X-ray morphology.
Comparison with the X-ray and radio studies shows that the orientation of optical components of the cluster A2142 (Fig. 7) follows the orientation of the radio halo and X-ray substructure, as seen, for example, from Fig. 14 in Owers et al. (2011), Fig. 7 in Rossetti et al. (2013) and Fig. 11 in Farnsworth et al. (2013). In addition, the orientation of the cluster A2142 follows the orientation of the whole supercluster. The similarity of orientations is related to the very different scales (approximately Mpc of X-ray and radio haloes, Mpc (A2142 maximum radius) of the cluster itself, and about Mpc of the full supercluster).
Munari et al. (2014) found that mass profiles of A2142 as determined by red and blue galaxies are different. This may be due to the different galaxy content of A2142 components. We analyse this in a forthcoming paper.
Several X-ray and other studies studies have found that the mass of A2142 is approximately (Okabe & Umetsu 2008; Umetsu et al. 2009; Wojtak & Łokas 2010; Munari et al. 2014; Shan et al. 2015). Munari et al. (2014) compared several mass estimation methods and concluded that the mass of the cluster is (if recalculated to the Hubble parameter km s-1 Mpc-1, as used in our paper); this value is 0.965 times lower than the dynamical mass of A2142 as calculated in Tempel et al. (2014b). This shows that the masses in Tempel et al. (2014b) are quite precise.
Recently, Eckert et al. (2014) reported the discovery of an infalling group of galaxies in A2142 at degrees and degrees. Galaxies in this group probably belong to the main component of this cluster. Another possible merging group near the group Gr10570 was detected by Kawahara et al. (2011).
We also calculated stellar masses of galaxies in components , and the ratios of stellar-to-dynamical masses, . The ratios , and in the first, second, and third component, respectively. This is in agreement with the studies of galaxy groups which have found that stellar mass-to-total mass ratio decreases toward higher group masses (see references in the previous section).
5 Discussion and conclusions
5.1 A2142 supercluster: a collapsing system?
We applied the spherical collapse model to study the dynamical state of the A2142 supercluster. This model has been used to study the superclusters in several papers (Small et al. 1998; Gramann & Suhhonenko 2002; Reisenegger et al. 2000; Proust et al. 2006; Araya-Melo et al. 2009; Pearson et al. 2014). The spherical collapse model describes the evolution of a spherically symmetric perturbation in an expanding universe. The first essential moment in this evolution is called turnaround, the moment when the sphere stops expanding together with the universe and the collapse begins. The turnaround marks the epoch when the perturbation decouples entirely from the Hubble flow of the homogeneous background. Gramann & Suhhonenko (2002) studied the dynamical state of superclusters in different CDM models and showed that at the supercluster scale the turnaround is rare. Only a small fraction of superclusters or their high-density cores have already reached the turnaround radius and have started to collapse. In our nearby universe it may have happened, for example, in the Corona Borealis supercluster (Small et al. 1998; Pearson et al. 2014), in the Shapley supercluster (Reisenegger et al. 2000; Proust et al. 2006), and in the A2199 supercluster (Rines et al. 2002) (classified as the member of the Hercules supercluster in Einasto et al. 1975, 2001).
The density perturbation in the volume can be calculated as
| (1) |
where is the matter density in this volume and is the mean matter density in the local universe. For a spherical volume , we find that
| (2) |
Assuming , as adopted in the present paper, the density fluctuation can be written as
| (3) |
According to the spherical collapse model, if then the perturbed region ceases to expand and begins to collapse. The values of turnaround parameters for various cosmological models were given in Chon et al. (2015). For and , the density perturbation at the turnaround point is . For , the density fluctuation at the turnaround point is (the density contrast (see also Martínez & Saar 2002).
From Eq. (2) we can estimate the mass of a structure at the turnaround point:
| (4) |
which gives us
| (5) |
The mass in the Eq. (5) describes the minimum mass needed in the sphere with radius for the turnaround and collapse (Gramann & Suhhonenko 2002). We note that Planck results presently suggest (Planck Collaboration et al. 2015), which in the flat model leads to .
We can use Eqs. (3) and (5) to examine the dynamical state of the A2142 supercluster. Table LABEL:tab:D8prop summarises the properties of the different global luminosity density regions in the A2142 supercluster. In Fig. 8 we plot turnaround mass versus radius of a sphere for and for , and show in the figure both the dynamical and estimated masses of different global density regions in the A2142 supercluster.
In the highest density core of the A2142 supercluster with the sum of masses of galaxy groups is , the estimated mass is approximately 10% larger (Table LABEL:tab:D8prop). The radius of this region is Mpc. From Eq. (3) we find that the density perturbation in the high-density core of A2142 supercluster is . For Mpc the minimum mass needed for the turnaround is . This suggests that the core region in the A2142 supercluster has already reached the turnaround radius and started to collapse.

The radius of the region with is Mpc. For this radius, the minimum mass for the turnaround is . The sum of dynamical masses of galaxy groups in this region is , which corresponds to . This indicates that this region in the A2142 supercluster is very close to the turnaround state. If we add the estimated mass of faint groups and the estimated mass of intracluster gas in this region then the mass of the region with global density is , sufficient for this region for the collapse (Table LABEL:tab:D8prop). Therefore we cannot exclude the possibility that the mass of the whole region in A2142 supercluster is higher than the minimum mass needed for collapse. The turnaround radius in the A2142 supercluster is Mpc. Further investigation of the properties of galaxy groups (and filaments) in this region will help to understand the dynamical state of the region.
The size of the larger region with is Mpc. The sum of dynamical masses of galaxy groups in this region is which corresponds to . From Fig. 8 we also see that the estimated mass of this region is not sufficient for this region to collapse. This shows that this region in the A2142 supercluster expands together with the universe.
We can also find masses and radii of two regions in the lower density straight tail of the A2142 supercluster around groups Gr14283 (12), and Gr10224 (13) and Gr26895 (14). The diameter of both regions is approximately Mpc: there are seven poor groups in the region of Gr14283, and ten poor groups near groups Gr10224 and Gr26895. The sums of their dynamical masses are in the Gr14283 region (estimated mass in this region ), and () in the Gr10224 and Gr26895 region, enough to become bound structures in the future.
Dünner et al. (2006), Araya-Melo et al. (2009), and Luparello et al. (2011) studied the future evolution of superclusters from observations and simulations and showed that superclusters defined above a certain density contrast may become virialised systems in the future. Such superclusters become more spherical, and clusters in superclusters may merge into one cluster. Density contrasts for future virialised systems for different cosmological models were calculated in Chon et al. (2015) who showed that for the density contrast limit is . Comparison with the density contrasts in regions with different global density limits shows that in region with the density contrast in this region is if we use the value of the estimated mass of this region. Therefore, the A2142 supercluster may split into three systems in the future. The region with density contrast slightly higher than will form one system, and the regions around the group Gr14283 and around the groups Gr10224 and Gr26895 will form two separate systems.
5.2 The shape of superclusters as a test for cosmological models
Recently Shim & Lee (2013) and Shim et al. (2014) analysed the straightness of superclusters in the CDM model, and in four different coupled dark energy models which assume the existence of dark sector coupling between scalar field dark energy and non-baryonic dark matter, and in models which adopted modified gravity. They found that in coupled dark energy models supercluster spines are less straight than in the CDM model, and gravity also affects the shape of superclusters. However, in their analysis the mean length of supercluster spines was less than Mpc, which is comparable to the size of the smallest galaxy filaments in the A2142 supercluster. So it is not clear to which objects from observations their superclusters correspond.
Kolokotronis et al. (2002), Einasto et al. (2007a) and Costa-Duarte et al. (2011) proposed using several shape parameters of superclusters as tests for cosmological models, among which the overall shape parameter defined using Minkowski functionals and shapefinders. Einasto et al. (2007a) compared the asymmetry of superclusters from 2dFGRS catalogue with that of superclusters from the Millennium Run simulations as characterised by the offset of the geometrical mean centre from the dynamical one. They showed that asymmetry of simulated superclusters is very close to that of real superclusters. Costa-Duarte et al. (2011) found that many superclusters are rather planar, although among rich superclusters elongated, prolate structures dominate. Einasto et al. (2011c) calculated shape parameters for a large number of superclusters. In their list, by overall shape according to this parameter the A2142 supercluster is elongated but not among the most elongated superclusters. However, the overall shape parameter does not characterise the straightness of superclusters well.
Einasto et al. (2007c) showed that the morphology of the richest superclusters from the SDSS DR7 catalogue and Millenium simulations is different. They found among the richest superclusters from simulations some very planar systems, while very planar systems are absent among the observed superclusters, and no very dense and straight filament-like systems. However, in this study the number of superclusters under study was too small for statistical conclusions.
Park et al. (2012) identified over- and under-dense large-scale structures from the SDSS DR7 catalogue. They found that the most massive structures are typically filamentary and are often looping. The richest over-dense structure in the SDSS region was the dense part of the Sloan Great Wall, which looks like a thick strip of galaxies with a length of about Mpc. On the other hand, the large under-dense structures are complexes of voids connected by tunnels. Park et al. (2012) also made quantitative comparisons between the observation and the mock SDSS surveys performed in the simulated CDM universe, using the Horizon Run 2 simulation of structure formation in a box with a side length of Mpc (Kim et al. 2011). They found that the largest over-dense structures from the CDM model frequently show massive filamentary structures similar to the Sloan Great Wall. In particular, straight filaments are occasionally found. For example, the second panel of Fig. 2 in Park et al. (2012) shows a straight filament with a length of about Mpc. It demonstrates that large-volume simulations are essential in order to make quantitative comparisons of large-scale structures between observations and cosmological models.
5.3 Clusters, superclusters, and the cosmic web
Jõeveer & Einasto (1978) were the first to note that rich galaxy clusters are elongated, with axes oriented along the supercluster axis to which they belong. The orientation of galaxy clusters along the supercluster axis was later discussed in Einasto et al. (1980a), in Oort (1983), and in Dekel et al. (1984). These early studies showed that the formation and evolution of galaxy clusters and their large-scale environment is related; the alignment of clusters along the supercluster axis reflects the existence of elongated superclusters that form the cosmic web (cell structure, as the structure of the Universe was called in these studies). The alignment of the galaxy groups and clusters with the surrounding environments up to distances of about Mpc has been detected both from observations and simulations (Hopkins et al. 2005; Paz et al. 2011, and references therein). Recently, Tempel & Tamm (2015) demonstrated that galaxy pairs are aligned along the large-scale filaments where they are located.
This motivates us to analyse the distribution of other rich galaxy clusters near A2142. We plot the distribution of distances to rich clusters with at least 30 member galaxies from A2142 cluster, and the distribution of galaxy groups and clusters in cartesian coordinates in the region around the A2142 supercluster up to Mpc where the selections are the smallest (Einasto et al. 2011c) in Fig. 9. In the left panel we also show bootstrap errors of distance distributions, and the comparison of the distance distributions with distances to a random sample of points found taking into account SDSS mask. Interestingly, we see in the distance distribution two maxima, at Mpc, and at Mpc. The first maximum is formed by galaxy groups and clusters in the superclusters across the void between the A2142 supercluster and nearby superclusters, the Bootes supercluster among them. Galaxy groups in the Sloan Great Wall and in other rich superclusters cause a maximum at distances Mpc. Early studies of superclusters and of the supercluster-void network have already demonstrated the presence of a characteristic scale of about 120 - 130 Mpc in the distribution of rich superclusters (Einasto et al. 1994, 1997b, 1997a). Recently Hong et al. (2012) detected this scale in the correlation function of a large sample of galaxy clusters.
The scale of the first maximum is close to the well-known scale of the baryonic acoustic oscillations (BAO). Planck results of the CMB anisotropies determine the scale of acoustic oscillations – Mpc with high accuracy (Planck Collaboration et al. 2013). Could it be that the distribution of galaxy groups and clusters plotted in Fig. 9 mark the location of the local BAO shells, as described in Arnalte-Mur et al. (2012)?
The location of the maximum differs from the location of the BAO scale. The maximum in the distributions of distances of groups and clusters is wide, so it is not yet clear whether our results are in tension with the strictly fixed BAO scale. Furthermore, BAO shells are barely visible in the distribution of galaxies and their density contrast is rather low, while in our case the clusters that cause the distance maxima are located in rich superclusters, the richest galaxy system in the local Universe, the Sloan Great Wall among them. The A2142 supercluster itself marks the highest luminosity density value in the whole SDSS area. This suggests that we might be dealing with a different phenomenon. In a forthcoming paper we will search for characteristic scales in the distribution of galaxy groups and clusters in more detail.
Einasto et al. (2011a, b) and Suhhonenko et al. (2011) showed how the density waves of different scales affect the richness of galaxy systems. Rich galaxy clusters and high-density cores of superclusters form in regions of high environmental density, where positive sections of medium- and large-scale density perturbations combine. The most luminous groups and clusters from observations and simulations are located in high-density regions, often in cores of rich superclusters (Einasto et al. 2003, 2005, 2012a), which are ideal places to study cluster merging (Rose et al. 2002; Bardelli 2004). Matter flows to regions of deep potential wells where the richness and sizes of galaxy groups and clusters increase via merging. Syncronisation of the orientations of galaxy clusters and supercluster axes occurs as a result of these processes. The A2142 supercluster with its collapsing core and multimodal galaxy groups and clusters is a very good example of these multiscale processes both in the high-density core and low-density outskirts.
5.4 Summary
Summarising, our results are as follows.
-
1)
Rich galaxy groups and clusters in the A2142 supercluster lie along an almost straight line. Morphologically A2142 supercluster resembles a rich and straight filament with a high-density spider-like core.
-
2)
Most of the rich groups in the supercluster are concentrated in the high-density core region with . The outskirts of the supercluster is populated mostly by poor groups.
-
3)
The fraction of stellar mass in the A2142 supercluster is about % of the total mass, being slightly higher in the outskirts of the supercluster.
-
4)
In the high-density core seven out of eight rich galaxy groups with more than twenty galaxies are multimodal.
-
5)
The richest cluster of the supercluster, Abell cluster A2142 has an elongated shape; the orientation of the cluster axis follows the orientations of its X-ray substructures and radio halo and it is aligned along the supercluster axis.
-
6)
The high-density core region in the A2142 supercluster with global density and probably also with has reached the turnaround radius and started to collapse.
-
7)
The A2142 supercluster with its high-density, collapsing core and long filament-like tail with two density enhancements may split into several systems in the future.
The A2142 supercluster with its collapsing core and straight body, in which the richest clusters are aligned along the supercluster axis, is an unusual object among galaxy superclusters. We plan to continue our studies of the A2142 supercluster with the analysis of the galaxy content of the supercluster. We also will search for possible collapsing high-density cores in other superclusters, and will study the morphological properties and search for collapsing superclusters from simulations. Such studies help us to understand the role of the dark matter and dark energy in the formation and evolution of the galaxy superclusters, the largest structures in the cosmic web.
Acknowledgements.
We thank the referee for useful comments which helped to improve the paper. We thank Prof. Peeter Tenjes for valuable discussions. We are pleased to thank the SDSS Team for the publicly available data releases. Funding for the Sloan Digital Sky Survey (SDSS) and SDSS-II has been provided by the Alfred P. Sloan Foundation, the Participating Institutions, the National Science Foundation, the U.S. Department of Energy, the National Aeronautics and Space Administration, the Japanese Monbukagakusho, and the Max Planck Society, and the Higher Education Funding Council for England. The SDSS Web site is http://www.sdss.org/. The SDSS is managed by the Astrophysical Research Consortium (ARC) for the Participating Institutions. The Participating Institutions are the American Museum of Natural History, Astrophysical Institute Potsdam, University of Basel, University of Cambridge, Case Western Reserve University, The University of Chicago, Drexel University, Fermilab, the Institute for Advanced Study, the Japan Participation Group, The Johns Hopkins University, the Joint Institute for Nuclear Astrophysics, the Kavli Institute for Particle Astrophysics and Cosmology, the Korean Scientist Group, the Chinese Academy of Sciences (LAMOST), Los Alamos National Laboratory, the Max-Planck-Institute for Astronomy (MPIA), the Max-Planck-Institute for Astrophysics (MPA), New Mexico State University, Ohio State University, University of Pittsburgh, University of Portsmouth, Princeton University, the United States Naval Observatory, and the University of Washington. The present study was supported by the ETAG projects IUT26-2 and IUT40-2, and by the European Structural Funds grant for the Centre of Excellence ”Dark Matter in (Astro)particle Physics and Cosmology” TK120. JN acknowledges ETAG grant PUT246. This work has also been supported by ICRAnet through a professorship for Jaan Einasto.References
- Abell (1958) Abell, G. O. 1958, ApJS, 3, 211
- Ahn et al. (2014) Ahn, C. P., Alexandroff, R., Allende Prieto, C., et al. 2014, ApJS, 211, 17
- Aihara et al. (2011) Aihara, H., Allende Prieto, C., An, D., et al. 2011, ApJS, 193, 29
- Andreon (2010) Andreon, S. 2010, MNRAS, 407, 263
- Anscombe & Glynn (1983) Anscombe, F. J. & Glynn, W. J. 1983, Biometrika, 70, 227
- Araya-Melo et al. (2009) Araya-Melo, P. A., Reisenegger, A., Meza, A., et al. 2009, MNRAS, 399, 97
- Arnalte-Mur et al. (2012) Arnalte-Mur, P., Labatie, A., Clerc, N., et al. 2012, A&A, 542, A34
- Bahcall & Kulier (2014) Bahcall, N. A. & Kulier, A. 2014, MNRAS, 439, 2505
- Bardelli (2004) Bardelli, S. 2004, in IAU Colloq. 195: Outskirts of Galaxy Clusters: Intense Life in the Suburbs, ed. A. Diaferio, 71–77
- Brinchmann et al. (2004) Brinchmann, J., Charlot, S., White, S. D. M., et al. 2004, MNRAS, 351, 1151
- Bruzual & Charlot (2003) Bruzual, G. & Charlot, S. 2003, MNRAS, 344, 1000
- Chiu et al. (2014) Chiu, I., Mohr, J., Mcdonald, M., et al. 2014, ArXiv e-print: 1412.7823
- Chon et al. (2014) Chon, G., Böhringer, H., Collins, C. A., & Krause, M. 2014, A&A, 567, A144
- Chon et al. (2015) Chon, G., Böhringer, H., & Zaroubi, S. 2015, A&A, 575, L14
- Chow-Martínez et al. (2014) Chow-Martínez, M., Andernach, H., Caretta, C. A., & Trejo-Alonso, J. J. 2014, MNRAS, 445, 4073
- Costa-Duarte et al. (2011) Costa-Duarte, M. V., Sodré, Jr., L., & Durret, F. 2011, MNRAS, 411, 1716
- de Vaucouleurs (1956) de Vaucouleurs, G. 1956, Vistas in Astronomy, 2, 1584
- Dekel et al. (1984) Dekel, A., West, M. J., & Aarseth, S. J. 1984, ApJ, 279, 1
- Dünner et al. (2006) Dünner, R., Araya, P. A., Meza, A., & Reisenegger, A. 2006, MNRAS, 366, 803
- Eckert et al. (2014) Eckert, D., Molendi, S., Owers, M., et al. 2014, A&A, 570, A119
- Einasto (1952) Einasto, J. 1952, Publications of the Tartu Astrofizica Observatory, 32, 231
- Einasto (1954) Einasto, J. 1954, Publications of the Tartu Astrofizica Observatory, 32, 371
- Einasto et al. (1997a) Einasto, J., Einasto, M., Frisch, P., et al. 1997a, MNRAS, 289, 801
- Einasto et al. (1997b) Einasto, J., Einasto, M., Gottlöber, S., et al. 1997b, Nature, 385, 139
- Einasto et al. (2006) Einasto, J., Einasto, M., Saar, E., et al. 2006, A&A, 459, L1
- Einasto et al. (2007a) Einasto, J., Einasto, M., Saar, E., et al. 2007a, A&A, 462, 397
- Einasto et al. (2011a) Einasto, J., Hütsi, G., Saar, E., et al. 2011a, A&A, 531, A75
- Einasto et al. (1975) Einasto, J., Jôeveer, M., Kivila, A., & Tago, E. 1975, Astronomicheskij Tsirkulyar, 895, 2
- Einasto et al. (1980a) Einasto, J., Jôeveer, M., & Saar, E. 1980a, MNRAS, 193, 353
- Einasto et al. (1980b) Einasto, J., Jôeveer, M., & Saar, E. 1980b, Nature, 283, 47
- Einasto et al. (1984) Einasto, J., Klypin, A. A., Saar, E., & Shandarin, S. F. 1984, MNRAS, 206, 529
- Einasto et al. (2011b) Einasto, J., Suhhonenko, I., Hütsi, G., et al. 2011b, A&A, 534, A128
- Einasto et al. (2003) Einasto, M., Einasto, J., Müller, V., Heinämäki, P., & Tucker, D. L. 2003, A&A, 401, 851
- Einasto et al. (1994) Einasto, M., Einasto, J., Tago, E., Dalton, G. B., & Andernach, H. 1994, MNRAS, 269, 301
- Einasto et al. (2001) Einasto, M., Einasto, J., Tago, E., Müller, V., & Andernach, H. 2001, AJ, 122, 2222
- Einasto et al. (2007b) Einasto, M., Einasto, J., Tago, E., et al. 2007b, A&A, 464, 815
- Einasto et al. (2014) Einasto, M., Lietzen, H., Tempel, E., et al. 2014, A&A, 562, A87
- Einasto et al. (2011c) Einasto, M., Liivamägi, L. J., Tago, E., et al. 2011c, A&A, 532, A5
- Einasto et al. (2011d) Einasto, M., Liivamägi, L. J., Tempel, E., et al. 2011d, ApJ, 736, 51
- Einasto et al. (2012a) Einasto, M., Liivamägi, L. J., Tempel, E., et al. 2012a, A&A, 542, A36
- Einasto et al. (2007c) Einasto, M., Saar, E., Liivamägi, L. J., et al. 2007c, A&A, 476, 697
- Einasto et al. (2008) Einasto, M., Saar, E., Martínez, V. J., et al. 2008, ApJ, 685, 83
- Einasto et al. (2005) Einasto, M., Suhhonenko, I., Heinämäki, P., Einasto, J., & Saar, E. 2005, A&A, 436, 17
- Einasto et al. (2012b) Einasto, M., Vennik, J., Nurmi, P., et al. 2012b, A&A, 540, A123
- Faloon et al. (2013) Faloon, A. J., Webb, T. M. A., Ellingson, E., et al. 2013, ApJ, 768, 104
- Farnsworth et al. (2013) Farnsworth, D., Rudnick, L., Brown, S., & Brunetti, G. 2013, ApJ, 779, 189
- Forman et al. (2001) Forman, W., Markevitch, M., Jones, C., Vikhlinin, A., & Churazov, E. 2001, in Clusters of Galaxies and the High Redshift Universe Observed in X-rays, ed. D. M. Neumann & J. T. V. Tran, 33
- Fraley & Raftery (2006) Fraley, C. & Raftery, A. E. 2006, Technical Report, Dep. of Statistics, University of Washington, 504, 1
- Gal et al. (2008) Gal, R. R., Lemaux, B. C., Lubin, L. M., Kocevski, D., & Squires, G. K. 2008, ApJ, 684, 933
- Gramann & Suhhonenko (2002) Gramann, M. & Suhhonenko, I. 2002, MNRAS, 337, 1417
- Granett et al. (2008) Granett, B. R., Neyrinck, M. C., & Szapudi, I. 2008, ApJL, 683, L99
- Hong et al. (2012) Hong, T., Han, J. L., Wen, Z. L., Sun, L., & Zhan, H. 2012, ApJ, 749, 81
- Hopkins et al. (2005) Hopkins, P. F., Bahcall, N. A., & Bode, P. 2005, ApJ, 618, 1
- Hou et al. (2009) Hou, A., Parker, L. C., Harris, W. E., & Wilman, D. J. 2009, ApJ, 702, 1199
- Huchra & Geller (1982) Huchra, J. P. & Geller, M. J. 1982, ApJ, 257, 423
- Ihaka & Gentleman (1996) Ihaka, R. & Gentleman, R. 1996, Journal of Computational and Graphical Statistics, 5, 299
- Jõeveer & Einasto (1978) Jõeveer, M. & Einasto, J. 1978, in IAU Symposium, Vol. 79, Large Scale Structures in the Universe, ed. M. S. Longair & J. Einasto, 241–250
- Jõeveer et al. (1978) Jõeveer, M., Einasto, J., & Tago, E. 1978, MNRAS, 185, 357
- Kauffmann et al. (2003) Kauffmann, G., Heckman, T. M., White, S. D. M., et al. 2003, MNRAS, 341, 33
- Kawahara et al. (2011) Kawahara, H., Yoshitake, H., Nishimichi, T., & Sousbie, T. 2011, ApJL, 727, L38
- Kim et al. (2011) Kim, J., Park, C., Rossi, G., Lee, S. M., & Gott, III, J. R. 2011, Journal of Korean Astronomical Society, 44, 217
- Kolokotronis et al. (2002) Kolokotronis, V., Basilakos, S., & Plionis, M. 2002, MNRAS, 331, 1020
- Komatsu et al. (2011) Komatsu, E., Smith, K. M., Dunkley, J., et al. 2011, ApJS, 192, 18
- Krause et al. (2013) Krause, M. O., Ribeiro, A. L. B., & Lopes, P. A. A. 2013, A&A, 551, A143
- Lee et al. (2015) Lee, G.-H., Hwang, H. S., Lee, M. G., et al. 2015, ApJ, 800, 80
- Liivamägi et al. (2012) Liivamägi, L. J., Tempel, E., & Saar, E. 2012, A&A, 539, A80
- Luparello et al. (2011) Luparello, H., Lares, M., Lambas, D. G., & Padilla, N. 2011, MNRAS, 415, 964
- Luparello et al. (2013) Luparello, H. E., Lares, M., Yaryura, C. Y., et al. 2013, MNRAS, 432, 1367
- Malumuth (1992) Malumuth, E. M. 1992, ApJ, 386, 420
- Markevitch et al. (2000) Markevitch, M., Ponman, T. J., Nulsen, P. E. J., et al. 2000, ApJ, 541, 542
- Martínez & Saar (2002) Martínez, V. J. & Saar, E. 2002, Statistics of the Galaxy Distribution (Chapman & Hall/CRC, Boca Raton)
- Merritt (1984) Merritt, D. 1984, ApJ, 276, 26
- Merritt (1987) Merritt, D. 1987, ApJ, 313, 121
- Munari et al. (2014) Munari, E., Biviano, A., & Mamon, G. A. 2014, A&A, 566, A68
- Nevalainen et al. (2014) Nevalainen, J., Liivamagi, L. J., Tempel, E., et al. 2014, ArXiv e-print: 1410.1311
- Noh & Cohn (2012) Noh, Y. & Cohn, J. D. 2012, MNRAS, 426, 1829
- Okabe & Umetsu (2008) Okabe, N. & Umetsu, K. 2008, PASJ, 60, 345
- Old et al. (2014) Old, L., Skibba, R. A., Pearce, F. R., et al. 2014, MNRAS, 441, 1513
- Old et al. (2015) Old, L., Wojtak, R., Mamon, G. A., et al. 2015, MNRAS, 449, 1897
- Oort (1983) Oort, J. H. 1983, ARA&A, 21, 373
- Ostriker & Tremaine (1975) Ostriker, J. P. & Tremaine, S. D. 1975, ApJL, 202, L113
- Owers et al. (2011) Owers, M. S., Nulsen, P. E. J., & Couch, W. J. 2011, ApJ, 741, 122
- Park et al. (2007) Park, C., Choi, Y., Vogeley, M. S., Gott, III, J. R., & Blanton, M. R. 2007, ApJ, 658, 898
- Park et al. (2012) Park, C., Choi, Y.-Y., Kim, J., et al. 2012, ApJL, 759, L7
- Patel et al. (2015) Patel, S. G., Kelson, D. D., Williams, R. J., et al. 2015, ApJL, 799, L17
- Paz et al. (2011) Paz, D. J., Sgró, M. A., Merchán, M., & Padilla, N. 2011, MNRAS, 414, 2029
- Pearson et al. (2014) Pearson, D. W., Batiste, M., & Batuski, D. J. 2014, MNRAS, 441, 1601
- Planck Collaboration et al. (2013) Planck Collaboration, Ade, P. A. R., Aghanim, N., et al. 2013, ArXiv: 1303.5076
- Planck Collaboration et al. (2015) Planck Collaboration, Ade, P. A. R., Aghanim, N., et al. 2015, ArXiv e-print: 1502.01589
- Proust et al. (2006) Proust, D., Quintana, H., Carrasco, E. R., et al. 2006, A&A, 447, 133
- Reisenegger et al. (2000) Reisenegger, A., Quintana, H., Carrasco, E. R., & Maze, J. 2000, AJ, 120, 523
- Ribeiro et al. (2013) Ribeiro, A. L. B., de Carvalho, R. R., Trevisan, M., et al. 2013, MNRAS, 434, 784
- Rines et al. (2002) Rines, K., Geller, M. J., Diaferio, A., et al. 2002, AJ, 124, 1266
- Rines et al. (2001) Rines, K., Mahdavi, A., Geller, M. J., et al. 2001, ApJ, 555, 558
- Rose et al. (2002) Rose, J. A., Gaba, A. E., Christiansen, W. A., et al. 2002, AJ, 123, 1216
- Rossetti et al. (2013) Rossetti, M., Eckert, D., De Grandi, S., et al. 2013, A&A, 556, A44
- Roukema et al. (2015) Roukema, B. F., Buchert, T., Ostrowski, J. J., & France, M. J. 2015, MNRAS, 448, 1660
- Schirmer et al. (2011) Schirmer, M., Hildebrandt, H., Kuijken, K., & Erben, T. 2011, A&A, 532, A57
- Shan et al. (2015) Shan, Y., McDonald, M., & Courteau, S. 2015, ApJ, 800, 122
- Shapiro (1965) Shapiro, S. S.and Wilk, M. B. 1965, Biometrika, 52, 591
- Sheth & Diaferio (2011) Sheth, R. K. & Diaferio, A. 2011, MNRAS, 417, 2938
- Shim & Lee (2013) Shim, J. & Lee, J. 2013, ApJ, 777, 74
- Shim et al. (2014) Shim, J., Lee, J., & Li, B. 2014, ApJ, 784, 84
- Small et al. (1998) Small, T. A., Ma, C.-P., Sargent, W. L. W., & Hamilton, D. 1998, ApJ, 492, 45
- Suhhonenko et al. (2011) Suhhonenko, I., Einasto, J., Liivamägi, L. J., et al. 2011, A&A, 531, A149
- Swinbank et al. (2007) Swinbank, A. M., Edge, A. C., Smail, I., et al. 2007, MNRAS, 379, 1343
- Teerikorpi et al. (2015) Teerikorpi, P., Heinämäki, P., Nurmi, P., et al. 2015, A&A, 577, A144
- Tempel et al. (2009) Tempel, E., Einasto, J., Einasto, M., Saar, E., & Tago, E. 2009, A&A, 495, 37
- Tempel et al. (2014a) Tempel, E., Stoica, R. S., Martínez, V. J., et al. 2014a, MNRAS, 438, 3465
- Tempel et al. (2012) Tempel, E., Tago, E., & Liivamägi, L. J. 2012, A&A, 540, A106
- Tempel & Tamm (2015) Tempel, E. & Tamm, A. 2015, A&A, 576, L5
- Tempel et al. (2014b) Tempel, E., Tamm, A., Gramann, M., et al. 2014b, A&A, 566, A1
- Tremonti et al. (2004) Tremonti, C. A., Heckman, T. M., Kauffmann, G., et al. 2004, ApJ, 613, 898
- Tully (2015a) Tully, R. B. 2015a, AJ, 149, 54
- Tully (2015b) Tully, R. B. 2015b, AJ, 149, 171
- Tully et al. (2014) Tully, R. B., Courtois, H., Hoffman, Y., & Pomarède, D. 2014, Nature, 513, 71
- Umetsu et al. (2009) Umetsu, K., Birkinshaw, M., Liu, G.-C., et al. 2009, ApJ, 694, 1643
- Wojtak & Łokas (2010) Wojtak, R. & Łokas, E. L. 2010, MNRAS, 408, 2442
- Zeldovich et al. (1982) Zeldovich, I. B., Einasto, J., & Shandarin, S. F. 1982, Nature, 300, 407
- Zucca et al. (1993) Zucca, E., Zamorani, G., Scaramella, R., & Vettolani, G. 1993, ApJ, 407, 470