On the Physical Requirements for a Pre-Reionization Origin of the Unresolved Near-Infrared Background
On the Physical Requirements for a Pre-Reionization Origin of the Unresolved Near-Infrared Background
Abstract
The study of the Cosmic Near-Infrared Background (CIB) light after subtraction of resolved sources can push the limits of current observations and yield information on galaxies and quasars in the early universe. Spatial fluctuations of the CIB exhibit a clustering excess at angular scales whose origin has not been conclusively identified, but disentangling the relative contribution from low- and high-redshift sources is not trivial. We explore the likelihood that this signal is dominated by emission from galaxies and accreting black holes in the early Universe. We find that, the measured fluctuation signal is too large to be produced by galaxies at redshifts , which only contribute to the CIB. Additionally, if the first small mass galaxies have a normal IMF, the light of their ageing stars (fossils) integrated over cosmic time contributes a comparable amount to the CIB as their pre-reionization progenitors. In order to produce the observed level of CIB fluctuation without violating constraints from galaxy counts and the electron optical depth of the IGM, minihalos at must form preferably top-heavy stars with efficiency and at the same time maintain a very low escape fraction of ionizing radiation, . If instead the CIB fluctuations are produced by high- black holes, one requires vigorous accretion in the early universe reaching by . This growth must stop by and be significantly obscured not to overproduce the soft cosmic X-ray background (CXB) and its observed coherence with the CIB. We therefore find the range of suitable high- explanations to be narrow, but could possibly be widened by including additional physics and evolution at those epochs.
keywords:
cosmology: diffuse radiation — early universe1 Introduction
The Cosmic Near Infrared Background (CIB) contains radiation that has been built up throughout the cosmic history, including highly redshifted emission from the pre-reionization era (see e.g. review by Kashlinsky, 2005). Measured brightness fluctuations in deep source-subtracted CIB maps have established the existence of an unresolved CIB component in addition to resolved point sources (Kashlinsky et al., 2005, 2007a; Thompson et al., 2007a, b; Matsumoto et al., 2011; Kashlinsky et al., 2012; Cooray et al., 2012b; Seo et al., 2015). Whereas the CIB flux associated with this component cannot be directly determined from such measurements, the required levels are nevertheless theoretically deduced (Kashlinsky et al., 2005) to lie well below earlier studies claiming high CIB (Dwek & Arendt, 1998; Matsumoto et al., 2005; Tsumura et al., 2013; Matsumoto et al., 2015) in excess of integrated galaxy counts (Madau & Pozzetti, 2000; Fazio et al., 2004; Keenan et al., 2010; Ashby et al., 2013); and at the same time consistent with indirect measurements from -ray blazars (Mazin & Raue, 2007; Meyer et al., 2012; Ackermann et al., 2012; H.E.S.S. Collaboration, 2013; Biteau & Williams, 2015).
The unresolved CIB fluctuations measured with Spitzer/IRAC (Kashlinsky et al., 2005, 2007a, 2012; Cooray et al., 2012b), HST/NICMOS (Thompson et al., 2007a, b) and AKARI/IRC (Matsumoto et al., 2011; Seo et al., 2015), confirm a mutually consistent isotropic signal above the noise extending out to scales. The observed properties can be listed as follows (see Kashlinsky et al. (2015) for detailed discussion): 1) the signal is inconsistent with local foregrounds such as the Zodiacal Light and Galactic cirrus (Kashlinsky et al., 2005; Arendt et al., 2010; Matsumoto et al., 2011; Kashlinsky et al., 2012). Its extragalactic nature is further supported by its isotropy (now measured in several different parts of the sky, Kashlinsky et al. (2012)); 2) the signal is also inconsistent with the contribution from known galaxy populations at extrapolated to faint luminosities (Helgason et al., 2012); 3) the amplitude of the fluctuations increases towards shorter wavelengths showing a blue spectrum (Matsumoto et al., 2011; Seo et al., 2015); 4) 4) there is no evidence yet for the fluctuations correlating significantly with the mask or the outer parts of removed sources (Kashlinsky et al., 2005; Arendt et al., 2010); 5) the large-scale clustering component does not yet appear to start decreasing as the small-scale shot noise power is lowered; 6) the clustering component of the fluctuations shows no correlation with faint HST/ACS source maps down to (Kashlinsky et al., 2007c), 7) the unresolved CIB fluctuations at 3.6 are coherent with the Cosmic Far-Infrared Background (200,350,500) which can largely be explained by unresolved galaxies at low- and their extended emission (Thacker et al., 2014), 8) the source-subtracted CIB fluctuations are coherent with the unresolved soft Cosmic X-ray Background (not detected in harder X-ray bands of keV) (Cappelluti et al., 2013) which can partly be accounted for by unresolved AGN and X-ray galaxies at low- (Helgason et al., 2014). A recent measurement by Zemcov et al. (2014) finds the blue spectrum continuing to shorter wavelengths but appears to be in conflict with earlier HST/NICMOS and 2MASS fluctuation studies at the same wavelengths from 2MASS (Kashlinsky et al., 2002) and HST/NICMOS (Thompson et al., 2007a).
It was suggested that the era of the first stars could have left a measurable imprint in the CIB, both its mean level (Santos et al., 2002) and its anisotropies (Cooray et al., 2004; Kashlinsky et al., 2004). This was followed by more detailed studies on the nature of these populations (Salvaterra et al., 2006; Salvaterra & Ferrara, 2006; Fernandez & Komatsu, 2006; Kashlinsky et al., 2007b; Fernandez et al., 2010). This was motivated by the expectation that the first objects were i) individually bright with a short epoch of energy release, ii) highly biased as they form out of rare density peaks, and iii) radiate strongly in UV/blue being redshifted into today’s near-IR part of the spectrum (reviewed in Bromm, 2013). Despite being consistent with all observed properties however, the high- origin of the source-subtracted CIB signal continues to be debated. This is in part because of the lack of a robust redshift determination of the signal and because recent models of early galaxy populations have failed to produce sufficient CIB fluctuation power (Fernandez et al., 2012; Cooray et al., 2012a; Yue et al., 2013a). This has motivated alternative hypotheses for their origin, such as in a diffuse intrahalo light at low/intermediate- (Cooray et al., 2012b; Zemcov et al., 2014). At the same time, it was suggested that accretion by direct collapse black holes (DCBH) at high- can provide an explanation which also fully accounts for the CIBCXB signal (Yue et al., 2013b).
We evaluate the physical requirements for a pre-reionization origin of the CIB fluctuations based on the latest observational insights. We carefully quantify the clustering excess in Section 2. In Section 3 we use an analytic approach to model the CIB contributions from early stellar populations, both metal-free and metal-enriched. In Section 4 we consider accreting black holes and associated gaseous emission. We derive the required star formation and accretion rates and discuss their implications for the CXB. In this paper we use the standard CDM cosmology with parameters (, , , , )=(0.678,0.308,0.692,0.968,0.829) (Planck Collaboration et al., 2013). All magnitudes are in the AB system (Oke & Gunn, 1983).
2 Quantifying the CIB Fluctuation Excess
Brightness fluctuations in the CIB can be written where is the sky brightness at the 2-D coordinate and is the mean isotropic flux. We describe the fluctuation field in terms of the power spectrum as a function of the angular wavenumber , defined as , where is the 2-D Fourier transform of the CIB fluctuation field, . On the angular scale , the root-mean-square fluctuation in the CIB can be written as, . The fluctuations are therefore determined by the flux of the underlying sources and how they cluster on the sky
| (1) |
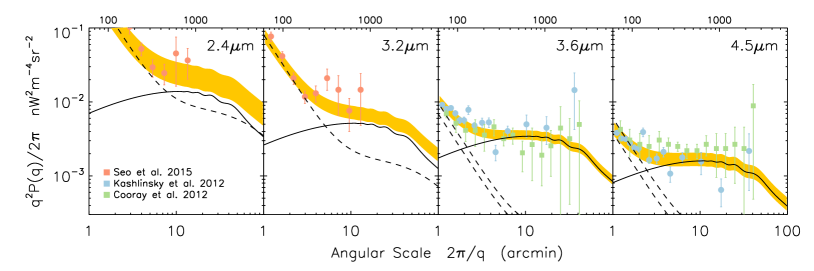
where the information on the clustering as a function of angular scale is contained within the fractional fluctuations . At high-, the sources trace increasingly rare peaks in the density field and can become at arcminute scales. Current fluctuation measurements exhibit a signal above the noise which flattens to an approximately constant rms value towards large angular scales (see Figure 1). In this paper we refer to the clustering as the average of this large scale value . When defining our CIB fluctuation excess, we focus on NIR fluctuations at from AKARI/IRC and Spizter/IRAC. This is where current measurements show a mutually consistent large scale signal which at the same time are deep enough such that the clustering component is not sensitive to further decreasing the shot noise from remaining galaxies.
In order to get a single representative value for the measured large scale CIB fluctuations from high-, we consider a simple three-parameter model consisting of the sum of fluctuations from unresolved galaxy populations at the measurement detection threshold (Helgason et al., 2012) and CDM power spectrum111The power spectrum is normalized at the 10′ peak such that . (Eisenstein & Hu, 1998), projected to :
| (2) |
We explore the parameter space by least-squares fitting the available data from Akari and Spitzer (at ) in Markov-Chain Monte Carlo steps. We use Metropolis-Hasting acceptance with chain burn-in of steps and priors on the parameters , , . As each measurement has different source detection threshold we allow the last term in the above Equation to vary at each measurement depth such that is a free parameter in six different measurements (making the effective number of parameters eight). For the first term, we obtain and . We display the 68% confidence regions of the best-fit in Figure 1 for which we obtain . The quality of the fit is limited by the slight disagreement in the data of Cooray et al. (2012b) versus Kashlinsky et al. (2012), particularly at 4.5 where our single power-law spectral slope favors the latter. It is worth noting that the best-fit excess fluctuation signal, , does not exhibit a Rayleigh-Jeans type spectrum, as indicated by measurements of the net large-scale signal. The reason is the contribution of remaining low- galaxies: 1) because the abundance of low- galaxies is greater at the typical detection thresholds at i.e. their number counts are steeper, and 2) because experiments at smaller wavelengths happen to be shallower than those at such that less of the low- galaxy contribution is removed. The SED of the best-fit excess can be seen in Figure 6. Integrating the first term in Equation 2 over 2–5 we obtain the excess fluctuation
| (3) |
This compares well with the analytical estimate in Kashlinsky et al. (2015). We will refer to this value of as our requirement for any high- model to reproduce the data in Figure 1. We also make our equations directly scalable with such that the associated CIB flux can be easily compared with measurements of the isotropic CIB, both direct and those derived from TeV blazars.
At a given near-IR wavelength, the isotropic CIB flux is related to the comoving specific emissivity per unit volume of the sources
| (4) |
where is the rest frame frequency. If the CIB was released during the first 500 Myrs, it follows from this Equation that the luminosity density at optical wavelengths must reach a representative value of (see also Kashlinsky et al., 2007b)
| (5) |
where we have substituted . This luminosity density is notably higher than the output during the peak of star formation history at . If the CIB fluctuations originate at high-, the luminosity density must have been substantially higher in the early universe regardless of the nature of the sources. In the following Sections we investigate the basic astrophysical requirements for both stellar and accretion powered emission.
3 Stellar Sources
3.1 High- Galaxy Populations
An increasing number of galaxies are being detected out to as the deep Hubble program are being pushed to the limits of the instrument capabilities (Bouwens et al., 2007; McLure et al., 2009; Ellis et al., 2013; Finkelstein et al., 2014; Bouwens et al., 2014). While these galaxies compose merely the tip-of-the-iceberg at these redshifts, it is of interest to estimate the expected contributions of the entire population to the unresolved CIB. Here, we present a simple forward evolution model of the conditional luminosity function which we tune to fit observations at . We assume that galaxies form in halos with a SFR proportional to their collapse rate at
| (6) |
where is the average fraction of baryons in collapsed halos that are processed into stars and is the evolving halo mass function, which we adopt from Tinker et al. (2008). In order for star formation to take place, halos must reach a sufficient size, , to shock heat the baryons to the virial temperate allowing for efficient gas cooling. The relation between the mass of a halo and its virial temperature is , where we have assumed a mean molecular weight of 1.22 for neutral primordial gas composed of H and He. For the discussion of high- galaxies we will adopt the limit of , somewhat higher than the threshold for cooling via atomic hydrogen. Star formation in smaller halos will be addressed in the following subsection.
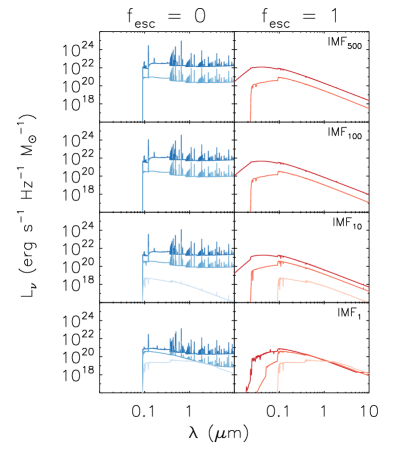
Luminosity and spectra are assigned to star forming galaxies using the Yggdrasil model, a population synthesis code designed to model high- systems containing varying mixtures of PopII and III stars (Zackrisson et al., 2011). This model includes the nebular contribution from photoionized gas and extinction due to dust, with single age stellar population (SSP) taken from Leitherer et al. (1999) (PopII) and Schaerer (2002) (PopIII, with no mass loss). Because observed Lyman break galaxies show no evidence of anything other than metal-enriched star formation, we adopt a universal Kroupa IMF () with a metallicity of , characteristic of PopII stars (we call this IMF1 in the discussion below and Figure 2). The volume emissivity of halos with masses between and at is obtained by convolving the SSP with the star formation occurring prior to
| (7) |
where is the aging spectral template shown in Figure 2. At any given epoch, each halo includes the instantaneous emission from newly formed stars as well as older populations from earlier episodes of star formation. The luminosity function is where the relation between mass and luminosity is . The CIB flux production history seen at frequency as a function of halo mass is
| (8) |
where is evaluated at . The net CIB is then simply . This can be used to derive the angular power spectrum of CIB fluctuations via projection of the source clustering (Limber, 1953)
| (9) |
where = and is the comoving distance. The clustering is described both in terms of the evolving matter power spectrum in 3D, (Eisenstein & Hu, 1998) and the mass dependent halo bias, (Sheth et al., 2001). In this description, the bias is coupled to the brightness distribution of halos, eliminating the need for assumptions on the halo occupation number of galaxies. We also note, that variations in the cosmological parameters, in particular , affect the amplitude of the power spectrum and adds uncertainty to our modeling. Equation 9 is equivalent to the 2-halo term describing the correlation between central halos222In this paper we neglect the 1-halo term from high- sources since it is always negligible compared to the 2-halo term at the relevant angular scales (). (Seljak, 2000; Cooray & Sheth, 2002).
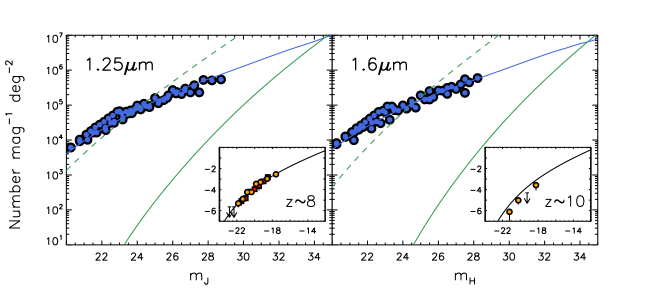
The large scale CIB fluctuations resulting from our modeled high- galaxies are shown in Figure 3. We have chosen a constant star formation efficiency (in both and ) in such a way to obtain a good agreement with the observed star formation rate and UV LF at high-. This value we find to be . Figure 4, compares the relative abundance of high- galaxies (green) with the source density of all galaxies (blue). It is immediately clear that compared to current measurements, star forming galaxies with a normal IMF are underdominant at least out to 32 mag and, with these assumptions, do not reach the measured fluctuation levels (see Figure 3). This is true regardless of whether the LF is cut off at mag or extrapolated to much fainter systems. Simply increasing further would overproduce the LF at and eventually also the faint NIR number counts (this was already pointed out by Salvaterra & Ferrara, 2006). In fact, fluctuations from faint unresolved galaxies at low- produce a larger signal than high- galaxies. We therefore conclude, in agreement with Cooray et al. (2012a) and Yue et al. (2013a), that the measured CIB fluctuation levels cannot be reproduced by high- galaxies with reasonable extrapolations of their evolving luminosity function.
3.2 Minihalos and PopIII
There are two ways of having more light produced by stars without overproducing the observed LF at . First, that an epoch of more vigorous light production took place before ; in other words, the era of CIB production already ended before this time. Second, the sources are outside the sensitivity limit of the deepest surveys i.e. they are found in numerous isolated halos that are intrinsically fainter than mag. This would be exhibited in a rise in the faint-end of the LF, either by greater star formation efficiency in smaller halos or by heavier IMF. However, numerical studies tend to show the opposite, that the efficiency decreases with lower masses (Ricotti et al., 2002a, b, 2008; Behroozi et al., 2013; O’Shea et al., 2015). In this subsection, we relax the assumption of a constant and K and explore whether greater values can be accommodated where observational constraints are not yet available. In other words, what happens if we, in addition to high- galaxies , include the contribution of the first stars forming out of pristine metal-free gas in minihalos ?
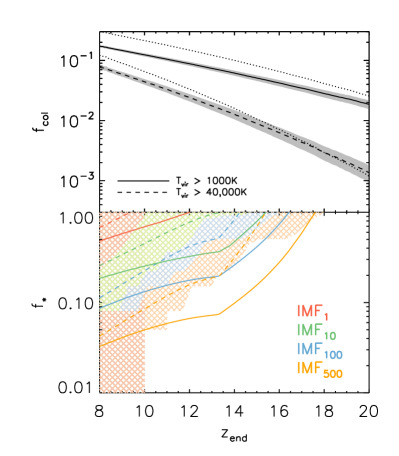
The IMF of the first PopIII stars is highly uncertain but is expected to be biased towards high masses (Bromm, 2013). It is also unclear whether stars forming under -governed cooling (sometimes called PopIII.1) differ substantially from those forming in a second episode governed by atomic line emission (PopIII.2). We therefore consider four different IMFs of the Yggdrasil model for stars forming in halos down to the smallest minihalos equivalent to the cooling threshold K
-
IMF1: standard Kroupa in the range
-
IMF10: log-normal with characteristic mass of and dispersion of in the range
-
IMF100: power-law in the range
-
IMF500: all stars are 500, near-Eddington
For details, we refer to Zackrisson et al. (2011) and references therein. Spectral evolution templates for these IMFs are shown in Figure 2.
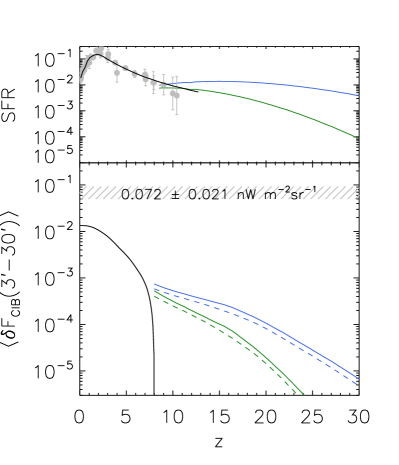
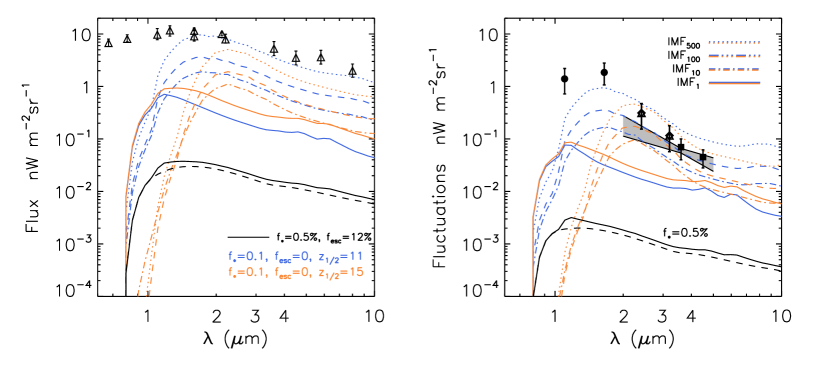
Figure 5 shows the average star formation efficiency required to produce the measured at any given epoch for the three IMFs considered. It is clear that under these assumptions the CIB fluctuations can only be reproduced if minihalos are allowed to continuously form massive stars with a high efficiencies . Furthermore, deep NIR counts limit this possibility to the most heavy IMFs where much of the energy output is reprocessed into nebular emission, (see also Fernandez et al., 2010). This is assuming that stars form continuously without mechanical or radiative feedback which is known to have strong impact on both and (e.g. Jeon et al., 2014; Pawlik et al., 2015). In Figure 6 we display the full CIB model with a simple description of chemical feedback which models the PopIII–PopII transition in terms of semi-analytic modelling of SN winds (Furlanetto & Loeb, 2005) which we adopt from Greif & Bromm (2006)
| (10) |
where is the net SFR from Equation 6 and is the fraction of collapsed objects that are still chemically pristine. We display two cases of PopIII–PopII transition in Figure 6, standard and delayed enrichment corresponding to and respectively where we have defined as the redshift at which half of all star formation is in metal-enriched mode333The enrichment histories are modified by varying the radiation loss parameter (see Greif & Bromm, 2006).. The PopII assumes IMF1 whereas we display the cases where PopIII takes on IMF10, IMF100, and IMF500. Only the most extreme models (, , IMF100,500) come close to the fluctuation excess shown in the right panel as a grey region.
3.3 Ionizing Photons
High star formation efficiencies coupled with a heavy IMF imply a vigorous production of ionizing photons ( eV). These photons must either be absorbed locally by neutral gas within the halo, or escape and be absorbed by still neutral parts of the IGM. The injection rate of ionizing photons can be derived self-consistently from the SFR combined with the stellar population synthesis models at
| (11) |
For the production of ionizing photons at later times , we adopt the prescription of Robertson et al. (2015) where is derived from fitting the measured star formation rate history (see Figure 3). We calculate the ionization fraction of the IGM, , by solving
| (12) |
where is the production rate of intrinsic ionizing photons per comoving volume and is the average comoving number density of hydrogen. The recombination timescale is where is the clumping factor of ionized hydrogen, is the case- recombination coefficient (Hummer, 1994) and and are hydrogen and helium abundances. This allows us to derive the Thompson optical depth to the electron scattering
| (13) |
where we assume Helium is singly ionized at () and fully ionized at later times (). This can be compared with the latest values inferred from CMB polarization measurements from Planck (Planck Collaboration et al., 2015), which were found to be somewhat lower than earlier results from WMAP (Hinshaw et al., 2013).
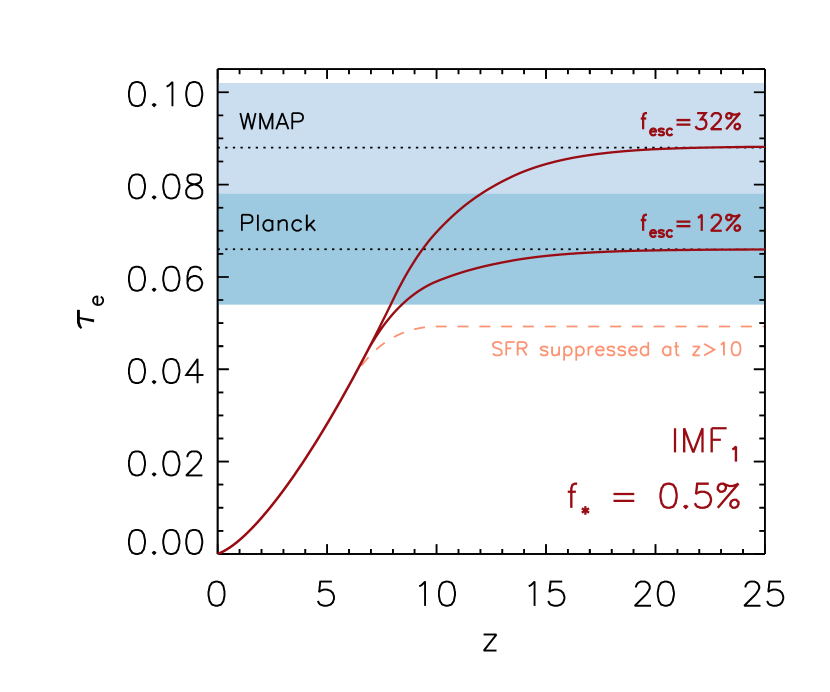
In Figure 7 (left), we show the integrated optical depth to electron scattering, , as a function of redshift for our preferred IMF1 model of high- galaxies. Forcing the model to reproduce the latest Planck measurements requires and for minimum host halo mass corresponding to K () and K () respectively. For the somewhat higher WMAP-derived these values are and respectively. We caution that, since we did not include any feedback effects which tend to surpress the star formation efficiency at small host halo masses, the average escape fraction may be somewhat higher.
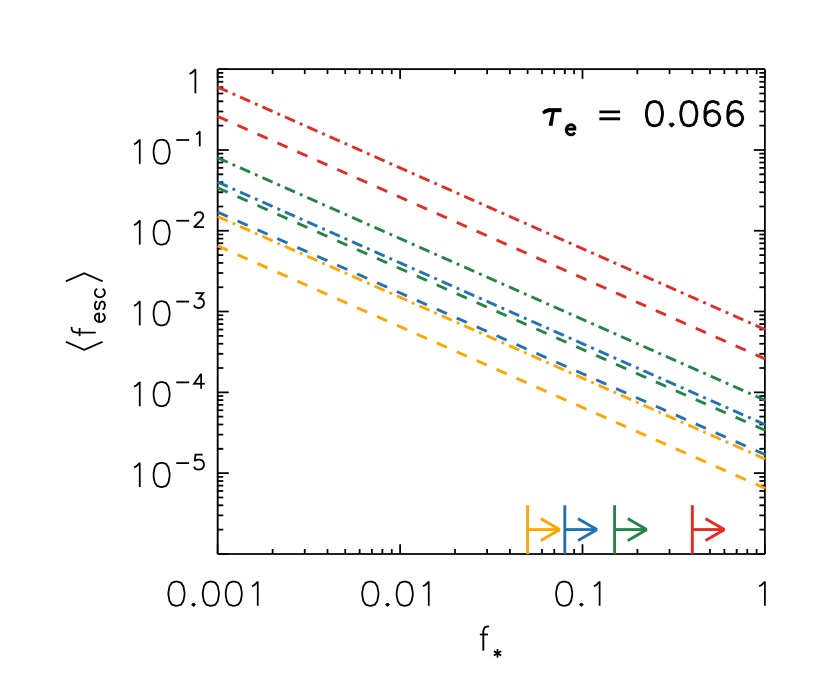
For a given SFR and IMF, the injection rate of ionizing photons into the IGM is simply proportional to and inversely proportional to . Figure 7 (right) shows the combination of and that give a fixed for our four IMFs. The Figure shows that in order to maintain the required and at the same time avoid reionizing the universe too early (and overproducing ), one must maintain a very low average escape fraction at . It follows that the of the ionizing photons need to be absorbed by the local gas which itself can only constitute of the available baryons in these small halos. Several studies modeling the propagation of ionization fronts within halos hosting the first galaxies show that the escape fraction increases towards smaller mass (Ricotti & Shull, 2000; Johnson et al., 2009). For star formation efficiencies , Ferrara & Loeb (2013) find that ionizing photons escape very easily with across a wide range of halo mass. Only the most massive halos, are able to confine their UV photons effectively. The escape fraction is also expected to increase towards higher redshifts making it hard to justify large in high- minihalos (Kuhlen & Faucher-Giguère, 2012; Mitra et al., 2013). There are recent indications from determinations of the high- LF that the star formation efficiency is actually increasing at early times (Finkelstein et al., 2015). While it is not clear whether this trend extends to the lowest mass halos where cooling relies on , observations of the stellar mass function in local dwarf systems suggest that small atomic cooling halos at high- could indeed be very efficient sites of star formation (Madau et al., 2014).
3.4 Supernova contribution
The contribution of supernova to the CIB was briefly discussed by Cooray & Yoshida (2004) who argued that SNe would remain subdominant with respect to the stellar contribution. The net energy radiated in a core-collapse SN is out of which only 0.1-1% emerges as electromagnetic radiation. For comparison, a star burning 10% of its initial hydrogen emits over its lifetime, out of which only a fraction of this energy will end up in the CIB, depending on the spectrum and redshift. A crude calculation can be made based on our model by assuming that every star explodes as a supernova for our three IMFs above. Even if every SNe inputs a generous ergs into the CIB, the contribution is always of the stellar main-sequence contribution. It is therefore safe to ignore SNe as a major CIB contributor even in the case of some unusually bright SN-types (PISN, hypernova) that have been proposed (Barkat et al., 1967; Iwamoto et al., 1998).
3.5 Fossils of the first galaxies
Around the time of reionization, it is expected only systems with sufficient mass () will be shielded from photoheating and continue to form stars. The majority of the already collapsed low-mass systems can nevertheless continue to contribute to the CIB through ageing stellar populations that continue to radiate throughout cosmic time. Locally, these systems are referred to as the fossils of the first galaxies (Ricotti & Gnedin, 2005; Bovill & Ricotti, 2009). These will not be as intrinsically bright as their high- progenitors but can in principle accumulate substantial CIB by emitting at much lower- and for much longer span of time. Our formalism outlined above accounts for the ageing of populations and allows us to estimate the fossil contribution at later times. Approximating reionization as a step function, we turn off the SFR at and allow the galaxies to passively evolve to . Not all fossil stars will contribute to the source-subtracted CIB as many systems will be incorporated into larger halos hosting star forming galaxies that are masked and subtracted in a fluctuation study (Bovill & Ricotti, 2011a, b). For simplicity we do not account for any subtraction of the fossil contribution and the calculation presented here includes all star-forming progenitors at . This should therefore be taken as an upper limit to the source-subtracted CIB for pre-reionization fossils. Note, however that this simple picture has recently been challenged by recent evidence showing that many dwarf systems continued to form stars even well after the universe was reionized (e.g. Weisz et al., 2014).
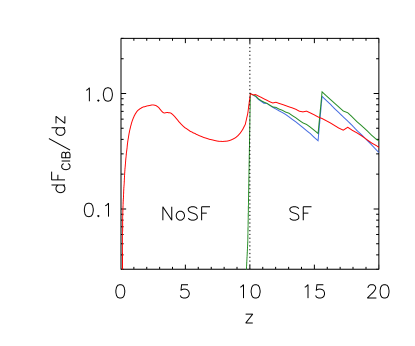
Figure 8 shows the emission history of star forming galaxies () and their remnant fossils (). Shortly after SFR is set to zero, the flux from IMF10 and IMF100 drops quickly as more massive stars die out but for IMF1 the contribution of the remaining low-mass stars gradually rises towards lower- due to the factor in Equation 4. Interestingly, when integrated over redshift the CIB contribution from fossils is 70% of the net contribution whereas high- galaxies make up only %. This suggests that the fossil contribution should be included in the net energetics of background radiation. However, considering that the low- part is an upper limit for the fossil contribution, this is still insufficient to account for the measured . It will only become important if the corresponding high- contribution is shown to be significant.
4 Accretion Powered Emission
CIB originating from accretion onto black holes offers a more energetically favorable scenario due to the more efficient conversion of mass to energy. Such a scenario is particularly attractive for explaining the CIB in light of the observed coherence with the CXB (Cappelluti et al., 2013) and the expectation that the progenitors of supermassive black holes (SMBH) in the local universe were growing rapidly during this epoch (see Volonteri & Bellovary, 2012, for review). With an average radiative efficiency of accretion , a black hole will increase its mass by where is the net incoming mass accretion rate. Throughout this section we will assume a constant efficiency, const with a caveat that relaxing this assumption may alter the numerology that follows. The net energy density radiated by a black hole population can be related to mass density accreted before redshift (Soltan, 1982)
| (14) |
which is independent of the individual masses of the black hole population. The energy output is related to the accretion reate via for which the CIB can be written (see Equation 4)
| (15) |
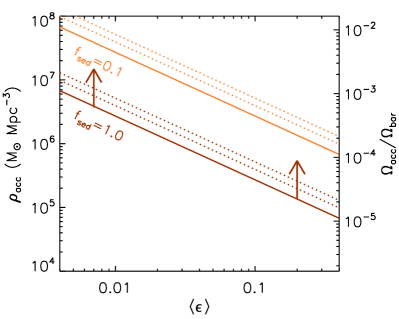
where is the average emerging spectrum, normalized such that and taken to be independent of mass and time. When the last term is roughly constant or slowly varying at early times (in particular for a blue spectrum sloping up with shorter wavelengths) the net CIB from accretion processes is simply proportional to the net mass accreted by redshift i.e. . In other words, with these assumptions the CIB is mostly independent of both the growth history and the individual masses of the BHs. It follows from Equations 1 and 15 that the accreted mass density required to produce the CIB fluctuations by redshift is roughly
| (16) |
where is the time-averaged efficiency, is a bolometric correction factor i.e. the fraction of the total energy emitted that ends up being observed in the NIR (2–5). This requirement is illustrated in Figure 9. With maximal efficiency () we require a minimum of for producing the CIB fluctuations. If this is to be reached at high-, any accretion activity by these black holes at later times would inevitably grow the net mass density locked in BHs further. Given the brief cosmic time elapsed at high-, this lower limit for the accreted mass is quite large in comparison with the mass density in SMBHs in the local universe , estimated at (Shankar et al., 2004; Marconi et al., 2004; Vika et al., 2009)444Recent evidence suggests this could be as much as five times higher than previously estimated (Comastri et al., 2015). Other studies place additional limits on the mass density at to based on the unresolved CXB (Salvaterra et al., 2012); and based on the integrated X-ray emission of high- sources (Treister et al., 2013). Both these limits can however be avoided if the emerging SED is significantly altered, or if BH cores are heavily obscured or the accretion is radiatively inefficient. Relaxing the assumptions of constant would likewise alter these numbers. Nevertheless, for the CIB to be entirely from high- we require an abundant radiatively efficient population of black holes established very early on, with significantly slowed/inefficient growth over the majority of the remaining cosmic time (see e.g. Tanaka et al., 2012). Whether the required is in fact realistically attainable is a matter of debate and outside the scope of this paper. In what follows we do not need to make assumptions on the BH seed masses and growth mechanism but will instead assume that the required can be reached by and explore the observational consequences.
4.1 Correlation with the Unresolved Cosmic X-ray Background

The recently detected cross-correlation signal between the unresolved CIB (3.6 and 4.5) and CXB (0.5–2keV) fluctuations was suggested to originate from black holes in the early universe (Cappelluti et al., 2013). After accounting for unresolved AGN and X-ray binaries within galaxies, Helgason et al. (2014) find that a tentative CIBCXB signal (2.5) remains at large-scales exhibiting the same shape as the CIB fluctuation power spectrum. From the definition of the spatial coherence and that one can write
| (17) |
where is the CIBCXB cross rms-fluctuation. Taken at face value, the large scale average (3′-30′) of this measurement gives . With the CIB fluctuations being roughly (see Section 2) we must have to satisfy the CIBCXB correlation. From Equations 17 and 1, the implied CXB flux is
| (18) |
Since is minimized for perfectly coherent sources, , this value represents the amount of X-ray flux associated with the CIB sources whereas it is a lower limit for the total unresolved CXB. However, this flux can be accommodated by independent measurements of the unresolved CXB in (Hickox & Markevitch, 2006) but is only marginally consistent with Moretti et al. (2012) who find only to be still unresolved555 We have converted the 1.5keV flux of Moretti et al. (2012) to 0.5–2keV using their spectral index . However, Moretti et al. (2012) do not include energies keV in their fit for the CXB spectrum which could be the source of their lower derived 0.5–2 keV flux. On the other hand, the required could itself be reduced if i) the large scale clustering of the underlying sources is stronger, say with , or ii) if the CIBCXB level at large scales is actually lower in reality, which is possible within the uncertainties, bringing it into agreement with low- AGN and XRBs (Helgason et al., 2014).
To illustrate these requirements, we display four simplistic SEDs in Figure 10 where we assume an optical/UV component and an X-ray component that is a factor of less energetic. We refer to these in terms of the X-ray to optical ratio, and respectively where with and integrated in the ranges keV and respectively, with . These ratios are already significantly lower than locally observed AGN which exhibit on average but a suppressed X-ray component is possible for highly obscured BHs. The ionizing photons are then absorbed by the thick gas and reprocessed into nebular emission in the UV/optical (Ly-, free-free), enhancing the CIB contribution (Yue et al., 2013b). In this way, a larger fraction of the bolometric luminosity ends up in the CIB, requiring less accretion onto BHs (see Fig. 9). We display the emerging SED from the highly obscured DCBH model of Yue et al. (2013b) in Figure 10 for comparison. The energy at longer IR/radio wavelengths, and shorter -ray wavelengths are assumed to be negligible in comparison.
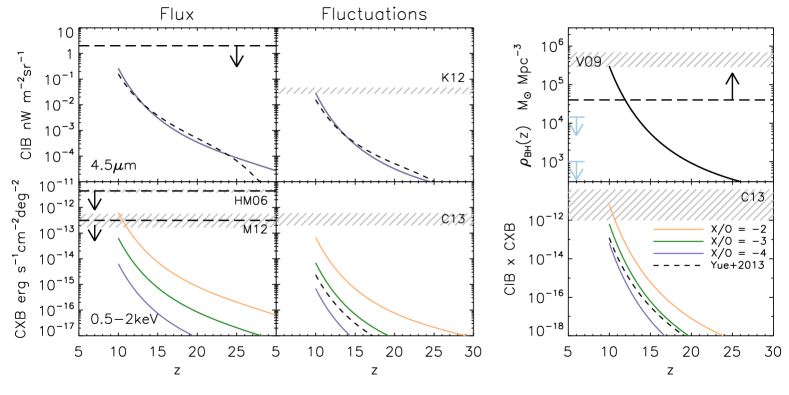
Figure 11 shows the cumulative CIB and CXB flux including fluctuations and CIBCXB cross fluctuations resulting from these broad-band SEDs. Because the shape of the growth history does not matter much, we simply assume a scenario in which all black holes grow at the Eddington rate with , reaching a fixed accreted mass density at ()
| (19) |
where Gyr is the Eddington time scale. The results are also not sensitive to the choice of as long as we keep and fixed. We have chosen such that the is reproduced. We find that the indicative large-scale CIBCXB signal can only be attained when . At the same time, the unresolved CXB implied by is in slight tension (1-) with the most stringent limits measured by Moretti et al. (2012) (see Fig. 11 bottom left). The spectrum of Yue et al. (2013b) having is shown as a dashed line in Figure 11, and appears notably below the CIBCXB requirement. This means that the Yue et al. (2013b) model actually falls short of the X-ray energy implied by the coherent CXB levels but is nevertheless consistent with the CIB levels.
It is important to emphasize that the sources producing the CIB and CXB are not necessarily the same physical emitters and are in general a mixture of stars and BHs sharing the same large scale structures. However, if they are predominantly BHs emitting in both optical and X-rays they will be accompanied by ionizing UV emission. For AGN spectra, this contribution is estimated by connecting the optical and X-ray part of the spectrum with a power law slope, shown as dashed lines in Figure 10. If we adopt the measured amplitudes of the CIB and CXB fluctuations we obtain a slope ranging from to and the resulting ionization rate exceeds the recombination rate in all cases such that . This means that in the presence of such production rate of ionizing photons at , the Universe will reionize in the matter of tens of Myr. For the CIBCXB signal to arise from the same type of sources therefore requires the suppression of UV photons escaping into the IGM () e.g. the black holes to be ultra-obscured (Ricotti et al., 2005; Comastri et al., 2015). This would be easier with unconventional BHs such as DCBHs rather than X-ray binaries from stellar remnants which are much less obscured and are limited in growth by the mass and lifetime of the companion star (e.g. Yue et al., 2014; Tanaka & Li, 2014; Pacucci & Ferrara, 2015). Also, for an abundant population of small BHs, a proportionally greater fraction of the net mass goes into the seed of the gravitational collapse and does not contribute to .
5 Summary and discussion
In this paper, we assessed the possibility that the established clustering signal in the source-subtracted CIB fluctuations at near-IR originates in the early universe. We consider emission from star formation and black hole accretion during the first 500 Myrs and establish the physical requirements and consequences to reach the measured CIB values. Our results can be broadly summarized as follows:
-
•
The contribution from high- galaxies, with star formation efficiency set to to match the LF from the deep HST Legacy surveys, cannot reproduce the levels of unresolved fluctuations in the near-IR for any reasonable extrapolation, producing merely flux at . In fact, faint galaxies at intermediate- make a larger contribution but are themselves insufficient to account for the entire clustering signal (Helgason et al., 2012). This conclusion is in agreement with previous studies (Fernandez et al., 2012; Cooray et al., 2012a; Yue et al., 2013a).
-
•
A simple extrapolation of the faint-end of the LF suggests that high- galaxies will become significant once sources have been removed down to . Using the CIB to probe these populations will therefore require JWST (Kashlinsky et al., 2015) and/or cross-correlation techniques (Atrio-Barandela & Kashlinsky, 2014).
-
•
For more energetically efficient modes of star formation, we find that heavier IMFs still require high star formation efficiencies which must either take place in small halos or end before . The ionizing photons associated with such a population would have to be suppressed to avoid rapid reionization and to enhance the nebular emission contributing to the CIB. In other words, it would require very low escape fractions, , in low-mass systems towards high redshifts (see also Fernandez et al., 2010). This is contrary to what is found in theoretical studies (Ferrara & Loeb, 2013; Kuhlen & Faucher-Giguère, 2012).
-
•
The cumulative CIB contribution of the fossils of the first galaxies that contain old stellar populations radiating throughout cosmic history is comparable to that of their high- progenitors. Since many such systems will merge or become satellites of larger galaxies, their net contribution to the source-subtracted CIB is smaller and can be safely neglected as long as the contribution of the high- counterparts is also low.
-
•
For the CIB fluctuations to be produced by accreting black holes, one requires vigorous accretion rates in the early universe reaching by . This quantitative limit assumes a constant efficiency but is mostly independent of the accretion rate history and BH seed masses. The accretion must be very radiatively efficient at early times and then drop to inefficient growth throughout most of the remaining cosmic time with the resulting population largely unaccounted for in the SMBH census in local universe (Vika et al., 2009). In addition, this population must be extremely gas-obscured in order to i) avoid reionizing the universe too rapidly, ii) to suppress the associated soft X-ray background, iii) to enhance the fraction of energy emitted in the UV as reprocessed nebular emission. Yue et al. (2013b) have designed a novel model of DCBH formation that is broadly consistent with these requirements.
-
•
For the expected level of clustering of sources (both at low and high-), the minimum soft CXB flux implied by the measured CIBCXB cross-correlation, , is only marginally consistent with the most stringent CXB limits (Moretti et al., 2012). At face value this means that either i) that high- BHs require the entire available unresolved CXB, ii) the clustering of the underlying sources is stronger (e.g. more biased) with at sub-degree scales, or iii) the high current uncertainty of the CIBCXB level at large scales could eventually bring it into agreement with low- AGN and XRBs (Helgason et al., 2014).
In this paper, we explored the physical requirements for stellar emission and accretion separately. It is however entirely possible, and in fact plausible, that the CIB and CXB are not produced by the same physical sources. The most intuitive scenario would have the CIB produced by stars, whereas accreting black holes sharing the same structures are responsible for the CIBCXB correlation. This would be a more natural way to obtain the ratio, which is unconventional for BHs only. The requirements for BHs to produce the CIBCXB component only, either stellar remnants or DCBHs, are much less energetically demanding than for the single-population explanation of the CIB and CIBCXB fluctuations. However, whereas rapid reionization is more easily avoided, one still requires the entire unresolved CXB available and is then left with the problem of explaining the CIB, the subject of this paper, by other means.
Our study of stellar sources isolates a narrow corner of parameters required for explaining the properties of the measured CIB fluctuations in terms of physics and evolution at high-. The predominant contributions would then have to come from very massive stars (), and accreting black holes, with non-instantaneous reionization in a highly clumped IGM. The area covered by this narrow corner may be widened by a factor of a few by relaxing assumptions of constancy of parameters such as or . Apart from nucleosynthesis and accretion, an additional emission component at high may come from stellar collisions in the dense stellar system phase which may result from stellar dynamical evolution of the early systems (e.g. Kashlinsky & Rees, 1983). The specific weight of this component is hard to quantify in a robust model-independent manner, but it may result in additional energy releases and ultimately formation of supermassive BHs (Begelman & Rees, 1978). It is important to emphasize that narrow allowed parameter-space is predicated on 1) the assumption of accurate estimate of the power contained in the primordial density spectrum at very small scales (comoving kpc), and 2) the assumption of its time-invariance after the first sources form. The first drives the collapse of the first halos with tiny modifications in the amount of power leading to exponentially different and, consequently, different, potentially larger CIB. The second possibility may arise from the inevitable and highly complex interaction between the condition of the density field which forms early collapsing objects and the energy releasing sources (e.g. Ostriker & Cowie, 1981; Rees, 1985). In this context, recent studies have found that high- galaxies may have had to form surprisingly early to account for the weakening of the exponential decline at the bright end of the LF with increasing redshift Finkelstein et al. (2015). This could be achieved by an unusually early collapse with respect to standard clustering theory, or an increased star formation efficiency making the stellar-to-halo mass ratio appear to rise with increasing redshift (Steinhardt et al., 2015). In order to have a significant impact on the CIB however, these effect must also be present in lower mass systems which contribute the bulk of the CIB.
All this argues for empirically measuring the CIB fluctuations with required fidelity, establishing its nature and then constructing and identifying the implied physics models for the sources producing the signal with all its properties. This has been demonstrated in multi-wavelength cross-correlation studies that provide further constraints for theoretical models of both low- and high- sources (e.g. Cappelluti et al., 2013; Thacker et al., 2014). Additional information on the physics and evolution at early times would come by looking for correlations between the CIB and 21 cm maps (Fernandez et al., 2014; Mao, 2014). Euclid’s large sky coverage and wavelengths make it particularly suitable for using its to-be-measured CIB fluctuations to isolate emissions from the epoch of re-ionization (Kashlinsky et al. 2015, submitted) and identifying the condition of the IGM by cross-correlating Euclid’s measured source-subtracted all-sky CIB and CMB maps (Atrio-Barandela & Kashlinsky, 2014). A specific experiment has been recently proposed with the JWST/NIRCAM to probe the Lyman-break of the CIB component and to tomographically reconstruct the emissions out to (Kashlinsky et al., 2015); the Lyman tomography method proposed there was shown to already lead to interesting limits at from the available Spitzer CIB maps at 3.6 and 4.5. The nature of the CIB fluctuations should be resolvable in the coming decade and the emissions produced during the epoch of reionization identified from its properties, shedding light on the physics and evolution at that time.
ACKNOWLEDGMENTS
We thank B. Yue, A. Ferrara, N. Cappelluti and E. Komatsu for useful discussions. KH was supported by the European Union’s Seventh Framework Programme (FP7-PEOPLE-2013-IFF) under grant agreement number 628319-CIBorigins; and by NASA Headquarters under the NESSF Program Grant – NNX11AO05H. MR acknowledges support from NSF CDI-typeII grant CMMI1125285 and the Theoretical and Computational Astrophysics Network (TCAN) grant AST1333514. AK acknowledges NASA’s support for the Euclid LIBRAE project NNN12AA01C. VB was supported by NSF grant AST-1413501.
References
- Ackermann et al. (2012) Ackermann et al. 2012, Science, 338, 1190
- Arendt et al. (2010) Arendt, R. G., Kashlinsky, A., Moseley, S. H., & Mather, J. 2010, ApJS, 186, 10
- Ashby et al. (2013) Ashby, M. L. N., Willner, S. P., Fazio, G. G., Huang, J.-S., Arendt, R., Barmby, P., Barro, G., Bell, E. F., Bouwens, R., Cattaneo, A., Croton, D., Davé, R., Dunlop, J. S., Egami, E., Faber, S., Finlator, K., Grogin, N. A., Guhathakurta, P., Hernquist, L., Hora, J. L., Illingworth, G., Kashlinsky, A., Koekemoer, A. M., Koo, D. C., Labbé, I., Li, Y., Lin, L., Moseley, H., Nandra, K., Newman, J., Noeske, K., Ouchi, M., Peth, M., Rigopoulou, D., Robertson, B., Sarajedini, V., Simard, L., Smith, H. A., Wang, Z., Wechsler, R., Weiner, B., Wilson, G., Wuyts, S., Yamada, T., & Yan, H. 2013, ApJ, 769, 80
- Atrio-Barandela & Kashlinsky (2014) Atrio-Barandela, F. & Kashlinsky, A. 2014, ApJ, 797, L26
- Barkat et al. (1967) Barkat, Z., Rakavy, G., & Sack, N. 1967, Physical Review Letters, 18, 379
- Begelman & Rees (1978) Begelman, M. C. & Rees, M. J. 1978, MNRAS, 185, 847
- Behroozi et al. (2013) Behroozi, P. S., Wechsler, R. H., & Conroy, C. 2013, ApJ, 770, 57
- Biteau & Williams (2015) Biteau, J. & Williams, D. A. 2015, ArXiv e-prints
- Bouwens et al. (2007) Bouwens, R. J., Illingworth, G. D., Franx, M., & Ford, H. 2007, ApJ, 670, 928
- Bouwens et al. (2014) Bouwens, R. J., Illingworth, G. D., Oesch, P. A., Trenti, M., Labbe’, I., Bradley, L., Carollo, M., van Dokkum, P. G., Gonzalez, V., Holwerda, B., Franx, M., Spitler, L., Smit, R., & Magee, D. 2014, ArXiv e-prints
- Bovill & Ricotti (2009) Bovill, M. S. & Ricotti, M. 2009, ApJ, 693, 1859
- Bovill & Ricotti (2011a) —. 2011a, ApJ, 741, 17
- Bovill & Ricotti (2011b) —. 2011b, ApJ, 741, 18
- Bromm (2013) Bromm, V. 2013, Reports on Progress in Physics, 76, 112901
- Cappelluti et al. (2013) Cappelluti, N., Kashlinsky, A., Arendt, R. G., Comastri, A., Fazio, G. G., Finoguenov, A., Hasinger, G., Mather, J. C., Miyaji, T., & Moseley, S. H. 2013, ApJ, 769, 68
- Comastri et al. (2015) Comastri, A., Gilli, R., Marconi, A., Risaliti, G., & Salvati, M. 2015, A&A, 574, L10
- Cooray et al. (2004) Cooray, A., Bock, J. J., Keatin, B., Lange, A. E., & Matsumoto, T. 2004, ApJ, 606, 611
- Cooray et al. (2012a) Cooray, A., Gong, Y., Smidt, J., & Santos, M. G. 2012a, ApJ, 756, 92
- Cooray & Sheth (2002) Cooray, A. & Sheth, R. 2002, Phys. Rep., 372, 1
- Cooray et al. (2012b) Cooray, A., Smidt, J., de Bernardis, F., Gong, Y., Stern, D., Ashby, M. L. N., Eisenhardt, P., Frazer, C. C., Gonzalez, A. H., Kochanek, C. S., Kozlowski, S., & Wright, E. L. 2012b, Nature, 490, 514
- Cooray & Yoshida (2004) Cooray, A. & Yoshida, N. 2004, MNRAS, 351, L71
- Dwek & Arendt (1998) Dwek, E. & Arendt, R. G. 1998, ApJ, 508, L9
- Eisenstein & Hu (1998) Eisenstein, D. J. & Hu, W. 1998, ApJ, 496, 605
- Ellis et al. (2013) Ellis, R. S., McLure, R. J., Dunlop, J. S., Robertson, B. E., Ono, Y., Schenker, M. A., Koekemoer, A., Bowler, R. A. A., Ouchi, M., Rogers, A. B., Curtis-Lake, E., Schneider, E., Charlot, S., Stark, D. P., Furlanetto, S. R., & Cirasuolo, M. 2013, ApJ, 763, L7
- Fazio et al. (2004) Fazio, G. G., Ashby, M. L. N., Barmby, P., Hora, J. L., Huang, J.-S., Pahre, M. A., Wang, Z., Willner, S. P., Arendt, R. G., Moseley, S. H., Brodwin, M., Eisenhardt, P., Stern, D., Tollestrup, E. V., & Wright, E. L. 2004, ApJS, 154, 39
- Fernandez et al. (2012) Fernandez, E. R., Iliev, I. T., Komatsu, E., & Shapiro, P. R. 2012, ApJ, 750, 20
- Fernandez & Komatsu (2006) Fernandez, E. R. & Komatsu, E. 2006, ApJ, 646, 703
- Fernandez et al. (2010) Fernandez, E. R., Komatsu, E., Iliev, I. T., & Shapiro, P. R. 2010, ApJ, 710, 1089
- Fernandez et al. (2014) Fernandez, E. R., Zaroubi, S., Iliev, I. T., Mellema, G., & Jelić, V. 2014, MNRAS, 440, 298
- Ferrara & Loeb (2013) Ferrara, A. & Loeb, A. 2013, MNRAS, 431, 2826
- Finkelstein et al. (2014) Finkelstein, S. L., Ryan, Jr., R. E., Papovich, C., Dickinson, M., Song, M., Somerville, R., Ferguson, H. C., Salmon, B., Giavalisco, M., Koekemoer, A. M., Ashby, M. L. N., Behroozi, P., Castellano, M., Dunlop, J. S., Faber, S. M., Fazio, G. G., Fontana, A., Grogin, N. A., Hathi, N., Jaacks, J., Kocevski, D. D., Livermore, R., McLure, R. J., Merlin, E., Mobasher, B., Newman, J. A., Rafelski, M., Tilvi, V., & Willner, S. P. 2014, ArXiv e-prints
- Finkelstein et al. (2015) Finkelstein, S. L., Song, M., Behroozi, P., Somerville, R. S., Papovich, C., Milosavljevic, M., Dekel, A., Narayanan, D., Ashby, M. L. N., Cooray, A., Fazio, G. G., Ferguson, H. C., Koekemoer, A. M., Salmon, B. W., & Willner, S. P. 2015, ArXiv e-prints
- Furlanetto & Loeb (2005) Furlanetto, S. R. & Loeb, A. 2005, ApJ, 634, 1
- Greif & Bromm (2006) Greif, T. H. & Bromm, V. 2006, MNRAS, 373, 128
- Helgason et al. (2014) Helgason, K., Cappelluti, N., Hasinger, G., Kashlinsky, A., & Ricotti, M. 2014, ApJ, 785, 38
- Helgason et al. (2012) Helgason, K., Ricotti, M., & Kashlinsky, A. 2012, ApJ, 752, 113
- H.E.S.S. Collaboration (2013) H.E.S.S. Collaboration. 2013, A&A, 550, A4
- Hickox & Markevitch (2006) Hickox, R. C. & Markevitch, M. 2006, ApJ, 645, 95
- Hinshaw et al. (2013) Hinshaw, G., Larson, D., Komatsu, E., Spergel, D. N., Bennett, C. L., Dunkley, J., Nolta, M. R., Halpern, M., Hill, R. S., Odegard, N., Page, L., Smith, K. M., Weiland, J. L., Gold, B., Jarosik, N., Kogut, A., Limon, M., Meyer, S. S., Tucker, G. S., Wollack, E., & Wright, E. L. 2013, ApJS, 208, 19
- Hummer (1994) Hummer, D. G. 1994, MNRAS, 268, 109
- Iwamoto et al. (1998) Iwamoto, K., Mazzali, P. A., Nomoto, K., Umeda, H., Nakamura, T., Patat, F., Danziger, I. J., Young, T. R., Suzuki, T., Shigeyama, T., Augusteijn, T., Doublier, V., Gonzalez, J.-F., Boehnhardt, H., Brewer, J., Hainaut, O. R., Lidman, C., Leibundgut, B., Cappellaro, E., Turatto, M., Galama, T. J., Vreeswijk, P. M., Kouveliotou, C., van Paradijs, J., Pian, E., Palazzi, E., & Frontera, F. 1998, Nature, 395, 672
- Jeon et al. (2014) Jeon, M., Pawlik, A. H., Bromm, V., & Milosavljević, M. 2014, MNRAS, 444, 3288
- Johnson et al. (2009) Johnson, J. L., Greif, T. H., Bromm, V., Klessen, R. S., & Ippolito, J. 2009, MNRAS, 399, 37
- Kashlinsky (2005) Kashlinsky, A. 2005, Phys. Rep., 409, 361
- Kashlinsky et al. (2004) Kashlinsky, A., Arendt, R., Gardner, J. P., Mather, J. C., & Moseley, S. H. 2004, ApJ, 608, 1
- Kashlinsky et al. (2012) Kashlinsky, A., Arendt, R. G., Ashby, M. L. N., Fazio, G. G., Mather, J., & Moseley, S. H. 2012, ApJ, 753, 63
- Kashlinsky et al. (2005) Kashlinsky, A., Arendt, R. G., Mather, J., & Moseley, S. H. 2005, Nature, 438, 45
- Kashlinsky et al. (2007a) —. 2007a, ApJ, 654, L5
- Kashlinsky et al. (2007b) —. 2007b, ApJ, 654, L1
- Kashlinsky et al. (2007c) —. 2007c, ApJ, 666, L1
- Kashlinsky et al. (2015) Kashlinsky, A., Mather, J. C., Helgason, K., Arendt, R. G., Bromm, V., & Moseley, S. H. 2015, ApJ, 804, 99
- Kashlinsky et al. (2002) Kashlinsky, A., Odenwald, S., Mather, J., Skrutskie, M. F., & Cutri, R. M. 2002, ApJ, 579, L53
- Kashlinsky & Rees (1983) Kashlinsky, A. & Rees, M. J. 1983, MNRAS, 205, 955
- Keenan et al. (2010) Keenan, R. C., Trouille, L., Barger, A. J., Cowie, L. L., & Wang, W.-H. 2010, ApJS, 186, 94
- Kuhlen & Faucher-Giguère (2012) Kuhlen, M. & Faucher-Giguère, C.-A. 2012, MNRAS, 423, 862
- Leitherer et al. (1999) Leitherer, C., Schaerer, D., Goldader, J. D., González Delgado, R. M., Robert, C., Kune, D. F., de Mello, D. F., Devost, D., & Heckman, T. M. 1999, ApJS, 123, 3
- Limber (1953) Limber, D. N. 1953, ApJ, 117, 134
- Madau & Pozzetti (2000) Madau, P. & Pozzetti, L. 2000, MNRAS, 312, L9
- Madau et al. (2014) Madau, P., Weisz, D. R., & Conroy, C. 2014, ApJ, 790, L17
- Mao (2014) Mao, X.-C. 2014, ApJ, 790, 148
- Marconi et al. (2004) Marconi, A., Risaliti, G., Gilli, R., Hunt, L. K., Maiolino, R., & Salvati, M. 2004, MNRAS, 351, 169
- Matsumoto et al. (2015) Matsumoto, T., Kim, M. G., Pyo, J., & Tsumura, K. 2015, ArXiv e-prints
- Matsumoto et al. (2005) Matsumoto, T., Matsuura, S., Murakami, H., Tanaka, M., Freund, M., Lim, M., Cohen, M., Kawada, M., & Noda, M. 2005, ApJ, 626, 31
- Matsumoto et al. (2011) Matsumoto, T., Seo, H. J., Jeong, W.-S., Lee, H. M., Matsuura, S., Matsuhara, H., Oyabu, S., Pyo, J., & Wada, T. 2011, ApJ, 742, 124
- Mazin & Raue (2007) Mazin, D. & Raue, M. 2007, A&A, 471, 439
- McLure et al. (2009) McLure, R. J., Cirasuolo, M., Dunlop, J. S., Foucaud, S., & Almaini, O. 2009, MNRAS, 395, 2196
- Meyer et al. (2012) Meyer, M., Raue, M., Mazin, D., & Horns, D. 2012, A&A, 542, A59
- Mitra et al. (2013) Mitra, S., Ferrara, A., & Choudhury, T. R. 2013, MNRAS, 428, L1
- Moretti et al. (2012) Moretti, A., Vattakunnel, S., Tozzi, P., Salvaterra, R., Severgnini, P., Fugazza, D., Haardt, F., & Gilli, R. 2012, A&A, 548, A87
- Oke & Gunn (1983) Oke, J. B. & Gunn, J. E. 1983, ApJ, 266, 713
- O’Shea et al. (2015) O’Shea, B. W., Wise, J. H., Xu, H., & Norman, M. L. 2015, ArXiv e-prints
- Ostriker & Cowie (1981) Ostriker, J. P. & Cowie, L. L. 1981, ApJ, 243, L127
- Pacucci & Ferrara (2015) Pacucci, F. & Ferrara, A. 2015, MNRAS, 448, 104
- Pawlik et al. (2015) Pawlik, A. H., Schaye, J., & Dalla Vecchia, C. 2015, ArXiv e-prints
- Planck Collaboration et al. (2013) Planck Collaboration, Ade, P. A. R., Aghanim, N., Armitage-Caplan, C., Arnaud, M., Ashdown, M., Atrio-Barandela, F., Aumont, J., Baccigalupi, C., Banday, A. J., & et al. 2013, ArXiv e-prints
- Planck Collaboration et al. (2015) Planck Collaboration, Ade, P. A. R., Aghanim, N., Arnaud, M., Ashdown, M., Aumont, J., Baccigalupi, C., Banday, A. J., Barreiro, R. B., Bartlett, J. G., & et al. 2015, ArXiv e-prints
- Press & Schechter (1974) Press, W. H. & Schechter, P. 1974, ApJ, 187, 425
- Rees (1985) Rees, M. J. 1985, MNRAS, 213, 75P
- Ricotti & Gnedin (2005) Ricotti, M. & Gnedin, N. Y. 2005, ApJ, 629, 259
- Ricotti et al. (2002a) Ricotti, M., Gnedin, N. Y., & Shull, J. M. 2002a, ApJ, 575, 33
- Ricotti et al. (2002b) —. 2002b, ApJ, 575, 49
- Ricotti et al. (2008) —. 2008, ApJ, 685, 21
- Ricotti et al. (2005) Ricotti, M., Ostriker, J. P., & Gnedin, N. Y. 2005, MNRAS, 357, 207
- Ricotti & Shull (2000) Ricotti, M. & Shull, J. M. 2000, ApJ, 542, 548
- Robertson et al. (2015) Robertson, B. E., Ellis, R. S., Furlanetto, S. R., & Dunlop, J. S. 2015, ApJ, 802, L19
- Salvaterra & Ferrara (2006) Salvaterra, R. & Ferrara, A. 2006, MNRAS, 367, L11
- Salvaterra et al. (2012) Salvaterra, R., Haardt, F., Volonteri, M., & Moretti, A. 2012, A&A, 545, L6
- Salvaterra et al. (2006) Salvaterra, R., Magliocchetti, M., Ferrara, A., & Schneider, R. 2006, MNRAS, 368, L6
- Santos et al. (2002) Santos, M. R., Bromm, V., & Kamionkowski, M. 2002, MNRAS, 336, 1082
- Schaerer (2002) Schaerer, D. 2002, A&A, 382, 28
- Seljak (2000) Seljak, U. 2000, MNRAS, 318, 203
- Seo et al. (2015) Seo, H. J., Lee, H. M., Matsumoto, T., Jeong, W.-S., Lee, M. G., & Pyo, J. 2015, ArXiv e-prints
- Shankar et al. (2004) Shankar, F., Salucci, P., Granato, G. L., De Zotti, G., & Danese, L. 2004, MNRAS, 354, 1020
- Sheth et al. (2001) Sheth, R. K., Mo, H. J., & Tormen, G. 2001, MNRAS, 323, 1
- Soltan (1982) Soltan, A. 1982, MNRAS, 200, 115
- Steinhardt et al. (2015) Steinhardt, C. L., Capak, P., Masters, D., & Speagle, J. S. 2015, ArXiv e-prints
- Tanaka et al. (2012) Tanaka, T., Perna, R., & Haiman, Z. 2012, MNRAS, 425, 2974
- Tanaka & Li (2014) Tanaka, T. L. & Li, M. 2014, MNRAS, 439, 1092
- Thacker et al. (2014) Thacker, C., Gong, Y., Cooray, A., De Bernardis, F., Smidt, J., & Mitchell-Wynne, K. 2014, ArXiv e-prints
- Thompson et al. (2007a) Thompson, R. I., Eisenstein, D., Fan, X., Rieke, M., & Kennicutt, R. C. 2007a, ApJ, 657, 669
- Thompson et al. (2007b) —. 2007b, ApJ, 666, 658
- Tinker et al. (2008) Tinker, J., Kravtsov, A. V., Klypin, A., Abazajian, K., Warren, M., Yepes, G., Gottlöber, S., & Holz, D. E. 2008, ApJ, 688, 709
- Treister et al. (2013) Treister, E., Schawinski, K., Volonteri, M., & Natarajan, P. 2013, ApJ, 778, 130
- Tsumura et al. (2013) Tsumura, K., Matsumoto, T., Matsuura, S., Sakon, I., & Wada, T. 2013, ArXiv e-prints
- Vika et al. (2009) Vika, M., Driver, S. P., Graham, A. W., & Liske, J. 2009, MNRAS, 400, 1451
- Volonteri & Bellovary (2012) Volonteri, M. & Bellovary, J. 2012, Reports on Progress in Physics, 75, 124901
- Weisz et al. (2014) Weisz, D. R., Dolphin, A. E., Skillman, E. D., Holtzman, J., Gilbert, K. M., Dalcanton, J. J., & Williams, B. F. 2014, ApJ, 789, 148
- Yue et al. (2013a) Yue, B., Ferrara, A., Salvaterra, R., & Chen, X. 2013a, MNRAS, 431, 383
- Yue et al. (2013b) Yue, B., Ferrara, A., Salvaterra, R., Xu, Y., & Chen, X. 2013b, MNRAS, 433, 1556
- Yue et al. (2014) —. 2014, MNRAS, 440, 1263
- Zackrisson et al. (2011) Zackrisson, E., Rydberg, C.-E., Schaerer, D., Östlin, G., & Tuli, M. 2011, ApJ, 740, 13
- Zemcov et al. (2014) Zemcov, M., Smidt, J., Arai, T., Bock, J., Cooray, A., Gong, Y., Kim, M. G., Korngut, P., Lam, A., Lee, D. H., Matsumoto, T., Matsuura, S., Nam, U. W., Roudier, G., Tsumura, K., & Wada, T. 2014, Science, 346, 732