A NuSTAR observation of disc reflection from close to the neutron star in 4U 1608–52
Abstract
Studying the reflection of X-rays off the inner edge of the accretion disc in a neutron star low-mass X-ray binary, allows us to investigate the accretion geometry and to constrain the radius of the neutron star. We report on a NuSTAR observation of 4U 1608–52 obtained during a faint outburst in 2014 when the neutron star, which has a known spin frequency of Hz, was accreting at 1–2 per cent of the Eddington limit. The 3–79 keV continuum emission was dominated by a power law, with an 1–2 per cent contribution from a 0.3–0.6 keV blackbody component. The high-quality NuSTAR spectrum reveals the hallmarks of disc reflection; a broad iron line peaking near 7 keV and a Compton back-scattering hump around 20–30 keV. Modelling the disc reflection spectrum points to a binary inclination of 30∘–40∘ and a small ‘coronal’ height of 8.5. Furthermore, our spectral analysis suggests that the inner disc radius extended to 7–10, close to the innermost stable circular orbit. This constrains the neutron star radius to 21 km and the redshift from the stellar surface to 0.12, for a mass of and a spin parameter of .
keywords:
accretion, accretion discs – stars: individual (4U 1608–52) – stars: neutron – X-rays: binaries.1 Introduction
Measuring the mass and radius of neutron stars would constrain their equation of state and thereby give insight into the behaviour of matter at supranuclear densities, a challenge that cannot be achieved in terrestrial laboratories. Since many proposed equations of state predict a range of masses for a given radius (see e.g., Lattimer, 2011, for a recent review), it is of particular interest to measure neutron star radii. Low-mass X-ray binaries (LMXBs) are promising targets to obtain such information, as the hot surface of the neutron star may be directly visible in the X-ray band.
When residing in an LMXB, a neutron star accretes matter from an accretion disc that is fed by a low-mass () companion star. Often LMXBs are transient, exhibiting orders of magnitude variation in their X-ray luminosity driven by similarly large variations in the mass-accretion rate. During quiescent episodes the X-ray luminosity is low () and little matter is thought to be accreted on to the neutron star. Thermal emission from the stellar surface may then be detected with sensitive X-ray instruments and used to measure neutron star radii (e.g., Rutledge et al., 1999; Webb & Barret, 2007; Guillot et al., 2011, 2013; Servillat et al., 2012; Heinke et al., 2006, 2014).
During outburst phases, on the other hand, matter is rapidly accreted on to the neutron star, typically generating an X-ray luminosity of 1–100 per cent of the Eddington limit (; Kuulkers et al., 2003). Although the overall X-ray emission is then dominated by that of the accretion flow, the neutron star becomes visible during type-I X-ray bursts; bright flashes of X-ray emission resulting from unstable thermonuclear burning of accreted H/He on the surface of the neutron star. Modelling the black-body spectra of these events also facilitates radius measurements (e.g., van Paradijs, 1979; Fujimoto & Gottwald, 1989; Güver et al., 2010; Suleimanov et al., 2011; Poutanen et al., 2014).
Both these methods rely on using appropriate neutron star atmosphere models, which has spurred intense discussion (e.g., Suleimanov et al., 2011; Heinke et al., 2014). Alternative means of constraining neutron star radii are offered by studying X-rays reflected off the inner edge of the accretion disc, which may extend very close to the stellar surface (e.g., Cackett et al., 2010; Miller et al., 2013a). The observable effects of disc reflection are a broad emission line in the Fe-K band (6.4–6.97 keV) and a Compton back-scattering hump peaking at 20–40 keV (Fabian et al., 1989).
Studying reflection spectra also offers valuable insight into the accretion geometry, such as the inner radius and inclination of the accretion disc as well as the height of the illuminating X-ray source, and how this is affected by the accretion rate or the magnetic field of the neutron star. Analysis of broad Fe lines in several neutron star LMXBs has revealed inner disc radii of 5–20 (e.g., Cackett et al., 2010; Egron et al., 2011; Sanna et al., 2014; Di Salvo et al., 2015, for recent studies), i.e., close to the innermost stable orbit (ISCO) in the Schwarzschild metric (). However, in some LMXBs the disc appears to be truncated at larger radii due to the pressure exerted by the magnetic field of the neutron star (e.g., GRO J1744-28 with 85; Degenaar et al., 2014), or due to evaporation of the inner disc at low accretion rates (e.g., HETE J1900.1–2455 with 25; Papitto et al., 2013).
Detecting a Compton hump in addition to a broad iron line requires high sensitivity at energies 10 keV, such as provided by the recently launched NuSTAR satellite (Harrison et al., 2013). High quality NuSTAR spectra can allow for new views of the accretion geometry in LMXBs (e.g., Miller et al., 2015), and constraints of neutron star radii (e.g., Ser X-1; Miller et al., 2013a).
1.1 4U 1608–52
In this work we report on the disc reflection spectrum measured by NuSTAR for the neutron star 4U 1608–52 (Grindlay & Gursky, 1976; Tananbaum et al., 1976). This transient LMXB is frequently active, with accretion outbursts typically recurring once every 1–2 yr (e.g., Lochner & Roussel-Dupre, 1994; Chen et al., 1997; Šimon, 2004; Galloway et al., 2008). Type-I X-ray bursts are regularly observed and have allowed for a distance estimate of kpc (e.g., Galloway et al., 2008; Poutanen et al., 2014). Moreover, rapid oscillations detected during type-I X-ray bursts revealed that the neutron star spins at Hz (Muno et al., 2001; Galloway et al., 2008). Renewed activity was detected from the source on 2014 October 5 with MAXI (Negoro et al., 2014).
2 Observations and analysis
We observed 4U 1608–52 simultaneously with NuSTAR and Swift (Gehrels et al., 2004) on 2014 October 16–17. Data reduction and analysis was carried out using tools incorporated in heasoft ver. 16.6. Throughout this work we assume a distance of 3.6 kpc and report errors as 90 per cent confidence levels.
2.1 NuSTAR
NuSTAR observed 4U 1608–52 between 23:00 ut on 2014 October 16 and 17:10 ut on October 17 (ID 90002002002). Standard screening and processing with nustardas (ver. 1.4.1) resulted in 32 ks on-target exposure time. We created light curves and spectra for the FPMA and FPMB employing the nuproducts tool. To obtain source events we used a circular extraction region with a radius of 120 arcsec, whereas a region of the same dimensions placed away from the source was used for the background.
Light curves obtained for the two modules were first background subtracted and then summed using lcmath. Initial inspection of the spectra revealed that the source was detected significantly above the background in the entire NuSTAR band (3–79 keV), and that the separate FPMA/FPMB data showed excellent agreement. We therefore combined these using addascaspec, which also generates the combined background spectrum and ancillary response file (arf). A combined redistribution matrix file (rmf) was created via addrmf, weighting the responses of the two modules by their exposure times. Using grppha we grouped the data to a minimum of 20 photons per spectral bin.
2.2 Swift
Simultaneous Swift/XRT data were obtained to provide energy coverage down to 0.5 keV. 4U 1608–52 was observed for 1.7 ks between 23:56 ut 2014 October 16 and 01:40 ut October 17 (ID 32322019), with the XRT operated in windowed timing (WT) mode. Using xselect we extracted source events from a box of 120 arcsec long and 40 arcsec wide. A box of the same dimensions placed away from the source was used to extract a background spectrum.
The WT light curve showed a stable intensity along the observation (), and we therefore extracted a single average spectrum. An arf was created using xrtmkarf and the latest rmf (ver. 15) was sourced from the calibration data base. The spectral data were grouped to a minimum of 20 photons per bin.
3 Results
3.1 NuSTAR light curve
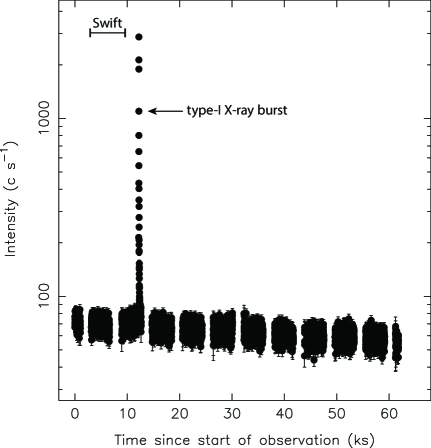
Fig. 1 shows the light curve of 4U 1608–52 obtained with NuSTAR. The source was detected at an average intensity of (3–79 keV, two modules combined). A strong 200-s long increase in intensity was registered 12 ks into the observation, caused by the occurrence of a type-I X-ray burst from the source. Analysis of this event will be presented in a separate work.
3.2 Spectral continuum
We examined the spectral continuum by fitting the NuSTAR data (excluding the X-ray burst) together with the Swift/XRT data in xspec (ver. 12.8; Arnaud, 1996). A constant multiplication factor was included to account for calibration differences. To model the interstellar absorption we used tbabs with vern cross-sections (Verner et al., 1996) and wilm abundances (Wilms et al., 2000).
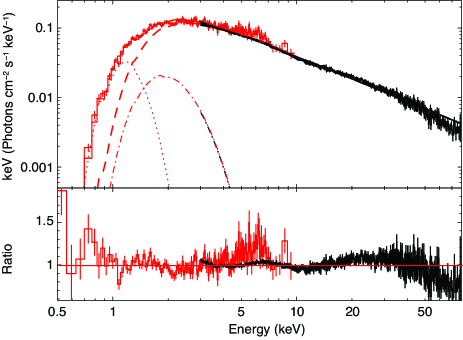
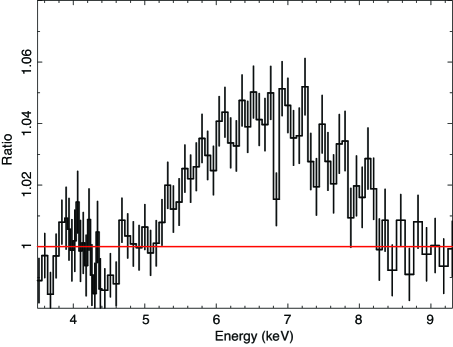
Any realistic combination of continuum models left large positive residuals around 5–8 and 20–30 keV. This is illustrated by Fig. 2, where we show a fit to a continuum consisting of a power law and two blackbody components. The prominent residuals can be interpreted as a broad Fe-K emission line, shown in more detail in Fig. 3, and the corresponding Compton hump. We therefore proceeded by modelling our data with physical reflection models.
3.3 Reflection spectrum
As can be seen in Fig. 2, the continuum emission at energies of 2 keV is strongly dominated by a hard spectral component. We therefore chose the relxilllp model, which calculates disc reflection features due to an illuminating power-law source (García et al., 2014). This new model features higher spectral resolution and updated atomic data with regard to other reflection models. Moreover, it combines the relativistic convolution kernel relconv_lp (Dauser et al., 2010) with the reflection grid xillver (García et al., 2013), in which the reflection spectrum is calculated for each emission angle rather than averaged. Both the illuminating power law and the reflected emission are fitted self-consistently.
In relxilllp the hard X-ray source, usually referred to as the corona, is assumed to be a point source located at a height above the accretion disc plane along the spin axis of the compact object. Although this ‘lamppost geometry’ is an oversimplification (albeit compact, the corona is likely not a point source), it provides an adequate description for several LMXBs (e.g., Miller et al., 2013b, 2015). The emissivity profile is calculated based on the height rather than assuming a (broken) power-law profile.
The fit parameters of the relxilllp model are the dimensionless spin , the binary inclination , the inner and outer disc radii and (expressed in terms of for the given ), the ionization parameter , the iron abundance (with respect to Solar), the reflection fraction (ratio of the reflected to primary emission between 20 and 40 keV), the normalization , and the index and high-energy cutoff of the power law. Since 4U 1608–52 has a known spin frequency, the dimensionless spin parameter can be calculated. For neutron stars this can be approximated as [ms] (Braje et al., 2000). Given that Hz (Muno et al., 2001; Galloway et al., 2008), we set in all our fits. Moreover, we fixed since the emissivity profile drops off steeply with increasing radius, so that reflection fits are not sensitive to the outer disc radius.
Fitting the spectral data required one or two soft emission components in addition to the reflection model, for which we used the model bbodyrad. The thermal emission may originate from the neutron star surface, the accretion disc, or a boundary layer between the two. We found that the relatively high extinction towards 4U 1608–52 and the limited number of counts in the Swift data caused considerable uncertainty in the spectral shape at 3 keV. To investigate to which extent this influenced the (reflection) spectrum at higher energies, we explored a number of different fits. These are summarized in Table 1 and discussed in more detail below.
We initially fitted the combined NuSTAR and Swift data using the full 0.5–79 keV energy range, which required two soft components (model 1 in Table 1). However, the obtained normalization of the 0.1 keV blackbody would imply an unphysically large emission radius of . Possibly, the requirement for this soft component is due to a calibration uncertainty that may arise for highly absorbed sources observed in WT mode and causes a bump at energies of 0.5–1 keV.111http://www.swift.ac.uk/analysis/xrt/digestcal.php To mitigate these possible effects we also performed fits in the 1–79 keV range, which required only one blackbody component (model 2 in Table 1).
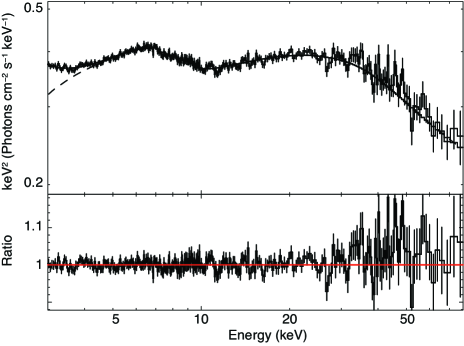
We also explored fits using only the NuSTAR spectral data. When leaving the hydrogen column density free (model 3 in Table 1) the obtained value is notably larger than for fits 1–2, and also larger than the values of reported previously (e.g., Penninx et al., 1989; Keek et al., 2008; Güver et al., 2010). We therefore also fitted the NuSTAR spectrum with fixed (model 4 in Table 1), shown in Fig. 4.
Importantly, we find that despite the considerably different parameter values that we obtain for the absorption and thermal emission component(s), the results obtained for the hard X-ray continuum and the reflection spectrum are robust (Table 1). Our fits point to a moderately low inclination of 30–40∘, consistent with observations of the optical counterpart (see Section 4.1). The obtained inner disc radius lies near the ISCO, 1.3–2.0 , and the coronal height is small, 8.5 . We find a reflection fraction of 1 and a high ionization parameter of , as may be expected given the breadth of the Fe line (Fig. 3).
We note that our spectral fits favour a high value for the power-law cutoff; keV. Although this is not unprecedented for neutron stars, it is well outside the NuSTAR bandpass. This could perhaps indicate that the spectral shape of the illuminating X-ray source (slightly) deviates from the cutoff power law that is incorporated in the relxilllp model.
Our different fits yield an unabsorbed flux in the 3–79 keV band of , of which 1–2 per cent is due to thermal emission. The uncertainty in the low-energy spectrum causes some spread in the inferred 0.5–79 keV fluxes; we obtain for fits 2–4, and for fit 1. The latter may be overestimated due to a possible calibration issue in the WT data. We therefore estimate that 4U 1608–52 accreted at 1–2 per cent of the Eddington limit during our observations.
| Model number | 1 | 2 | 3 | 4 |
|---|---|---|---|---|
| Fitted data | Swift+NuSTAR 0.5–79 keV | Swift+NuSTAR 1–79 keV | NuSTAR 3–79 keV | NuSTAR 3–79 keV |
| constant*tbabs* | (bbodyrad+bbodyrad+relxilllp) | (bbodyrad+relxilllp) | (bbodyrad+relxilllp) | (bbodyrad+relxilllp) |
| – | – | |||
| () | 2.0 fix | |||
| (keV) | ||||
| (km/10 kpc)2 | ||||
| (keV) | – | – | – | |
| (km/10 kpc)2 | – | – | – | |
| () | ||||
| (∘) | ||||
| () | ||||
| ( Solar) | ||||
| (keV) | ||||
| (dof) | 1.18 (1847) | 1.22 (1811) | 1.06 (1280) | 1.07 (1281) |
-
Notes. – The constant was fixed to 1 for the NuSTAR data and left free for the Swift spectrum. The outer disc radius of the relxilllp spectral component was always fixed at and the spin parameter was set to to correspond to the known spin frequency of Hz. The reflection fraction is calculated between 20 and 40 keV. Quoted errors reflect 90 per cent confidence levels.
4 Discussion
The frequently active transient neutron star LMXB 4U 1608–52 started a new, faint outburst in 2014 October. We obtained simultaneous NuSTAR and Swift observations during its initial hard X-ray spectral state. The continuum emission in the 3–79 keV NuSTAR band was dominated by non-thermal emission that can be described by a 2 power law, with a small (1–2 per cent) contribution from a soft emission component that can be modelled with an 0.3–0.6 keV blackbody. The hard X-ray continuum and the excellent sensitivity of NuSTAR at energies 10 keV resulted in a high-quality disc reflection spectrum, showing both a broad Fe-K emission line peaking near 7 keV and a Compton hump around 20–30 keV. We fitted the spectral data with the versatile disc reflection model relxilllp to investigate the accretion geometry of 4U 1608–52, and to obtain constraints on the radius of the neutron star.
4.1 Accretion geometry of 4U 1608–52
It is generally thought that in soft X-ray spectral states, when the accretion rate is high (10 per cent of the Eddington limit), the accretion disc extends to/near the ISCO, whereas in quiescence the inner disc radius lies far from the compact object (; e.g., Esin et al., 1997). Therefore it is expected that somewhere in between these extremes, in the hard X-ray spectral state, the inner edge of the disc should retreat. However, there is considerable debate whether the accretion disc is truncated throughout hard X-ray spectral states, or whether its inner radius only starts to recede below a certain accretion rate, because radii inferred from reflection and thermal emission components often yield opposing results (e.g., Rykoff et al., 2007; Gierliński et al., 2008; Tomsick et al., 2009; Reis et al., 2010; Done & Diaz Trigo, 2010; Kolehmainen et al., 2014; Plant et al., 2014). This discussion has mainly focused on black hole LMXBs. The accretion geometry could possibly be different in the hard X-ray spectral states of neutron star LMXBs, as the stellar surface and anchored magnetic field may come into play.
We estimate that 4U 1608–52 accreted at 1–2 per cent of the Eddington limit during our observations, which thus probe a relatively low accretion regime for disc reflection studies of neutron star LMXBs. Our spectral fits consistently point to an inner disc radius that lies close to the ISCO: 1.3–2.0. Given that for a neutron star spinning at , this would correspond to 7–1015–21 km for a mass of (a reasonable choice based on the recent overview of Lattimer & Steiner, 2014). Our obtained inner disc radius for 4U 1608–52 is within the range found for several other neutron star LMXBs (5–20; e.g., Cackett et al., 2010; Egron et al., 2011). Our study does not indicate significant truncation of the accretion disc, despite the low accretion rate (see also Di Salvo et al., 2015). Due to uncertainties in our data at 3 keV, we cannot obtain reliable radius estimates from the thermal emission in 4U 1608–52.
Our spectral analysis further points to a moderately low disc inclination angle of 30∘–40∘. This is consistent with the lack of dips/eclipses from 4U 1608–52 and with the possible detection of a ‘superhump’ (Wachter et al., 2002), which should be best observed at low inclination (e.g., Haswell et al., 2001). Furthermore, we find that the illuminating hard X-ray source is likely located close to the neutron star, at a height of 8.5 . This may be consistent with the growing consensus that the hard X-ray corona in similar accreting systems (black hole LMXBs and active galactic nuclei) is very compact (e.g., Reis & Miller, 2013; Fabian et al., 2014, for recent discussion). Alternatively, the very small height inferred from our reflection fits could point to the boundary layer between the accretion disc and the stellar surface as the primary source of the illuminating hard X-rays (e.g., Gierliński & Done, 2002).
4.2 Neutron star radius constraints
Since the disc must truncate at the surface of the neutron star if not at larger radii, reflection modelling can be used to place constraints on the neutron star radius (e.g., Cackett et al., 2010; Miller et al., 2013a). For a gravitational redshift of , the inner disc radius implied by our fits would constrain the neutron star radius to 21 km, hence the gravitational redshift to 0.12 for an assumed mass of . These constraints from the disc reflection spectrum of 4U 1608–52 are consistent with those obtained from its type-I X-ray bursts (Güver et al., 2010; Poutanen et al., 2014).
Acknowledgements
We thank the referee, Craig Heinke, for thoughtful comments. N.D. acknowledges support via an EU Marie Curie Intra-European fellowship under contract no. FP-PEOPLE-2013-IEF-627148. This work is based on data from the NuSTAR mission, a project led by California Institute of Technology, managed by the Jet Propulsion Laboratory, and funded by NASA. We thank Neil Gehrels and the Swift team for rapid scheduling of observations.
References
- Arnaud (1996) Arnaud K., 1996, in G. Jacoby, J. Barnes, eds, Astronomical Data Analysis Software and Systems V. Astronomical Society of the Pacific Conference Series, Vol. 101, p. 17
- Braje et al. (2000) Braje T. M., Romani R. W., Rauch K. P., 2000, ApJ, 531, 447
- Cackett et al. (2010) Cackett E. et al., 2010, ApJ, 720, 205
- Chen et al. (1997) Chen W., Shrader C., Livio M., 1997, ApJ, 491, 312
- Dauser et al. (2010) Dauser T., et al., 2010, MNRAS, 409, 1534
- Degenaar et al. (2014) Degenaar N., et al., 2014, ApJL, 796, L9
- Di Salvo et al. (2015) Di Salvo T. et al., 2015, MNRAS, 449, 2794
- Done & Diaz Trigo (2010) Done C., Diaz Trigo M., 2010, MNRAS, 407, 2287
- Egron et al. (2011) Egron E. et al., 2011, A&A, 530, A99
- Esin et al. (1997) Esin A., McClintock J., Narayan R., 1997, ApJ, 489, 865
- Fabian et al. (1989) Fabian A., et al., 1989, MNRAS, 238, 729
- Fabian et al. (2014) Fabian A. C., et al., 2014, MNRAS, 439, 2307
- Fujimoto & Gottwald (1989) Fujimoto M. Y., Gottwald M., 1989, MNRAS, 236, 545
- Galloway et al. (2008) Galloway D., et al., 2008, ApJS, 179, 360
- García et al. (2013) García J., et al., 2013, ApJ, 768, 146
- García et al. (2014) García J. et al., 2014, ApJ, 782, 76
- Gehrels et al. (2004) Gehrels N. et al., 2004, ApJ, 611, 1005
- Gierliński & Done (2002) Gierliński M., Done C., 2002, MNRAS, 337, 1373
- Gierliński et al. (2008) Gierliński M., Done C., Page K., 2008, MNRAS, 388, 753
- Grindlay & Gursky (1976) Grindlay J., Gursky H., 1976, ApJL, 209, L61
- Guillot et al. (2011) Guillot S., Rutledge R., Brown E., 2011, ApJ, 732, 88
- Guillot et al. (2013) Guillot S., et al., 2013, ApJ, 772, 7
- Güver et al. (2010) Güver T., et al., 2010, ApJ, 712, 964
- Harrison et al. (2013) Harrison F. A. et al., 2013, ApJ, 770, 103
- Haswell et al. (2001) Haswell C. A., et al., 2001, MNRAS, 321, 475
- Heinke et al. (2006) Heinke C., et al., 2006, ApJ, 644, 1090
- Heinke et al. (2014) Heinke C. et al., 2014, MNRAS, 444, 443
- Keek et al. (2008) Keek L., et al., 2008, A&A, 479, 177
- Kolehmainen et al. (2014) Kolehmainen M., Done C., Díaz Trigo M., 2014, MNRAS, 437, 316
- Kuulkers et al. (2003) Kuulkers E., et al., 2003, A&A, 399, 663
- Lattimer (2011) Lattimer J. M., 2011, Ap&SS, 336, 67
- Lattimer & Steiner (2014) Lattimer J. M., Steiner A. W., 2014, ApJ, 784, 123
- Lochner & Roussel-Dupre (1994) Lochner J. C., Roussel-Dupre D., 1994, ApJ, 435, 840
- Miller et al. (2013a) Miller J. M. et al., 2013a, ApJL, 779, L2
- Miller et al. (2013b) Miller J. M. et al., 2013b, ApJL, 775, L45
- Miller et al. (2015) Miller J. M. et al., 2015, ApJL, 799, L6
- Muno et al. (2001) Muno M. P., et al., 2001, ApJL, 553, L157
- Negoro et al. (2014) Negoro H. et al., 2014, The Astronomer’s Telegram, 6550
- Papitto et al. (2013) Papitto A. et al., 2013, MNRAS, 429, 3411
- Penninx et al. (1989) Penninx W., et al., 1989, A&A, 208, 146
- Plant et al. (2014) Plant D. S., O’Brien K., Fender R. P., 2014, arXiv:1411.7411
- Poutanen et al. (2014) Poutanen J., et al., 2014, MNRAS, 442, 3777
- Reis & Miller (2013) Reis R., Miller J., 2013, ApJL, 769, L7
- Reis et al. (2010) Reis R. C., Fabian A. C., Miller J. M., 2010, MNRAS, 402, 836
- Rutledge et al. (1999) Rutledge R., et al., 1999, ApJ, 514, 945
- Rykoff et al. (2007) Rykoff E., et al., 2007, ApJ, 666, 1129
- Sanna et al. (2014) Sanna A., et al., 2014, MNRAS, 440, 3275
- Servillat et al. (2012) Servillat M., et al., 2012, MNRAS, 423, 1556
- Šimon (2004) Šimon V., 2004, A&A, 418, 617
- Suleimanov et al. (2011) Suleimanov V., et al., 2011, ApJ, 742, 122
- Tananbaum et al. (1976) Tananbaum H., et al., 1976, ApJL, 209, L125
- Tomsick et al. (2009) Tomsick J., et al., 2009, ApJL, 707, L87
- van Paradijs (1979) van Paradijs J., 1979, ApJ, 234, 609
- Verner et al. (1996) Verner D., et al., 1996, ApJ, 465, 487
- Wachter et al. (2002) Wachter S., et al., 2002, ApJ, 568, 901
- Webb & Barret (2007) Webb N., Barret D., 2007, ApJ, 671, 727
- Wilms et al. (2000) Wilms J., Allen A., McCray R., 2000, ApJ, 542, 914