dc and ac magnetic properties of thin-walled Nb cylinders with and without a row of antidots
Abstract
dc and ac magnetic properties of two thin-walled superconducting Nb cylinders with a rectangular cross-section are reported. Magnetization curves and the ac response were studied on as-prepared and patterned samples in magnetic fields parallel to the cylinder axis. A row of micron-sized antidots (holes) was made in the film along the cylinder axis. Avalanche-like jumps of the magnetization are observed for both samples at low temperatures for magnetic fields not only above , but in fields lower than in the vortex-free region. The positions of the jumps are not reproducible and they change from one experiment to another, resembling vortex lattice instabilities usually observed for magnetic fields larger than . At temperatures above and the magnetization curves become smooth for the patterned and the as-prepared samples, respectively. The magnetization curve of a reference planar Nb film in the parallel field geometry does not exhibit jumps in the entire range of accessible temperatures. The ac response was measured in constant and swept dc magnetic field modes. Experiment shows that ac losses at low magnetic fields in a swept field mode are smaller for the patterned sample. For both samples the shapes of the field dependences of losses and the amplitude of the third harmonic are the same in constant and swept field near . This similarity does not exist at low fields in a swept mode.
pacs:
74.25.F-, 74.25.Op, 74.70.AdI Introduction
Penetration of magnetic flux into hollow superconducting cylinders is a long standing field of interest. The Little-Parks effect and the quantization of trapped flux were intensively studied during the last fifty years LITTLE ; DOU ; VEKHT . Recent advances in nanotechnology have made it possible for studying experimentally superconducting properties of thin films with different arrays of antidots, see for example, Motta1 and references therein. In particular, for the observation of the aforementioned effects, cylinders or antidots of small diameter are required. At the same time, the study of hollow thin-walled cylinders with macroscopic sizes in magnetic fields parallel to its axis has been much less well studied. It was expected that quantum phenomena cannot be observed in such samples because of the fact that one flux quanta for cylinders with a cross section area of cm2 corresponds to a magnetic field about Oe. In this case magnetization will be a smooth function of the magnetic field. However, experimental results obtained recently for thin-walled macroscopic cylinders do not agree with this expectation. Namely, in such Nb cylinders we succeeded in monitoring the magnetic moment of the current circulating in the walls and observed dc magnetic moment jumps even in fields much lower than of the film itself Katz1 . So far it is not clear what mechanism is responsible for such flux jumps. Under an axial magnetic field the cylinder walls screen weak external fields, provided that , where is the cylinder radius, is the wall thickness, and is the London penetration depth DOU ; PG ; KITTEL . Therefore, it is expected, that a dc magnetic field, , will penetrate into the cylinder as soon as the current in the wall exceeds the critical current and no field penetration should be observed at lower fields. Only above , vortices created at the outer cylinder surface can move into the cylinder. For a magnetic field oriented perpendicular to the Nb film surface such vortex motion leads to flux jumps NOWAK ; STAM . These flux jumps were interpreted as a thermomagnetic instability of the critical state. It was demonstrated that in a sample with an array of antidots flux jump propagates along the antidots row MOTTA2 .
Nucleation of the superconducting phase in a thin surface sheath in decreasing magnetic fields parallel to the sample surface was predicted by Saint-James and de Gennes DSJ . They showed that nucleation occurs in a magnetic field . Experimental confirmations of this prediction were obtained soon after their work appeared. The experimental methods for this confirmation were dc resistivity and ac susceptibility measurements ROLL . It was found that low frequency losses in superconductors in surface superconducting states (SSS) can exceed losses in the normal state BURGER ; ROLL .
A swept dc magnetic field qualitatively changes the character of the ac response. Specifically, the penetration of the ac magnetic field into the sample takes place not only for but also for , in sharp contrast to the case of constant dc fields STR2 ; MAX ; GENKIN22 . The effect of a swept dc field can more suitably be investigated by using hollow thin-walled superconducting cylinders, rather than by bulk samples, because one can control the field transmission through their walls. Previously, we have shown Genkin1 that in a thin-walled cylinder in the mixed state, the effect of sweeping a dc field on the ac response is due to an enhancement of the vortex motion through the wall. Above , however, this picture is no longer appropriate and the experimental data were explained within the framework of a simple relaxation model Katz1 .
The goal of this paper is to study how antidots affect the penetration of dc and ac magnetic fields into thin-walled superconducting Nb cylinders of macroscopic sizes, with a rectangular cross section. We show that at low enough temperatures for both, a flat and a patterned samples, even in the vortex-free regime at , the dc magnetic field penetrates through the cylinder walls in an “avalanche”-like fashion. Jumps of the dc magnetic moment also become apparent at fields above at low temperatures. For both samples, the field values at which jumps occur vary from one measurement to another, indicating that one deals with transitions between metastable states. At temperatures above and the magnetization curves become smooth for the patterned and the as-prepared sample, respectively.
The ac response of both cylinders was studied in the point-by-point and swept field modes. In these, the signals of the first, second and third harmonics were measured concurrently. The ac response of as-prepared and patterned samples is qualitatively different in a swept field mode.
II Experimental
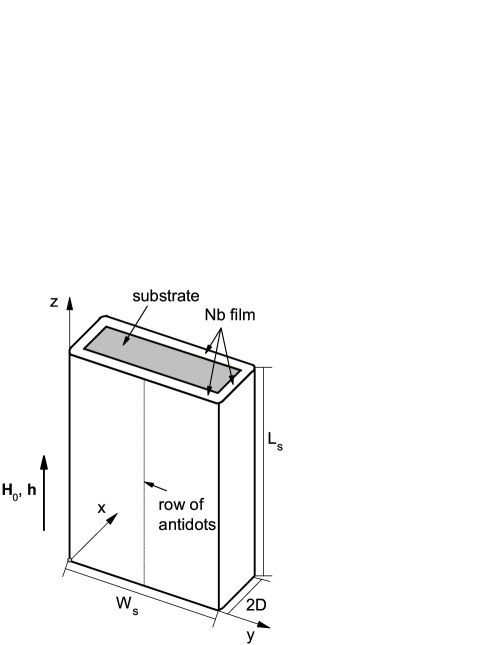
The cylindrical samples were prepared by dc magnetron sputtering at room temperature on a rotated sapphire substrate. The sizes of the substrate with rounded corners (radius 0.2 mm) are mm3. We fabricated, therefore, a thin-walled hollow superconducting cylinder with a rectangular cross section. The nominal film thickness of both samples was nm. A sketch of the sample geometry is presented in Fig. 1.
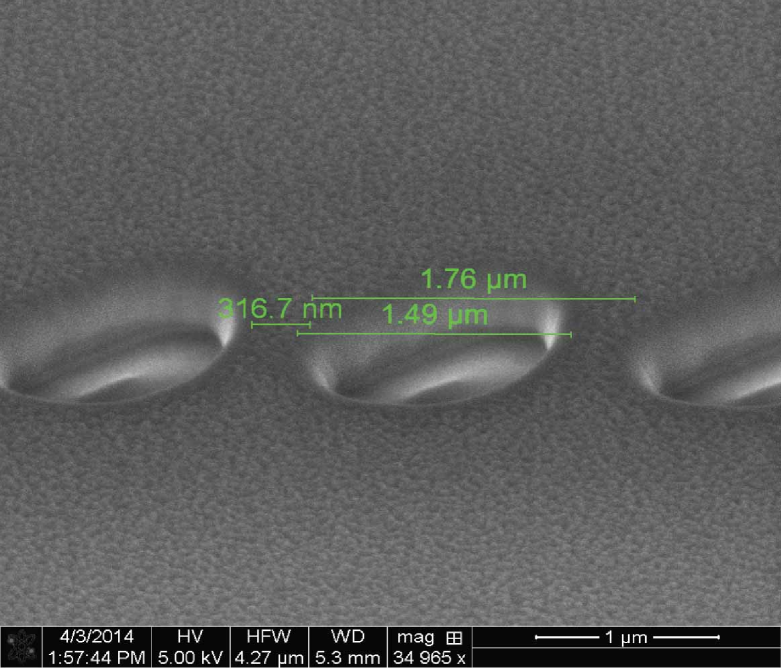
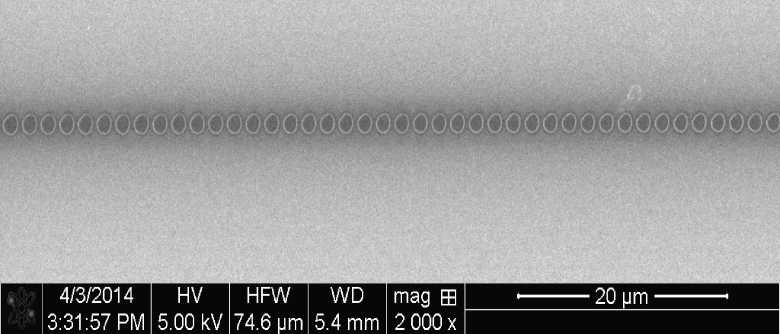
The reference sample was kept as-grown, while the second one, sample , was patterned with a row of antidots at the mid of the larger surface over the entire length of the sample. The row of antidots was milled by focused ion beam (FIB) in a scanning electron microscope (FEI, Nova Nanolab 600). The beam parameters were 30 kV/0.5 nA, while the defocus and blur were 560 m and 3 m, respectively. The pitch was equal to the antidot center-to-center distance of 1.8 m and the number of beam passes needed to mill 150 nm-deep antidots was 2000. The antidots row with a length of mm was milled by iteratively stitching the processing window with a long size of m. SEM images of the patterned surface of sample are shown in Fig. 2. The antidots have an average diameter of 1.5 m and an average edge-to-edge distance of 300 nm.
The dc magnetic properties were measured using a commercial superconducting quantum interference device (SQUID), Quantum Desing MPMS5, magnetometer. The ac response was measured by the pick-up coil method. The sample was inserted into one coil of a balanced pair of coils, and the unbalanced signal was measured by means of lock-in amplifier. The ac magnetic susceptibilities were measured in absolute units, see LEV2 . A “home-made” measurement cell of the experimental setup was adapted to the SQUID magnetometer. A block diagram of the experimental setup can be found elsewhere LEV2 .
The ac response as a function of the dc field were carried out by two methods: (i) - point-by-point (PBP) mode, where the dc field was kept constant during the measurement, and (ii) - swept field (SF) mode, where the dc field was ramped with a rate of 20 Oe/s. Both external ac and dc fields were directed parallel to cylinder axis and hence, to the film surface.
III Results
III.1 dc magnetization
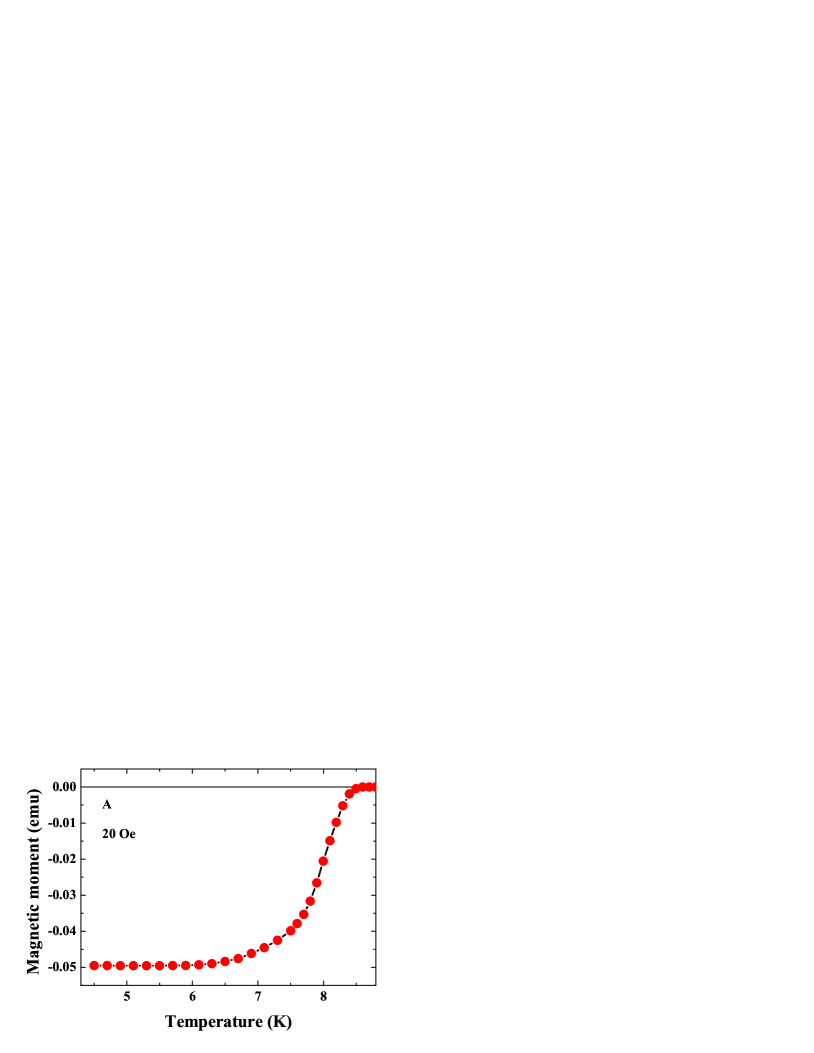
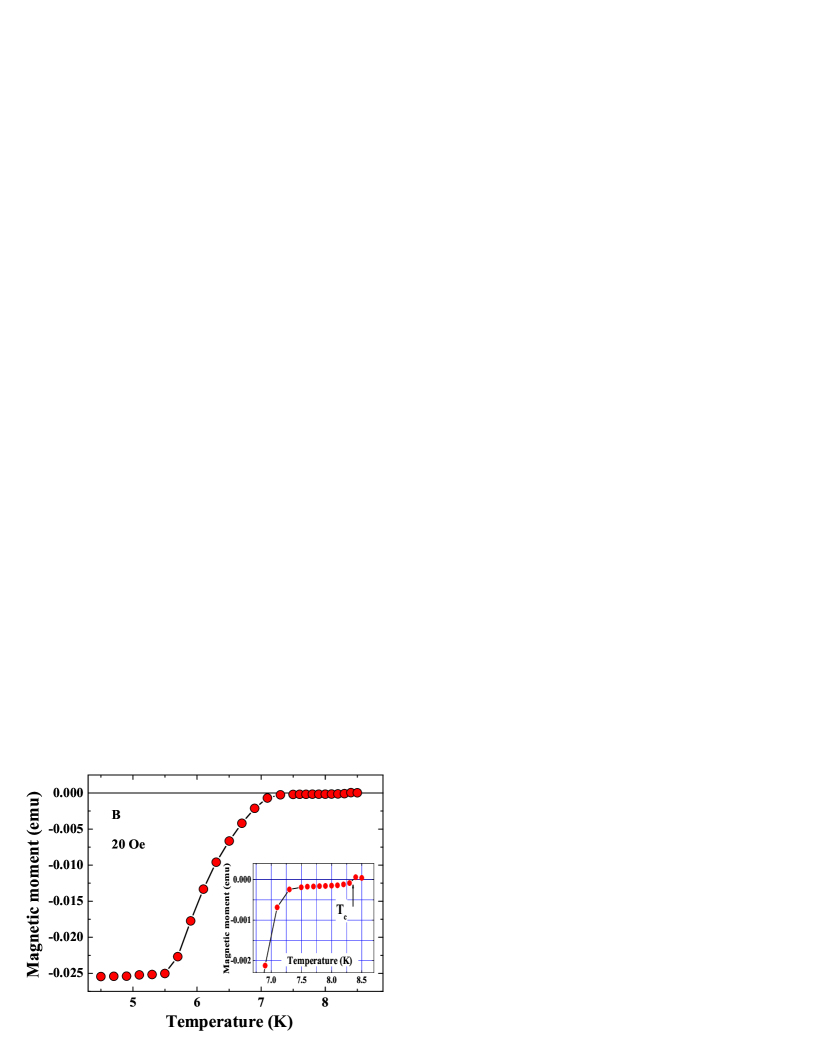
The upper and lower panels of Fig. 3 show the temperature dependences of the magnetic moments, , in magnetic field Oe, of samples and , respectively. The critical temperatures, , of both samples are almost the same, 8.3 K, the transition width for sample is 1.3 K but 2.7 K for sample . Sample demonstrates a two-stage transition, see the inset to the lower panel of Fig. 3. At low temperatures, the magnetic moment of sample is a factor of two larger than that of sample . Temperature and field dependences of the magnetic moment were measured after cooling the sample down to the desired temperatures in zero field (ZFC).
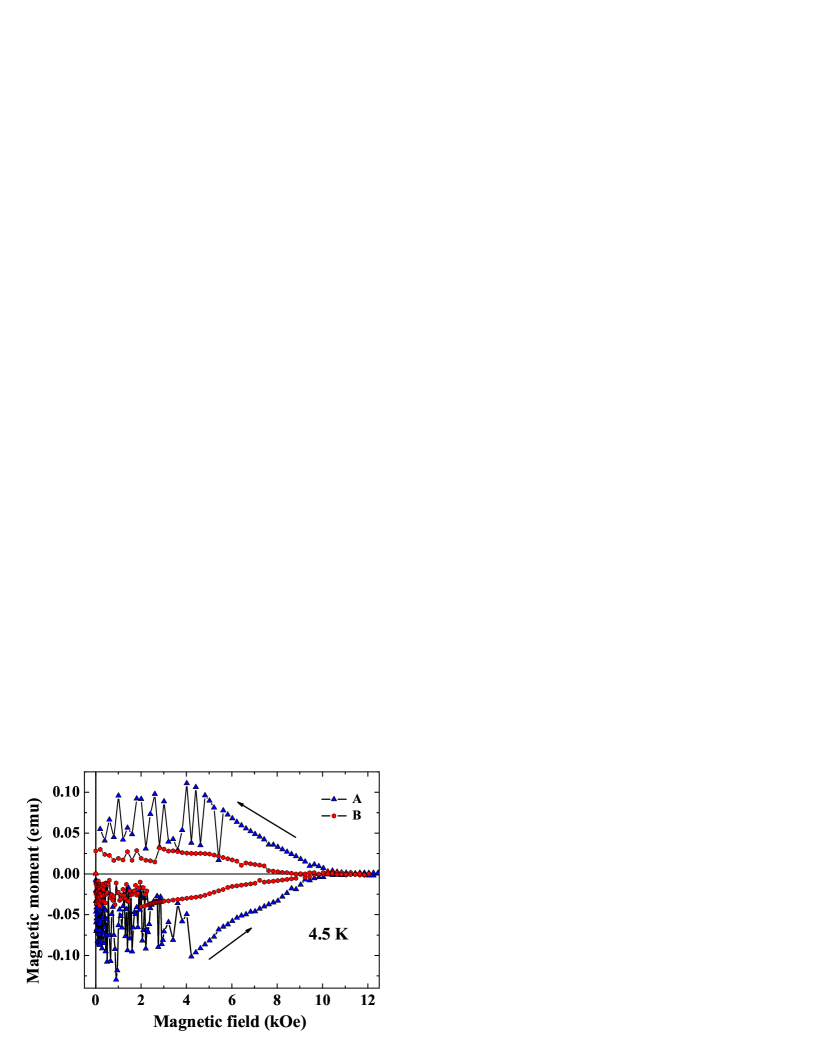
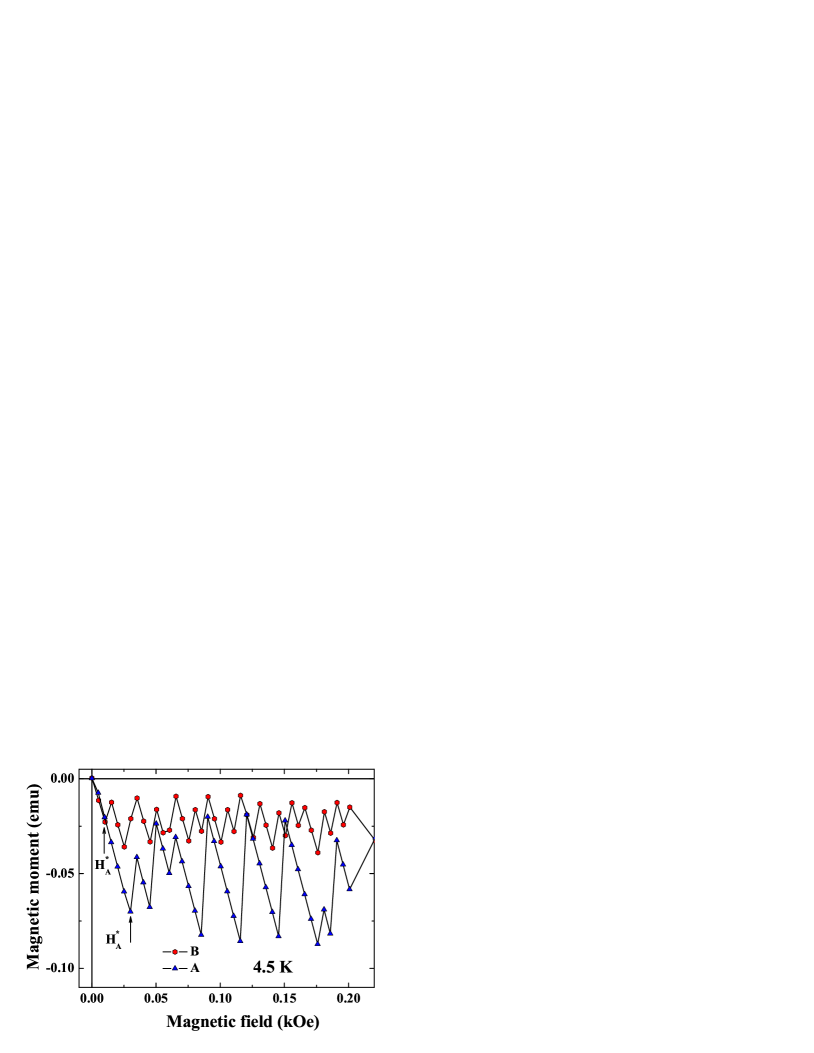
The dependences for samples and at 4.5 K are shown in the upper panel of Fig. 4. The magnetization curves in the ascending branch were measured in the hysteresis mode with 5 Oe step at low fields. Fig. 4 shows that the values are different. Determination of for sample is less accurate than that of sample , due to the magnetic moment relaxation, which at high fields is larger for sample MIT . An expanded view of the magnetization curves at low fields is shown in the lower panel of Fig. 4. The fields of the first jumps, , are around 20 Oe and 10 Oe, while the number of jumps in magnetic fields up to 100 Oe are 5 and 7 for samples and , respectively. Jumps of the magnetic moment were observed in a wide range of magnetic fields, including fields below for both samples. This behavior is reminiscent of magnetic flux jumps in Nb thin films for perpendicular to the film surface NOWAK ; STAM . The jumps observed in these papers were interpreted as a thermomagnetic instability of the Abrikosov vortex lattice NOWAK ; STAM . However, existence of jumps in fields below than and parallel to the surface have been reported in our recent work only Katz1 . is Oe at 4.5 K in our samples. Direct determination of for thin-walled cylindrical samples is impossible due to magnetic moment jumps at low fields. However, the estimation of can be done using magnetization curves of the planar film as it shown in inset to Fig.13.
III.2 ac response
The effective ac magnetic susceptibility of the sample in the external field is given by
| (1) |
and it exhibits the appearance of the ac field penetration into the sample, i.e. , ac losses and harmonics of the fundamental frequency, . Here, is the magnetic moment of the sample and is its volume. In what follows we consider the results of the ac measurements in both PBP and SF modes.
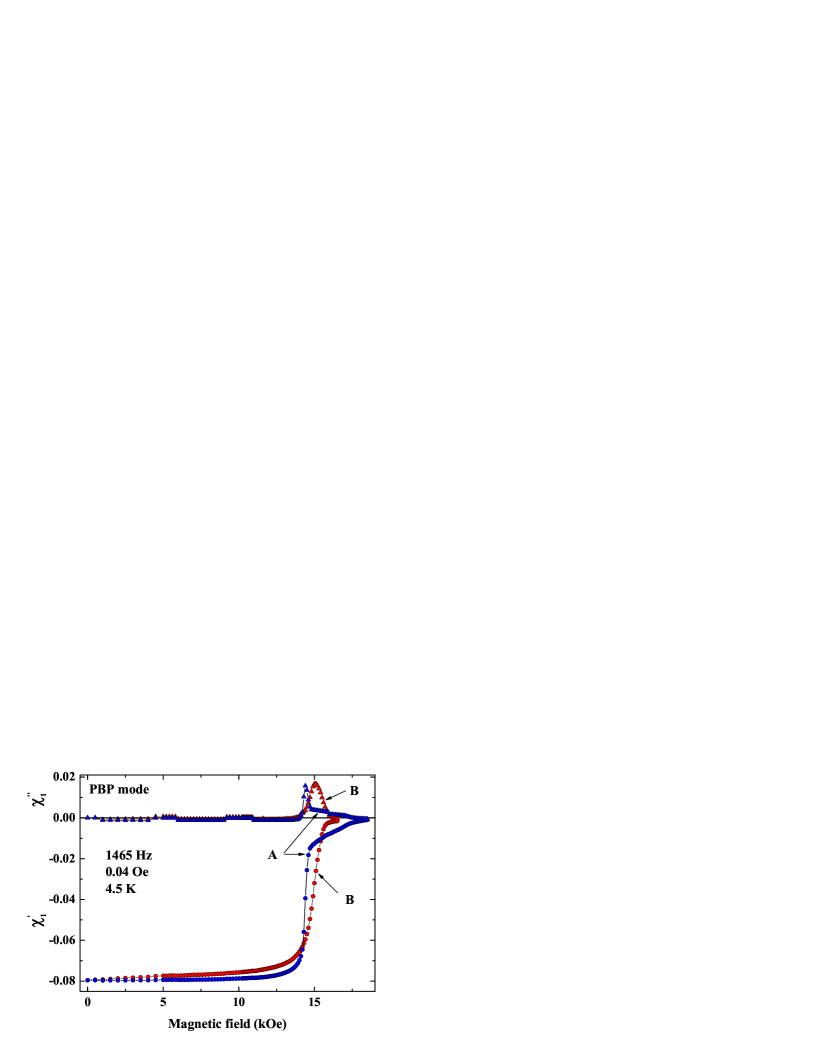
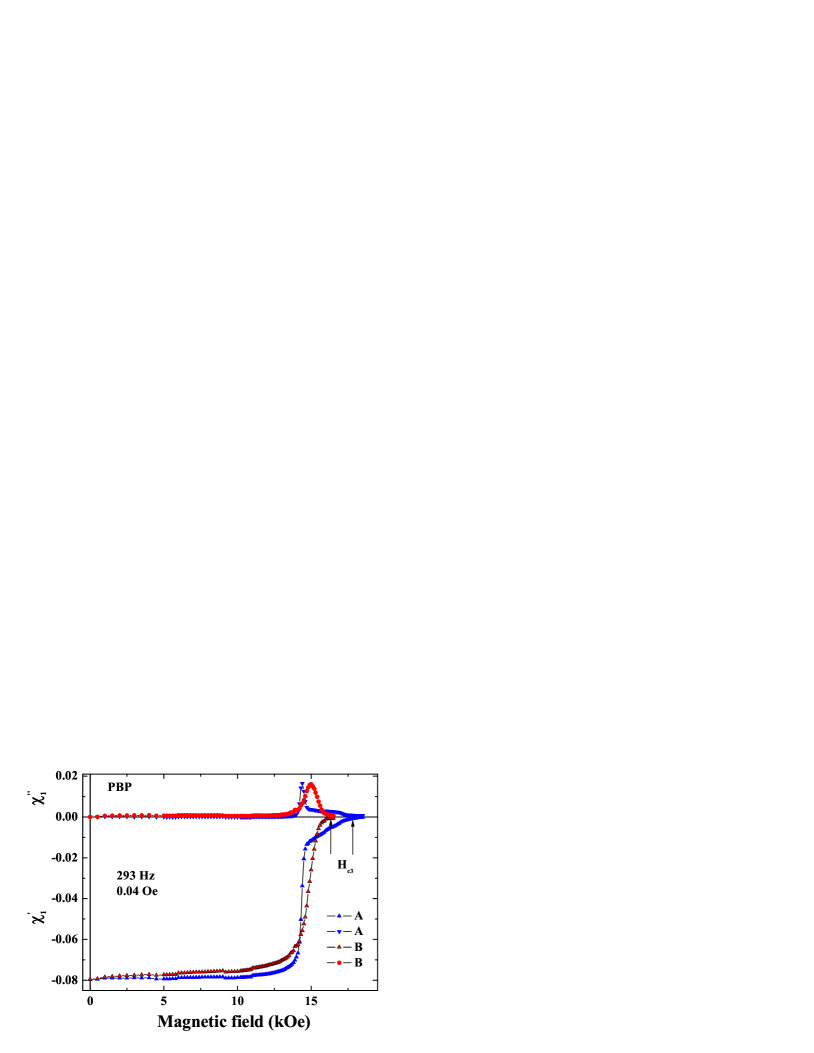
The real and imaginary components of the ac susceptibility at 4.5 K for both samples measured in the PBP mode as a function of at two frequencies are shown in Fig. 5. Almost complete screening up to 12.5 kOe of the ac field by the superconducting walls is observed for both samples. This value is higher than kOe of sample (Fig. 4, upper panel). Complete screening of ac fields by a type II superconductor at low frequencies (, here is a depinning frequency) and amplitudes of excitation (ac current much lower than depinning current) in dc fields lower than was observed years ago STR2 . The frequency dispersion of is weak for both samples. Third critical magnetic field was determined using ac data as follows. At low amplitude of excitation a loss peak located between and . Losses disappear at because in a normal state . Here is a skin depth in a normal state. Such determination of was proposed years ago by Rollins and Silcox ROLL . The lower panel of Fig.5 shows an example of determination of the third critical magnetic field. It was found that and kOe at 4.5 K for and samples, respectively. for sample . An accurate determination of for sample is difficult, due to magnetic relaxation, as discussed above. The absorption line, , near is different for samples and . Thus, this line is nonuniform for sample and it is uniform but broadened for sample . The ac response of superconductors even at very low amplitude of excitation, e.g., less than 1 Oe, is strongly nonlinear in the SSS ROLL ; Genkin1 . The second harmonic signal is absent in the PBP mode in the entire range of magnetic fields. At the same time, the third-harmonic signal exists in the vicinity of only. The absence of the second harmonic in PBP mode is a common feature for the bulk samples as well CAMP . Fig. 6 shows the field dependences of , , in PBP mode for samples and , in the upper and lower panels, respectively. Perturbation theory with respect to the amplitude of excitation is not applicable for interpreting these experimental data. For example, according to perturbation theory, should be proportional and this is not the case in our findings, Fig. 6. It is known that perturbation theory cannot explain experimental data for bulk samples too ROLL ; GENKIN22 . We also note that there is a difference for the third harmonic signal between samples and in the PBP mode.
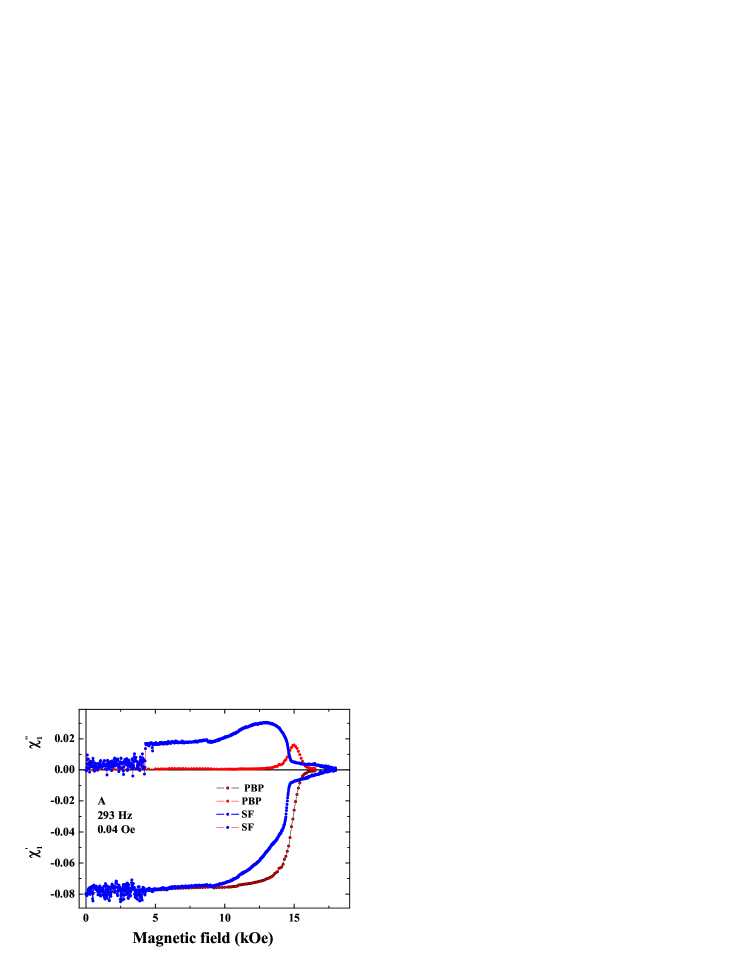
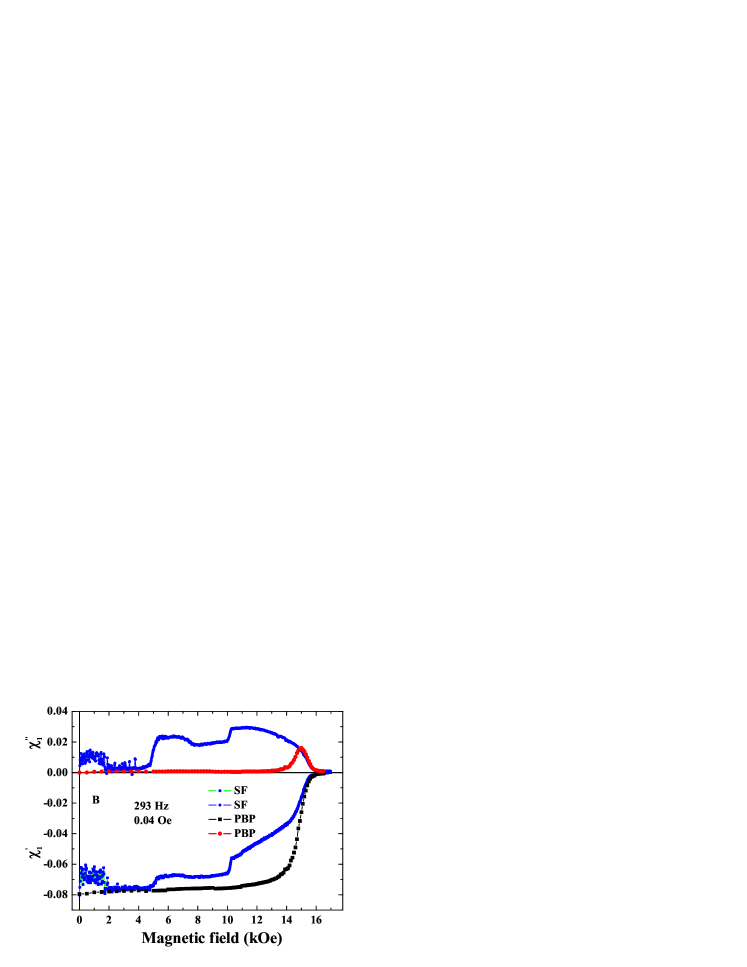
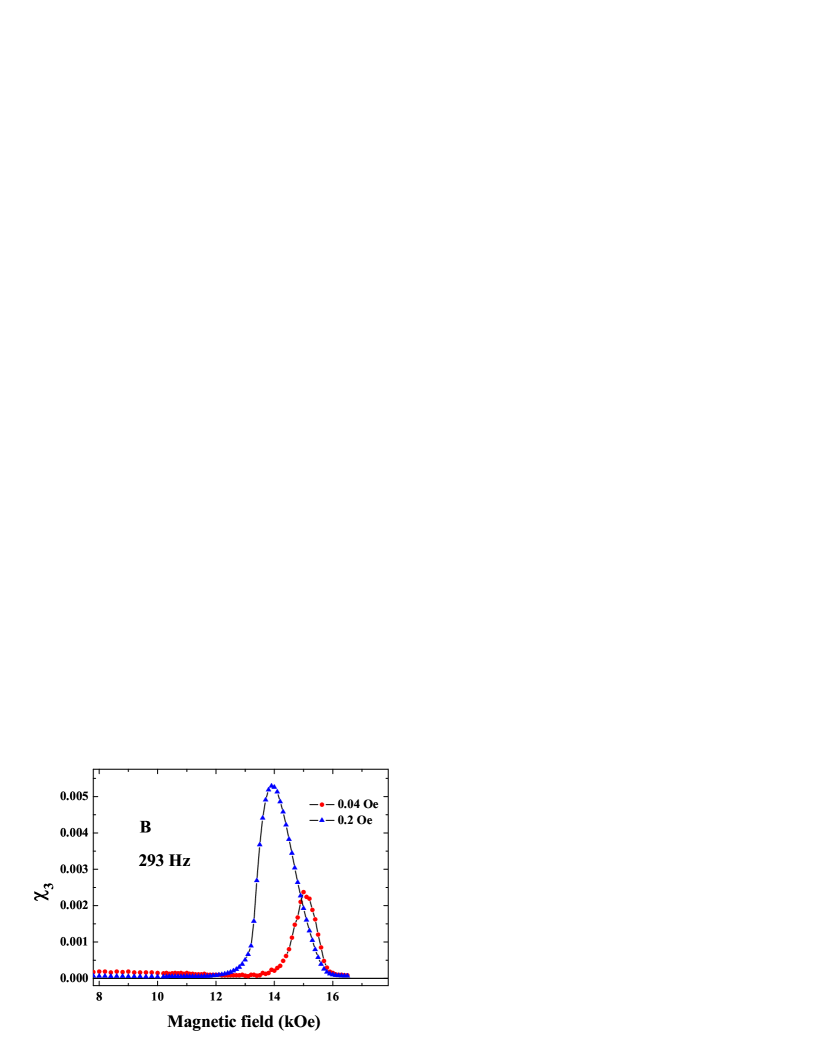
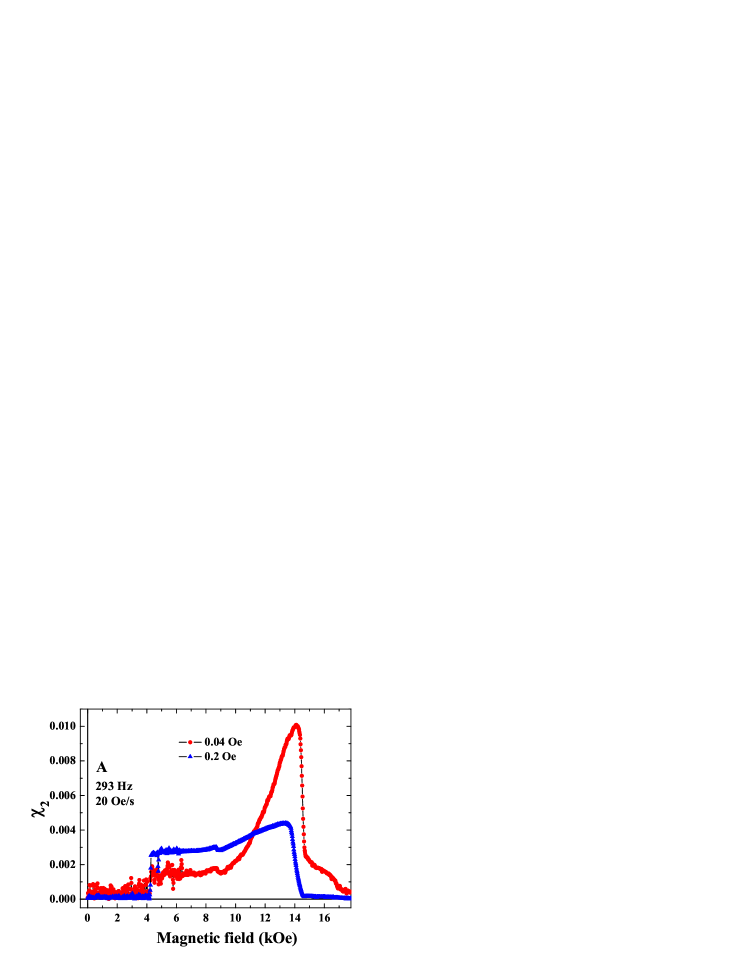
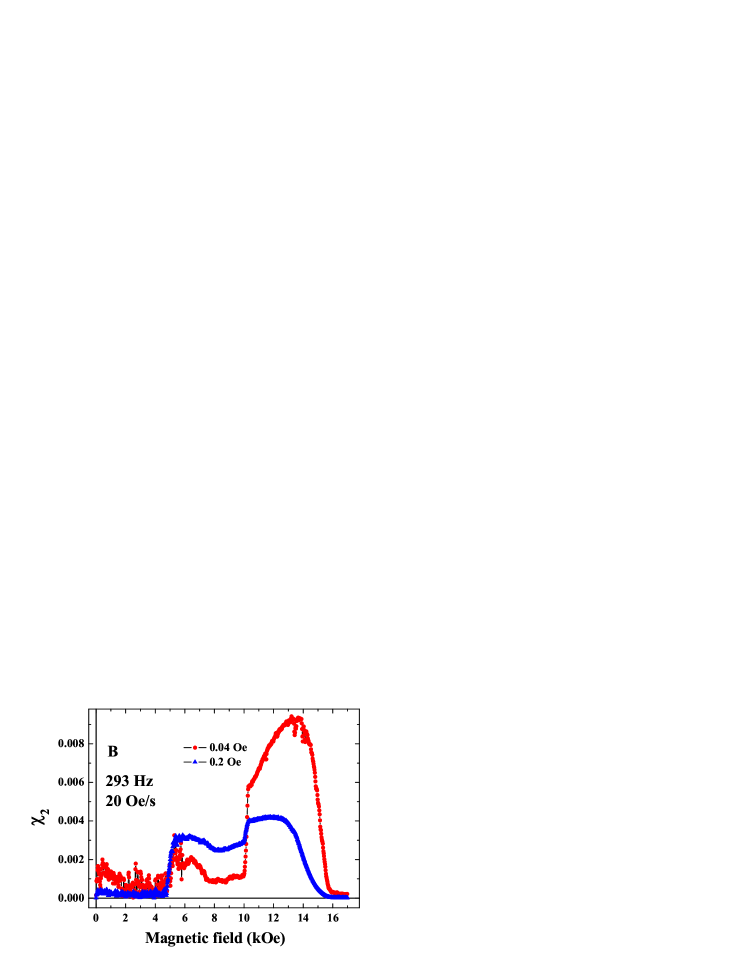
A swept field affects the ac response more strongly at low frequencies or/and low excitation amplitudes for a given sweep rate. This was confirmed in experiments with bulk and thin-walled cylinders samples MAX ; GENKIN22 and Genkin1 ; Katz1 , respectively. Fig. 7 shows the field dependences for both samples and in the PBP and SF modes at 293 Hz and amplitude 0.04 Oe. The difference between the PBP and SF modes can easily be seen for both samples. The ac response at low magnetic fields in the SF mode are fluctuating due to magnetic flux jumps, Fig. 4. Near the curves of coincide well in PBP and SF modes for both samples, Fig. 7. The difference between the two samples in the SF mode is very pronounced in fields above 5 kOe. In particular, is a smooth function of the dc field for sample , but for sample it shows step-like features in fields near 7 and 10 kOe.
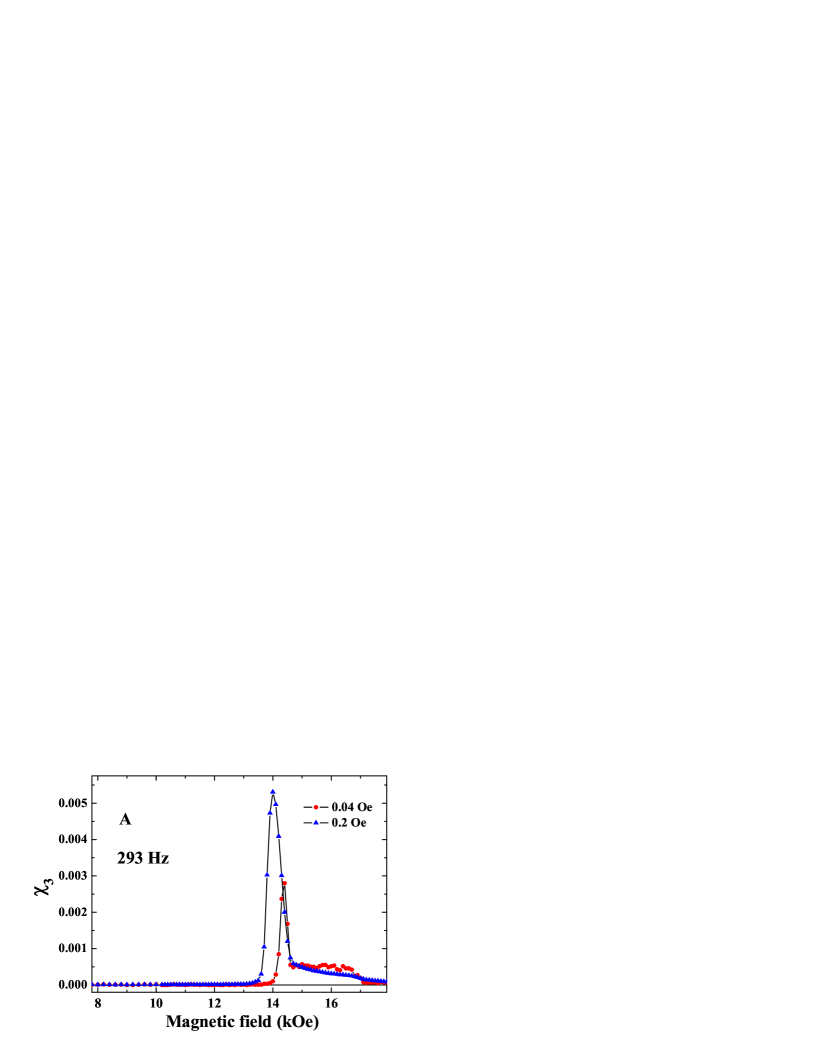
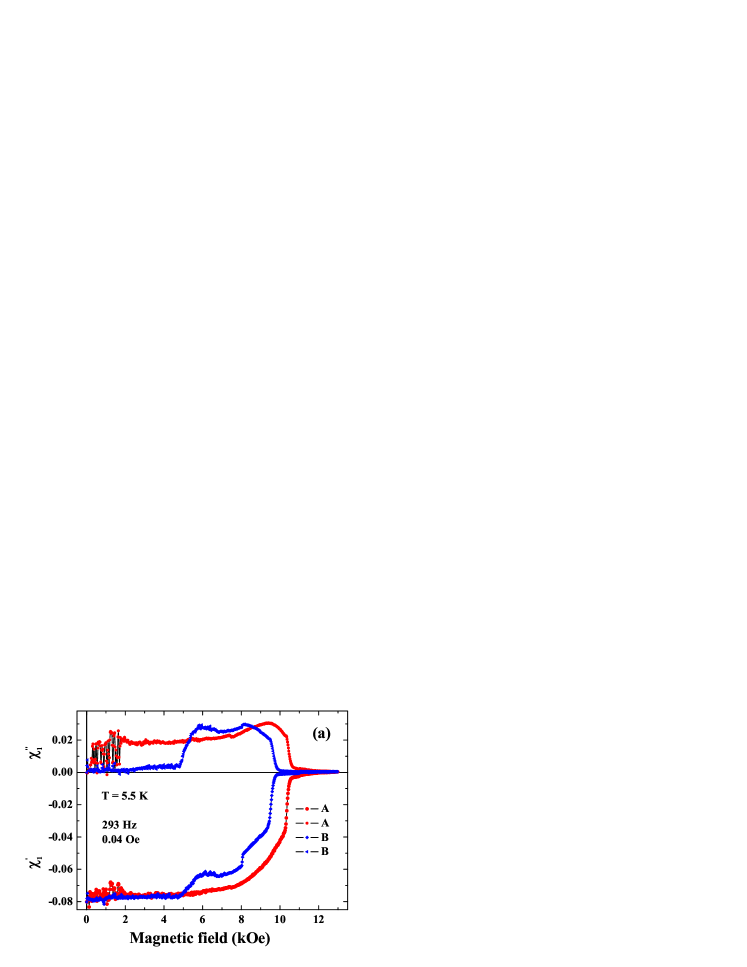
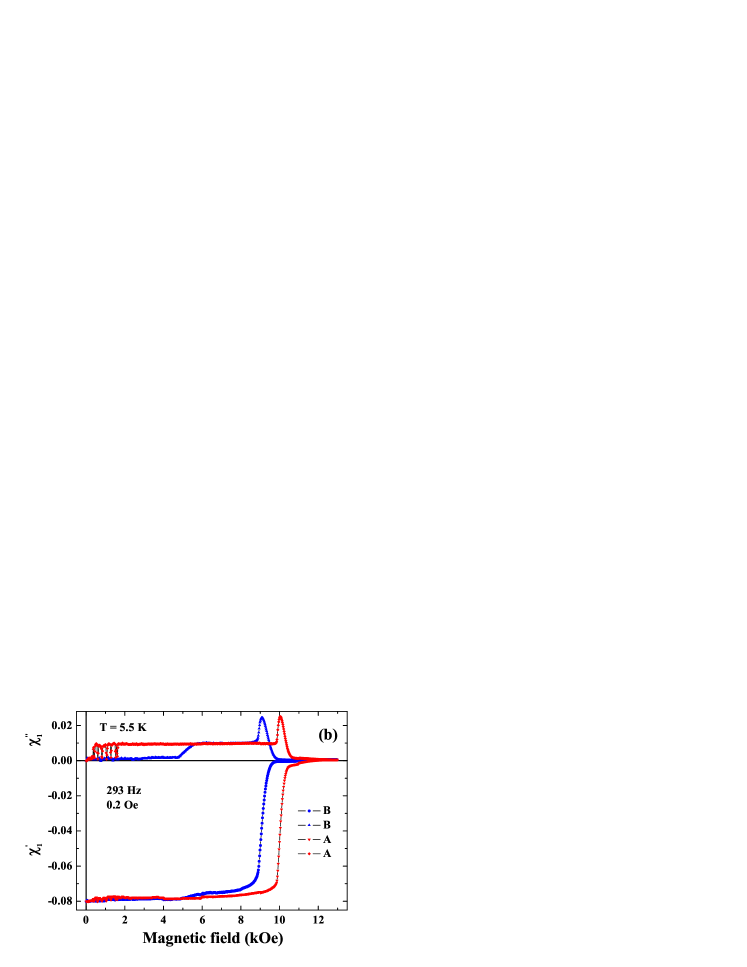
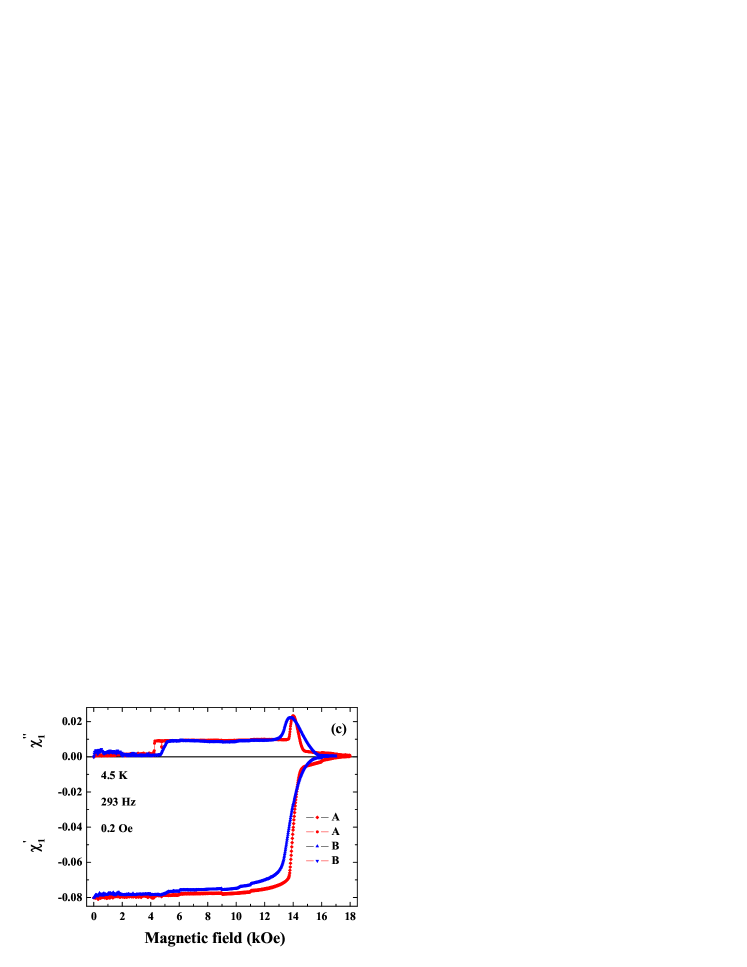
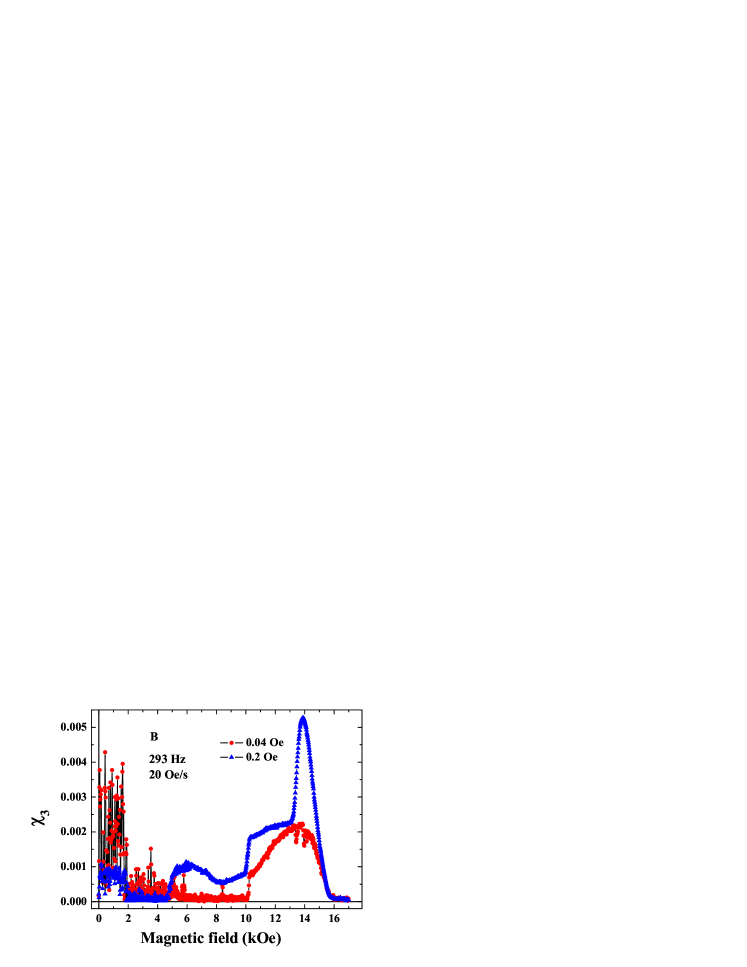
A nonlinearity can clearly be seen not only in the second and third harmonics, but in the first harmonic too. Fig. 8 shows the field dependences of of samples and at and 0.2 Oe and T = 4.5 and 5.5 K in the SF mode. Panels and demonstrate: (i) that at low magnetic fields, losses in sample are significantly larger than losses in sample and: (ii) an increase of the excitation amplitude leads to a decrease of for both samples. At Oe for kOe there is a plateau and for both samples coincides with high precision. The plateau in the SF mode at high excitation amplitudes was observed at T = 4.5 K, Fig. 8 and also at 5.5 K for, Fig. 8. It appears that in this range of magnetic fields and at high enough amplitude, the first harmonic signal of the two samples is almost identical. However, a qualitative difference remains for the signals of the second and third harmonics, see Figs. 9 and 10.
As for the second harmonic signal it is absent for both samples in the whole range of magnetic fields in the PBP mode, but becomes visible in the SF mode. Fig. 10 shows the field dependences of in the SF mode. Perturbation theory cannot explain the data for in the SF mode and in both modes. In accordance to this theory one could expect that and . However, this is not the case in our experiment at any magnetic field. In our experiment, an increase of the excitation amplitude leads to a suppression of . In the SF mode is larger than under the conditions of the experiment, see Figs. 9 and 10. We note that the data for , and fluctuate strongly at fields lower than 4 kOe at 4.5 K for sample due to magnetic flux jumps.
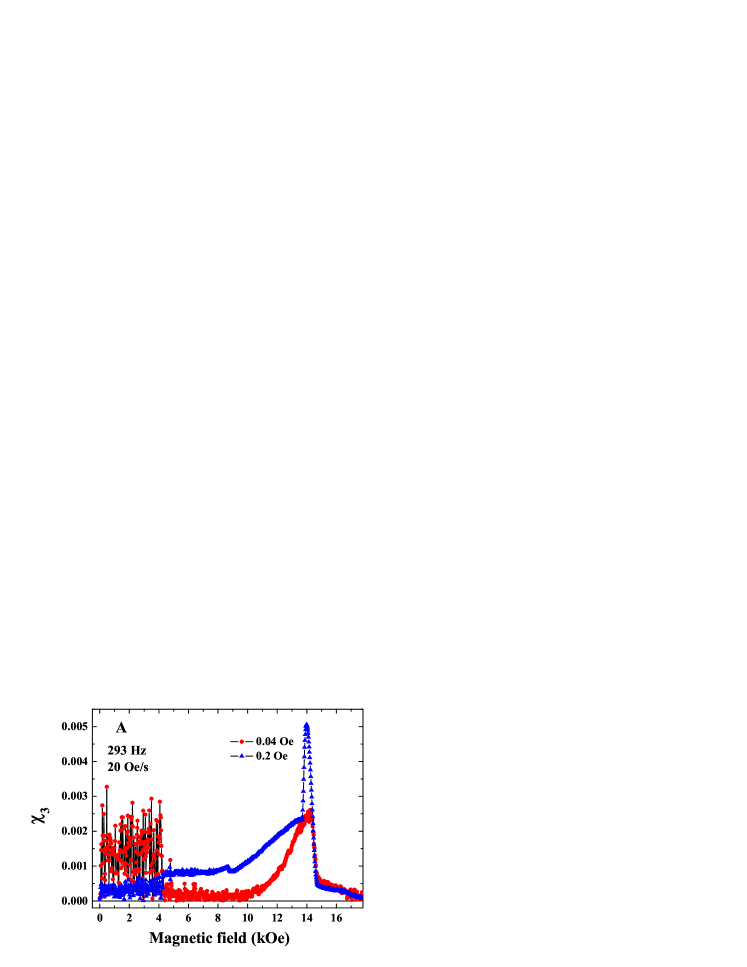
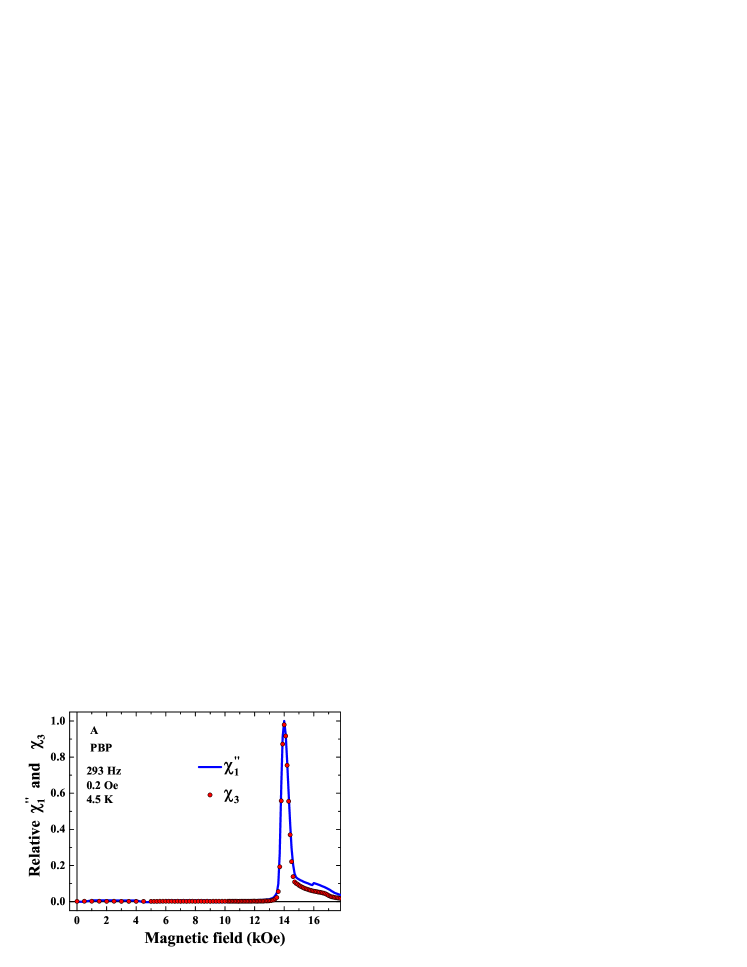
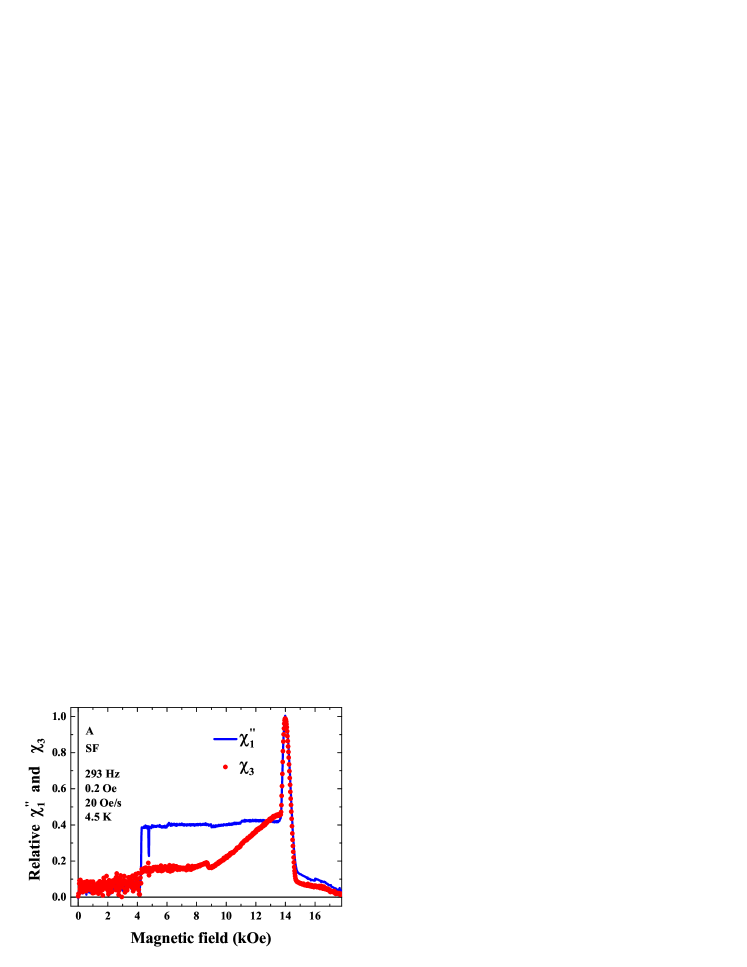
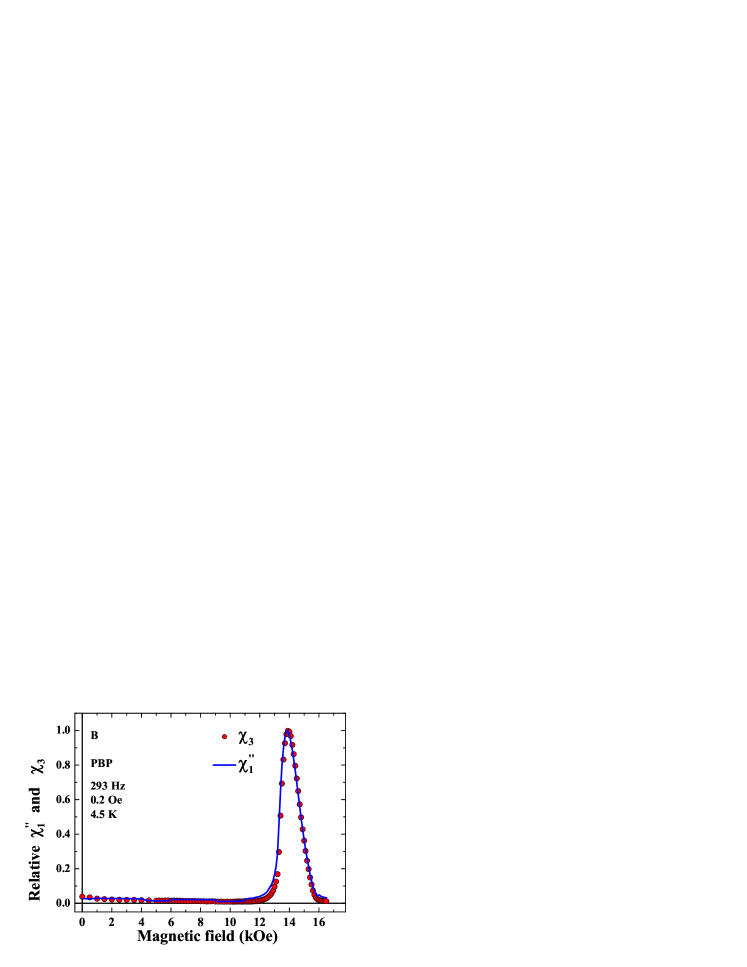
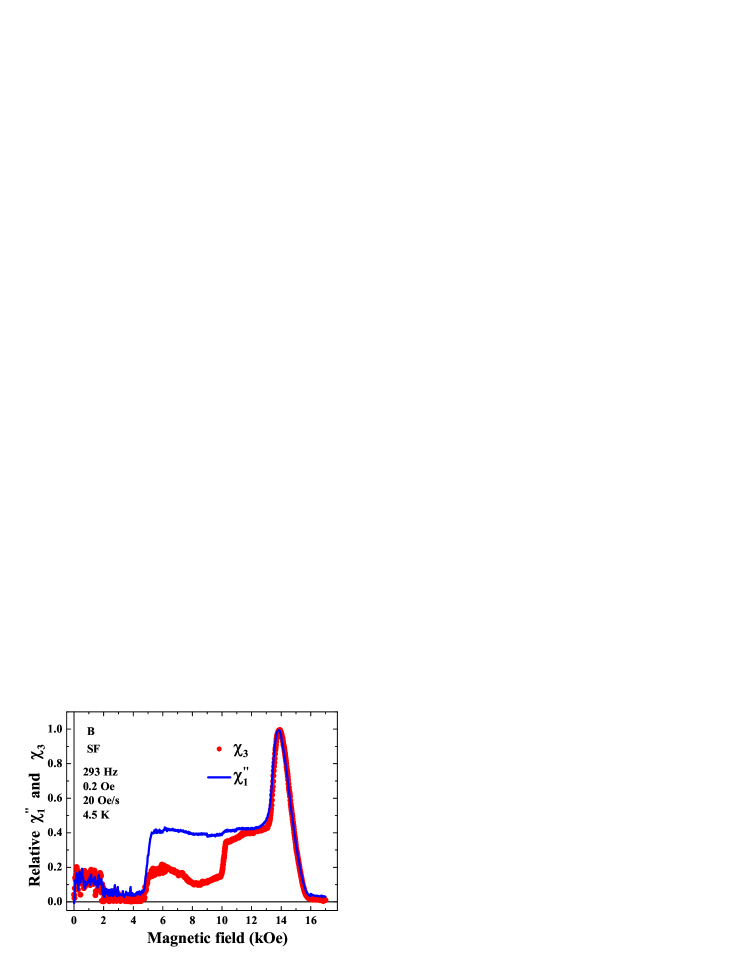
It is interesting to note the following concerning the relation between field dependences of and . Figs. 11 and 12 show field dependences of normalized and for samples and . Upper panels in both figures correspond to the PBP mode and lower panels to SF mode. At low magnetic fields and are very small in the PBP mode for both samples. Both signals become measurable near and the shape of these signals is identical with high precision. In the SF mode the shapes of and are again the same in the vicinity of . However, at low magnetic fields this similarity vanishes in the SF mode. Such similarity in the PBP mode can be proved in the frame of perturbation theory PAV , but it has not yet proven in the general case which we face in our experiment.
IV Discussion
IV.1 dc magnetization curves
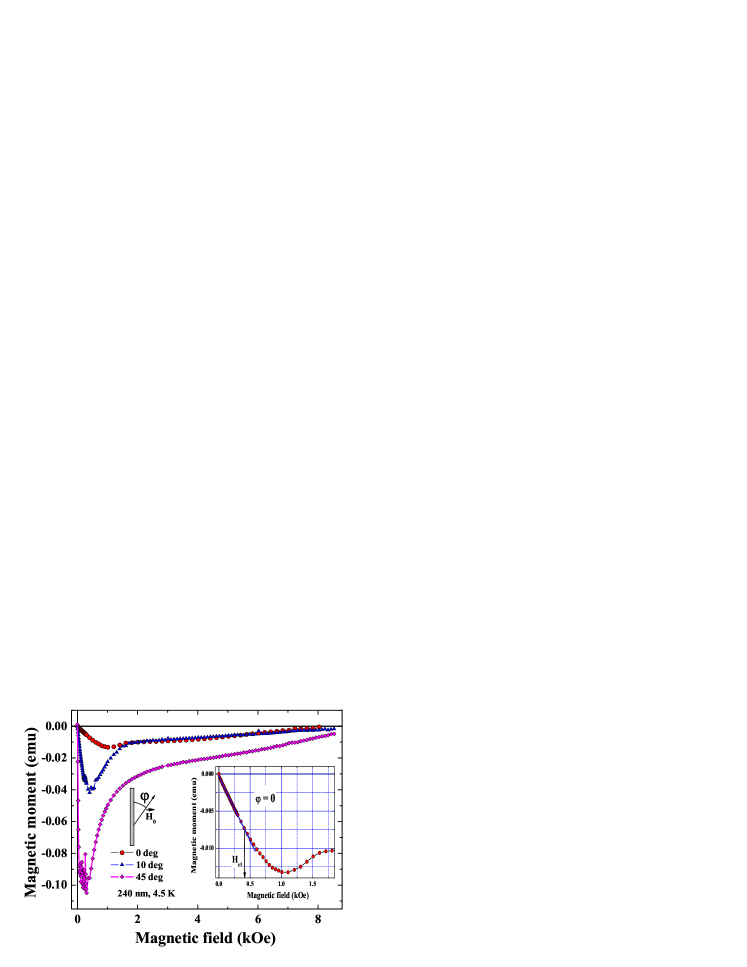
The physical reasons for the observed flux jumps at small magnetic fields are not clear. One can suggest that the alignment of the magnetic field with respect to the sample surface is not perfect. Indeed, the latter cannot be ruled out completely, and a small field component perpendicular to the surface, , should create vortices which might be responsible for the flux jumps at small magnetic fields. Hence, one may expect that flux jumps could be present at small magnetic fields in a reference planar film as well. This assumption has been examined in an additional control experiment with a reference planar film. Figure 13 displays ascending branches of the magnetization curves of the planar Nb film of 240 nm thickness sputtered onto a silicon substrate, for the magnetic field inclination angles , , and . For and the component and , respectively. Vortices created by this field component exist at small magnetic fields. This experiment demonstrates that in small fields the magnetic moment is a linear function of the magnetic field value and vortices created by do not induce any flux jumps at small fields. The magnetic moment at small fields remains a linear function of the magnetic field for planar films of different thicknesses. Magnetic moment jumps first appear in the magnetization curve at inclination angles larger than . Such a field inclination angle is at least a factor of 3 larger than the orientational misalignment of the sample orientation with respect to the field direction in our experiment. Therefore, the results obtained for planar films suggest that the vortices created by the small field component perpendicular to the surface are not the cause for magnetic moment jumps at small magnetic fields in the cylindrical samples.
The experimental data demonstrate the existence of magnetic instabilities in fields lower than . At 4.5 K, the flux starts to penetrate into the cylinders and at and 10 Oe, respectively, Fig. 4 (lower panel). The field of the first jump, , is defined by the some critical current (not to be confused with a depairing current). If we assume that the critical current density in the isthmus between two antidots is the same as in the film, then the ratio should be . However, the experiment shows that this ratio is about 0.5, see Fig. 4. This means that the critical current density in the isthmuses is higher than in the as-prepared film. We note that the ratio of the magnetic moments in ZFC in field 20 Oe for samples and is 0.5, see Fig. 3. In accordance to the thermodynamic criterion Katz1 . Comparison for sample and samples from Katz1 shows that the thermodynamics cannot describe these magnetization jumps in samples without antidots.
It was demonstrated that at low temperature and at magnetic fields higher than some critical value, , the magnetization curve becomes smooth and is sufficiently larger in the sample with an array of antidots Motta1 . The latter experiments were carried out with the field perpendicular to the film surface. In our case we deal with the row of antidots and the magnetic field parallel to the surface. We believe that this is the main reason why is lower for the sample with antidots, see upper panel of Fig. 4. We have to mention that the difference between perpendicular and parallel geometries is crucial. For example vortex velocity in the perpendicular geometry is a few orders magnitude larger than for the parallel one, see Ref. Genkin1 .
IV.2 ac response
The field dependences of in the PBP mode are different for and samples, Fig. 5. Losses appear and screening decreases in magnetic fields above . Near there is a loss peak and the shape of this peak is different for samples and . The shape of the loss peak for sample is nonuniform and for sample it is broadened. The third critical field of sample is larger than for sample , Fig. 5 lower panel. However, the determination of for sample is questionable.
The difference in the ac response of samples and becomes qualitative in the SF mode, Figs. 7, 9 and 10. Whereas the field dependences of , and are smooth for sample , they have peculiarities in 7 and 10 kOe for sample . As we have mentioned above, the data for , and are noisy and fluctuating at fields lower than 4 kOe at 4.5 K and 2 kOe at 5.5 K due to magnetic flux jumps. The behavior of the ac response in the SF mode has some similar features for both samples. Thus, an increase of the excitation amplitude and frequency leads to a decrease of in fields down to and in the whole field range. The reason for this behavior is the following. The main physical parameter defining the difference between the PBP and SF modes is MAX ; FINK2 . The PBP mode corresponds to . Parameter decreases with the excitation amplitude and/or frequency tending to zero. This is why and decrease with and and in consequence of this in the SF mode perturbation theory is not applicable. In the limiting case of high frequencies, for example, in the GHz range, a swept field with sweep rate of few tens or hundred oersted per second does not affect the ac response VAT .
The ac response of sample in the SF mode is similar to that reported in our previous papers Genkin1 ; Katz1 . In this sample we observe a smooth field dependence of , and . The models proposed in Genkin1 ; Katz1 can explain the experimental data for sample in magnetic fields lower and higher than . The case with the sample is more complicated. It turned out that at magnetic fields of 4 kOe () is lower for sample than for sample , see Fig. 8. The following may be the reason for this. Vortex pinning and the current induced by ac and swept fields play an important role in ac response in a swept magnetic field Genkin1 . The area under the row of antidots is much smaller than the total film area. This is why vortex pinning by this row antidots cannot explain loss reduction. At the same time the total induced current is lower in sample than in sample , Fig. 3. This reduces the forces dragging vortices into the substrate and leads to loss reduction Genkin1 . The jump at kOe takes place only for sample , see Figs. 9 and 10. At fields higher than the jump field the losses for both samples at Oe are equal, panels and of Fig. 8. The weakening of pinning in high magnetic fields could be a cause for such behavior.
The nature of the jump of in magnetic fields of 10 kOe (see panels b of Figs.9 and 10) for sample in SF mode is not clear. ac amplitude is not smeared this jump completely in contrast with , see panels a and c of Fig.8. This jump takes place in magnetic fields near of sample . Decreasing of ac losses and harmonics jump near in a swept field was observed in single crystal Nb GENKIN22 ; MT . However, single crystal Nb has a well defined vortex structure and but it is not the case with our sample.
V conclusion
We have studied the dc and ac magnetic properties of thin-walled cylinders of superconducting Nb with and without a row of antidots. Experiment showed that the critical current density is higher in the isthmus between antidots than in the film itself. The dc magnetization curves demonstrate an ”avalanche”-like penetration of the magnetic flux into the cylinder for both samples. The effect was observed at a temperature of 4.5 K and completely disappeared at 7 and 5.5 K for samples and , respectively. Such a behavior resembles a thermomagnetic instability of vortices but it was observed in fields below of the films, i.e. in a vortex-free state. The effect of end faces, consisting in that the magnetic force lines is bending near the sample ends, could be another reason for flux jumps. The influence of the sample end faces on the flux jumps in such samples has to be studied using a local probe technique.
The ac response of thin-walled cylinders with and without antidots is strongly nonlinear and perturbation theory cannot explain the experimental data. The ac response of and samples is similar in the point-by-point mode. However, in the swept field mode there is a qualitative difference between losses for samples and . Thus, at low magnetic fields, losses in sample are lower than in sample . There are jumps in , and in high magnetic fields for sample , but these quantities are smooth functions of the magnetic field in sample .
We demonstrate that field dependences of and have the same shapes in the point-by-point mode with high accuracy. In the swept field mode the shapes of and are the same in the vicinity of . This similarity has yet not been proved in the case of strong nonlinear response that we encounter in our experiment.
The models developed in Genkin1 ; Katz1 could describe the ac response of the as-prepared sample. However, these models are not applicable to the sample with a row of antidots. New models for samples with antidots have to be elaborated. As well as further experimental studies of samples with different lengths, wall thicknesses, sizes and geometry of antidots row or array have to be carried out.
VI acknowledgments
We thank J. Kolacek, P. Lipavsky and V.A. Tulin for fruitful discussions. This work was done within the framework of the NanoSC-COST Action MP1201. Financial support of the grant agency VEGA in projects nos. 2/0173/13 and 2/0120/14 are kindly appreciated.
References
- (1) Little W A and Parks R D 1962 Phys. Rev. Lett. 9 9
- (2) Douglass D H, Jr.1963 Phys. Rev. 132, 513
- (3) Aoyama K, Beaird R, Sheehy D E and Vekhter I 2013 Phys. Rev. Lett. 110, 177004
- (4) Motta M, Colauto F, Otiz W A, Fritzsche J, Cuppens J, Gillijns J, Moshchalkov V V, Johansen T H, Sanchez A and Silhanek A V 2013 Appl. Phys. Lett., 102, 212601
- (5) Tsindlekht M I, Genkin V M, Felner I, Zeides F, Katz N, Gazi S and Chromik S 2014 Phys. Rev. B 90 014514
- (6) de Gennes P G 1966 Superconductivity of metals and alloys (W A Benjamin: INC New York) p 197
- (7) Kittel C, Fahy S, and Louie S G 1988 Phys. Rev. B 37 642
- (8) Nowak E R, Taylor O W, Liu Li, Jager H M, and Selinder T I 1997 Phys. Rev. B 55 11702
- (9) Esquinazi P, Setzer A, Fuchs D, Kopelevich Y, Zeldov E and Assmann C 1999 Phys. Rev. B 60 12454; Stamopoulos D, Speliotis A and Niarchos D 2004 Supercond. Sci. Technol., 17, 1261
- (10) Motta M, Colauto F, Zadorosny R, Johansen T H, Dinner R B, Blamire M G, Ataklti G W, Moshchalkov V V, Silhanek A V and Ortiz W A Phys. Rev. B 2011 84 214529
- (11) Saint-James D and Gennes P G 1963 Phys. Lett. 7 306
- (12) Rollins R W and Silcox J 1967 Phys. Rev. 155 404
- (13) Burger P, Deutscher G, Gueon E and Martinet A 1965 Phys. Rev., 137A 853
- (14) Strongin M, Schweitzer D G, Paskin A, and Craig P P 1964 Phys. Rev. 136 A926
- (15) Maxwell E, Robbins W P 1966 Phys. Lett. 19 629
- (16) Tsindlekht M I, Genkin V M, Leviev G I, Schlussel Y, Tulin V A, Berezin V A 2012 Physica C 473 6
- (17) Tsindlekht M I, Genkin V M, Gazi S and Chromik S 2013 J. Phys.: Condens. Matter 25 085701
- (18) Leviev G I, Genkin V M, Tsindlekht M I, Felner I, Paderno Yu B, Filippov V B 2005 Phys. Rev. B 71 064506
- (19) Yeshurun Y, Malozemoff A P, Shaulov A 1966 Rev. Mod. Phys. 68 911
- (20) Campbell S A, Ketterson J B, Crabtree G W 1983 Rev. Sci. Instrum. 54 1191
- (21) Fink H 1967 Phys. Rev. 161 417
- (22) Lipavsky P 2014 private communication
- (23) Tulin V A 2015 private communication
- (24) Tsindlekht M I, et al. 2016 unpublished