Proximity effect on hydrodynamic interaction between a sphere and a plane measured by Force Feedback Microscopy at different frequencies.
Abstract
In this article, we measure the viscous damping G”, and the associated stiffness G’, of a liquid flow in sphere-plane geometry in a large frequency range. In this regime, the lubrication approximation is expected to dominate. We first measure the static force applied to the tip. This is made possible thanks to a force feedback method. Adding a sub-nanometer oscillation of the tip, we obtain the dynamic part of the interaction with solely the knowledge of the lever properties in the experimental context using a linear transformation of the amplitude and phase change. Using a Force Feedback Microscope (FFM)we are then able to measure simultaneously the static force, the stiffness and the dissipative part of the interaction in a broad frequency range using a single AFM probe. Similar measurements have been performed by the Surface Force Apparatuswith a probe radius hundred times bigger. In this context the FFM can be called nano-SFA.
In this paper, we aim to measure the hydrodynamic interaction in water between a microsphere and a hard and plane surface at different distances and at different frequencies using a single probe. In this regime, the viscous behavior is expected to be dominating. Previous experiments have been run in air with conservative forcescarpentier2014variable . Using an electrical coupling between an AFM tip and a metallic surface as test interaction in air, we probed the static and dynamic part of the interaction where in this case the stiffness is expected to match the minus of the derivative of the static force and the damping to be null. In liquid, from the dynamic transition from a viscous-dominated behavior at large distance to an elastic-dominated behavior at short distance, we aim to extract mechanical properties of soft thin films as SFA doesleroy2011hydrodynamic . The hydrodynamic pressure will gently deform the soft sample without touching it and propose an alternative to the classical hard mechanical contact. The increase in the frequency range of this mechanical testing and the decrease of the tip radius, compare to the SFAIsraelachvili1992 , allows us to probe the viscoelastic properties of soft thin films and the possibility of the frequency dependence and compare it to bulk values. Properties can dramatically change with respect to the frequency as we have demonstrated in the case of capillary bridgecarpentier2015out. Here in this test experiment, we use non-deformable surface and spherical probe, and we explore the dissipation due to the flowing liquid. Other experiments with an AFM setup have been performedbenmouna2002hydrodynamic ; maali2005hydrodynamics in order to measure the hydrodymanic behavior either with respect to the sphere-plane separation or for different frequencies using one lever. The dissipation is expected to follow the lubrication approximation and to be frequency dependent, f=ω/2π, if reported in N/m. The lubrication approximation holds for low Reynolds number, thus R>>z, and the dissipation followleroy2011hydrodynamic :
R is the tip radius, the dynamic viscous coefficient of the water,
equal to 1 mPA.s at 20°C, from IAPWS standards, and z is
the tip sample distance. The linear frequency dependency and the z-1
behavior of the dissipation is thus a perfect test interaction in
liquid as the theory and the experiment are directly compared without
adjustable parameters.
The Force Feedback Microscoperodrigues2012atomic , based on standard AFM setup using optical fiber interferometric detectionrugar1989improved , is based on one key point: a piezoelectric element is placed on the chip and a feedback loop keep the DC position of the tip constant during all the measurement by canceling the static force acting on the tip. The static feedback force is then the displacement of the piezoelement times the lever stiffness k. The total force acting on the tip is then equal to zero during all the measurement. This leads to the suppression of mechanical instabilities, such as when in air a capillary bridge nucleates, and allows us to apply subnanometers oscillations and lets the system in the linear response regime. Thus through linear transformation of the amplitude and phase change using the following equations we can recover the dynamic part of the interaction (see more details in Ref.2):
n is the normalized amplitude of oscillation, it is equal to 1 far from the sample and Φ is the phase. Parameters Fr and Φ are obtained using the lever properties in the environmental experiment and the following equations (see more details in Ref.rodrigues2014system ):
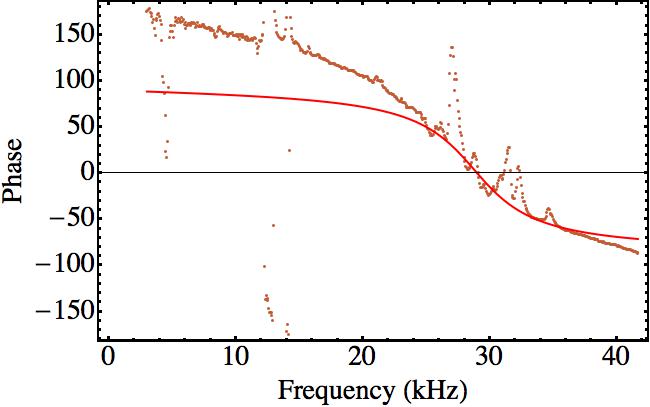
Using the phase response of the system in liquid far from the sample, see Fig.1, we extract the resonance frequency f0 and the quality factor Q, by fitting the measured phase response by the theoretical phase of a harmonic oscillator. The mass of the system m is deduced from the knowledge of the resonance frequency and the stiffness k. The knowledge of these three quantities, k, f0 and Q, is the only need for the calibration of the linear transformation.
As the tip radius is an important parameter, we glued a polystyrene sphere of 20μm of radius, coated with 40nm of gold, to the lever. Glue gets the lever stiffer than a brand new lever. It has stiffness of 10 N/m, as measured by Brownian motion, its first eigenmode in salt-water is 29 kHz and its quality factor is 4. The low quality factor gives here a large bandwidth to the system. This gives a good signal to noise ratio even far from the eigenmode, it is especially important for frequency above the first eigenmode. It is important to highlight that cantilever is the same lever for all presented experiments. If one wants to perform this experiment with conventional dynamic AFM, one should use different cantilevers. In order to avoid elastic-dominated behavior the sample is chosen to be silicon with a Young modulusboyd2012measurement of 170GPa. We performed Z-spectroscopy in presence of silicon in salt-water solution and recorded the amplitude n(z) and phase Φ(z) for arbitrary excitation frequency from 1kHz up to 40kHz. Fig.2 presents the amplitude and phase change with respect to the tip-sample distance. The zero is defined as the mechanical contact between the tip and the sample. In this regime the mechanical zero is expected to match the hydrodynamic zero. One observation is that all signals are different even if they are due to the same interaction. As it is shown in Fig.2 the noise in this curve is essentially due to the Brownian motion at room temperature and to the moving liquid. It is important to notice that the signal to noise ratio is the same whatever the excitation frequency which is essentially due to the low quality factor.
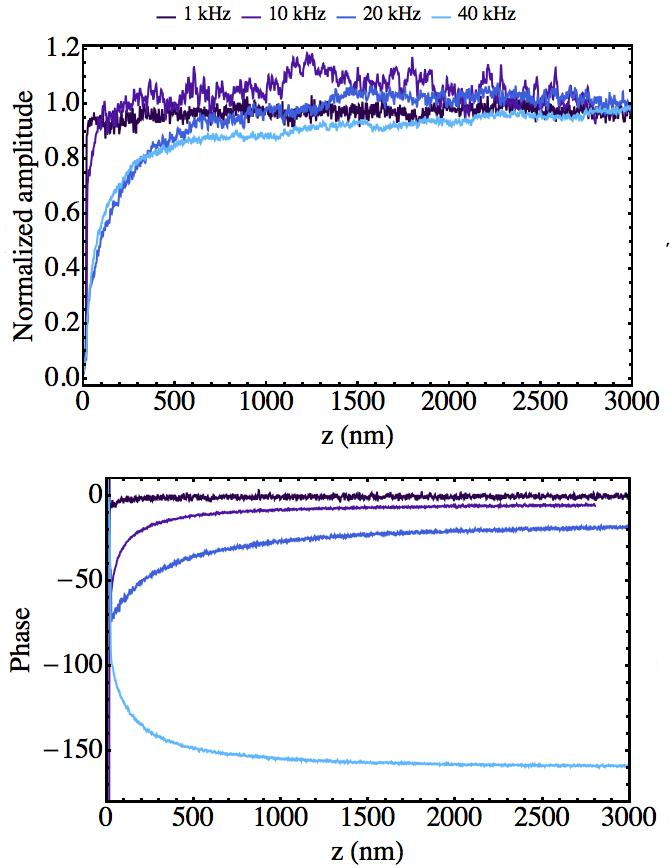
Fig.3 reports the measured dissipation and the stiffness obtained through the linear transformation, using Eq.2 and 3, and the amplitude and phase change presented in Fig.2. Measured damping is directly compared to the theoretical damping given by lubrication approximation (cf Eq.1) without adjustable parameters. As expected, the measured damping matches the theoretical damping in this regime. The damping measured at 40 kHz presents a small deviation from the theory. It presents an non-reproducible offset between the mechanical zero and the hydrodynamic zero of around 50nm, which might is most highly due to the presence of an impurity. The stiffness is essentially zero except when the tip is in mechanical contact with the sample and matches the minus of the derivative of the static force, as shown in green in Fig.3. This result is coherent with experiment performed in salt-water whose ions screen the surface potential and with the lubrication theory which gives a null stiffness for this regime following:
Where E*is the reduce Young modulus of the sample.
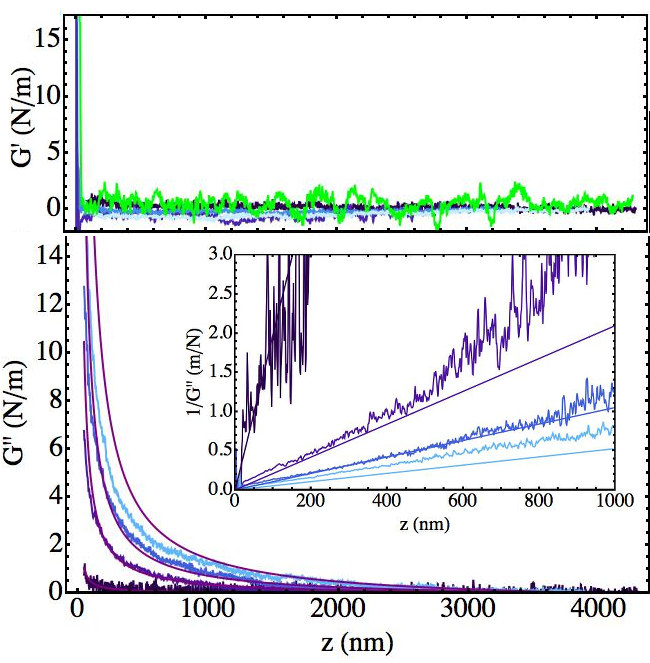
To further characterize the viscous damping, we add in the inset of Fig.3 to the inverse of the measured damping 1/G” the inverse of the theoretical dissipation. This demonstrates that the measured damping behaves as d-1. The hydrodymanic zero can be extracted from the intersection with the z-axis. To the precision of our measurment in the case of hard sample, the hydrodymanic zero matches the mechanical zero. This result first shows that when in linear regime there is no direct benefit to work at the first eigenmode especially in liquid. Second, when linear regime is established it is easy to recover the dynamic interaction whatever the excitation frequency around a eigenmode. Finally, that proves that even a simple interaction can varied from order of magnitude with respect to the frequency. The FFM is thus a helpful tool to time dependent interaction.
In conclusion we have demonstrated that we are able to recover quantitatively the dynamic part of the interaction in a liquid media with only the knowledge of the transfer function of the lever in the experimental conditions and without adjustable parameters. The good agreement of the calculated dissipation with the experimental data shows that the FFM is an excellent candidate for performing experiment into liquid and open new route toward the measurement of mechanical properties of soft matter. From the dynamic transition from a viscous-dominated behavior at large distance to an elastic-dominated behavior at short distance, we aim to extract the Young modulus of soft and thin filmleroy2011hydrodynamic . The increase in the frequency range of this mechanical testing, compared to the SFA, allows us to probe the possibility of the frequency dependence and the viscoelastic properties of soft and thin films.
References
- [1] Simon Carpentier, Mario S Rodrigues, and Joël Chevrier. Variable frequency characterization of interaction at nanoscale in linear dynamic afm: an ffm primer. arXiv preprint arXiv:1412.2640, 2014.
- [2] S Leroy and E Charlaix. Hydrodynamic interactions for the measurement of thin film elastic properties. Journal of Fluid Mechanics, 674:389–407, 2011.
- [3] Jacob N Israelachvili. Israelachvili J.N. Intermolecular and surface forces (AP 1992).pdf, 1992.
- [4] F Benmouna and Diethelm Johannsmann. Hydrodynamic interaction of afm cantilevers with solid walls: An investigation based on afm noise analysis. The European Physical Journal E: Soft Matter and Biological Physics, 9(5):435–441, 2002.
- [5] Abdelhamid Maali, Cedric Hurth, Rodolphe Boisgard, Cédric Jai, Touria Cohen-Bouhacina, and Jean-Pierre Aimé. Hydrodynamics of oscillating atomic force microscopy cantilevers in viscous fluids. Journal of Applied Physics, 97(7):074907, 2005.
- [6] Mario S Rodrigues, Luca Costa, Joël Chevrier, and Fabio Comin. Why do atomic force microscopy force curves still exhibit jump to contact? Applied Physics Letters, 101(20):203105, 2012.
- [7] D Rugar, HJ Mamin, and Peter Guethner. Improved fiber-optic interferometer for atomic force microscopy. Applied Physics Letters, 55(25):2588–2590, 1989.
- [8] Mario S Rodrigues, Luca Costa, Joël Chevrier, and Fabio Comin. System analysis of force feedback microscopy. Journal of Applied Physics, 115(5):054309, 2014.
- [9] Euan J Boyd and Deepak Uttamchandani. Measurement of the anisotropy of young’s modulus in single-crystal silicon. Microelectromechanical Systems, Journal of, 21(1):243–249, 2012.