Empirical Isochrones for Low Mass Stars in Nearby Young Associations
Abstract
Absolute ages of young stars are important for many issues in pre-main sequence stellar and circumstellar evolution but are long recognized as difficult to derive and calibrate. In this paper, we use literature spectral types and photometry to construct empirical isochrones in HR diagrams for low-mass stars and brown dwarfs in the Cha, Cha, and TW Hya Associations and the Pic and Tuc-Hor Moving Groups. A successful theory of pre-main sequence evolution should match the shapes of the stellar loci for these groups of young stars. However, when comparing the combined empirical isochrones to isochrones predicted from evolutionary models, discrepancies lead to a spectral type (mass) dependence in stellar age estimates. Improved prescriptions for convection and boundary conditions in the latest models of pre-main sequence models lead to a significantly improved correspondence between empirical and model isochrones, with small offsets at low temperatures that may be explained by observational uncertainties or by model limitations. Independent of model predictions, linear fits to combined stellar loci of these regions provide a simple empirical method to order clusters by luminosity with a reduced dependence on spectral type. Age estimates calculated from various sets of modern models that reproduce Li depletion boundary ages of the Pic Moving Group also imply a Myr age for the low mass members of the Upper Sco OB Association, which is younger than the 11 Myr age that has been recently estimated for intermediate mass members.
Subject headings:
stars: pre-main sequence — stars: planetary systems: protoplanetary disks matter — stars: low-mass1. INTRODUCTION
Age estimates for pre-main sequence stars are critical in assessing the timescales for the formation of stellar systems and the evolution of molecular clouds. The fraction of embedded sources determines how long the dominant phase of stellar growth lasts and how quickly the envelope disperses. Similarly, when combined with disk fractions, age measurements place strict constraints on the time available for giant planets to form. Ages are also important in quantifying how the stellar contraction leads to rotational spin-up and changes in interior structure for solar and intermediate mass stars, factors which combine to determine the initial conditions for the evolution of magnetic activity for the duration of the stellar lifetime. Members of young stellar associations are usually dated by comparing their temperatures and luminosities to pre-main sequence tracks. However, errors and biases in placing stars on Hertzsprung-Russell (HR) diagrams lead to uncertainty in ages of different clusters, while large luminosity spreads among members of individual clusters enhance uncertainty regarding age dating of any individual star (see review by Soderblom et al., 2014).
Further uncertainties in pre-main sequence age estimates from HR diagrams are traced directly to the varied stellar loci predicted from different stellar evolution models and to the lack of consistency between predicted and observed stellar loci. These differences have been noted between low and intermediate mass stars (e.g. Hillenbrand, 1997; Hillenbrand et al., 2008; Naylor, 2009) and among low mass stars of different mass (e.g. da Rio et al., 2010; Murphy et al., 2013; Kraus et al., 2014; Alcala et al., 2014; Herczeg & Hillenbrand, 2014; Malo et al., 2014a). Components of young binary systems frequently have different estimates for age despite an expectation that they are co-eval (Hartigan et al., 1994; Hartigan & Kenyon, 2003; Kraus & Hillenbrand, 2009; Gennaro et al., 2012). As a direct consequence, age estimates depend on the considered range in spectral type or stellar mass. Hillenbrand et al. (2008) found that in many regions G stars appears times older than K stars, depending on which pre-main sequence tracks were used. Pecaut et al. (2012) quantified these differences by measuring an age for the Upper Sco OB Association of Myr, larger than the 5 Myr age measured previously from pre-main sequence low mass stars (Preibisch et al., 2002; Slesnick et al., 2006). Similarly, in both younger and older clusters, analyses of main sequence turnoff and intermediate mass stars in color-magnitude diagrams yield ages that are twice as large as those obtained from low mass pre-main sequence stars (Mayne & Naylor, 2008; Naylor, 2009; Bell et al., 2013).
Nearby stellar associations with ages of 5–40 Myr provide us with a laboratory to establish empirical isochrones, which can be used as a model-independent clock and as a benchmark for testing pre-main sequence models. Within a single association older than 10 Myr, the age spread expected from star formation processes is small compared to the absolute age. Member stars have traveled far from any remnant molecular material associated with their birth cloud and are unaffected by interstellar extinction. Most disks have already dispersed by these ages, so observational uncertainties related to accretion and circumstellar extinction are negligible for the vast majority of stars in this age range. In recent years, the growing number of proper motions and parallax distances have led to a substantial improvement in the accounting of membership within young associations (e.g. Malo et al., 2013; Kraus et al., 2014). The HR diagrams of these nearby moving groups should consequently have only a small age spread.
At younger ages, placing stars on HR diagrams is more problematic because accretion and extinction affects temperature and luminosity measurements, and because the affect of any genuine age spread on luminosities decreases (in dex) with age. Nevertheless, wide spreads in luminosities of members of young clusters have been interpreted as true age spreads. For example, in the ONC a 1.5 dex luminosity spread (Da Rio et al. 2010) led Reggiani et al. (2011) to claim an age spread of 1.5–3.5 Myr, although some of this spread may alternately be interpreted as a spread in radius from different accretion histories (Hartmann et al., 1997; Baraffe et al., 2009). Improved spectral types and extinction measurements of two outliers in the ONC sample indicate that the luminosity spread may be overestimated (Manara et al., 2013). If we consider Myr as an approximate age spread, then that would lead to 0.16 dex and 0.08 dex spreads in luminosities of 5 Myr old and 20 Myr old clusters of single stars (as assessed for 3500 K stars from the Baraffe tracks, see §2.5). These luminosity spreads are consistent with the 0.05 to 0.15 dex errors in placing young stars in the HR diagram (see Table 1; Preibisch et al., 2012; Soderblom et al., 2014).
In this paper, we use literature spectral types and photometry to construct empirical isochrones of luminosity versus temperature of diskless low mass stars in nearby associations and compare them to pre-main sequence isochrones. This approach is similar to the empirical isochrones derived by Hillenbrand (2009) and by Bell et al. (2012, 2013, 2014), but is focused exclusively on low mass stars in nearby young associations and moving groups and is motivated by a desire for deriving simple formulations that approximate empirical isochrones in HR diagrams. In §2, we describe the literature data that is used to place stars on HR diagrams and the pre-main sequence evolutionary tracks used for age estimates. In §3 we develop empirical isochrones for a set of benchmark young associations. In §4, the empirical isochrones are compared to isochrones predicted from models of pre-main sequence evolution to test evolutionary tracks and to obtain age estimates for the young clusters for each model. In §5, we discuss how the ages from different tracks compare with independent age measurements.
2. SAMPLE, DATA, and PRE-MAIN SEQUENCE EVOLUTION MODELS
2.1. Membership and Properties of Nearby Moving Groups
The Pic and Tuc-Hor Moving Groups and the Cha, Cha, and TW Hya Associations are used in this paper as benchmark clusters to measure empirical isochrones of young regions. The results obtained from these benchmark clusters are then applied to the Upper Sco OB Association. Searches for membership in existing all sky surveys, along with analyses of proper motions and radial velocities, have substantially improved the confidence in membership for these associations. Meanwhile, the proliferation of accurate parallax measurements for the nearest groups has significantly reduced the uncertainty in luminosities arising from errors in distance measurements. When combined, these advances allow for a robust analysis of the stellar loci of these clusters.
In some analysis below, the two older associations (the Pic and Tuc-Hor Moving Groups) and the three younger associations (TW Hya, Cha, and Cha) are grouped together. Gravity differences between these clusters are described in §2.2-2.3, and the similarity in ages amongst the older and younger groups will be established in §3. The binary census is discussed in this section, while the implementation of binaries is described in §2.4.
Beta Pic Moving Group: Membership for the Pic moving group is obtained from the analysis of Malo et al. (2013, 2014b), based on a % probability calculated from proper motion, radial velocity, photometry, and parallaxes when available. Spectral types are obtained from their compilation of literature spectral types. Members with distances obtained from kinematic modelling are not used in this paper because many targets are close enough that the percentage uncertainties are too large3. Binarity was accounted for based on the compilation of Malo et al. (2013), which relied heavily on Janson et al. (2012) for M-dwarfs. A few objects and binary information is added from Riedel et al. (2014). 33footnotetext: The confirmed members ( probability) with parallax distances occupy a tight stellar locus, with a luminosity scatter of 0.14 dex around the best fit line. Confirmed members between 3300–5000 K with only kinematic distances have a luminosity scatter (standard deviation about the mean linear fit) of 0.36 dex (0.25 dex if restricted to 3350–5000 K).
Tuc-Hor: The membership and spectral types for the Tuc-Hor Association is obtained from Kraus et al. (2014). The distances used here are from their kinematic analysis4. The spectral types used here are obtained from their spectral analysis rather than the SEDs. Binary information is not included in our analysis of Tuc-Hor. 44footnotetext: Unlike the case for the Pic Moving Group, the kinematic distances for Tuc-Hor produce a tight stellar locus, perhaps because the average distance is larger so the fractional uncertainty is smaller. Kraus et al. (2014) calculate that a 5% uncertainty in kinematic distance measurements applies to stars in their sample with a typical 5 mas yr-1 error in proper motion. This claim is supported by parallax measurements of five stars (van Leeuwen, 2007; Riedel et al., 2014) that differ by 4% from the kinematic distances in Kraus et al.
Cha Association: Membership, spectral types, and kinematic distances of Cha members were obtained from Murphy et al. (2013). This membership list is mostly consistent with but more complete than that of Lopez Marti et al. (2013). The targets listed as members in Lopez Marti et al. (2013) but excluded from Murphy et al. (2013) are VW Cha and CM Cha, both of which have disks and would therefore not be included in our analysis, and 2MASS J12074597-7816064, which was identified by Fang et al. (2013) as a proper motion outlier. The kinematic distances from Murphy et al. (2013) are adopted here and have a median of 111 pc. The known binaries are accounted for following the description in Murphy et al. (2013), though the binary census is poor.
Cha Cluster: Membership in the Cha cluster is based primarily on the initial identification by Mamajek et al. (1999) and on a follow-up census by Luhman & Steeghs (2004). The spectral types for those initial 18 members are obtained from Luhman & Steeghs (2004). Five dispersed very low mass stars were found and characterized by Murphy et al. (2010) and are also included here. The additional members found by Lopez Marti et al. (2013) based on proper motions and the Covino et al. (1997) X-ray survey are excluded here because they are far from the cluster core and may therefore be located at a different distance. The distance to all members is assumed to be 94 pc, the average Hipparcos parallax distance of Cha and RS Cha (van Leeuwen 2007; see discussion in Murphy et al. 2010). An accounting of spatially resolved binaries was obtained by Brandeker et al. (2006) and is applied here.
TW Hya Association: Membership in the TWA is based on kinematic analyses (Malo et al., 2013, 2014b; Weinberger et al., 2013; Ducourant et al., 2014; Riedel et al., 2014). Spectral types of most members and binarity are obtained from the compilation in Herczeg & Hillenbrand (2014). The new equal luminosity binary TWA member SCR 1012-3124AB is also included here (Riedel et al., 2014). Although parallax distances are preferred, TWA stars with kinematic distance measurements are included in our analyses. For TWA 8A and 8B, a parallax distance distance of 44 pc is adopted here as the average of parallax distances measured by Ducourant et al. (2014) and Riedel et al. (2014). Three members of the HD 98800 quadruple system are included here with data from Laskar et al. (2009), despite the presence of weak IR emission from HD 98800 N.
Upper Sco OB Association: The stellar census and spectral types for the Upper Sco OB Association are obtained from the compilation of members by Luhman & Mamajek (2012). Multiplicity is corrected based on several incomplete companion searches (Kraus et al., 2008; Kraus & Hillenbrand, 2012; Biller et al., 2011; Lafreniere et al., 2014). The luminosities estimated for the Upper Sco OB Association members are corrected for extinction (see §2.4). The average extinction5 of magfor low mass stars and mag for brown dwarfs is intermediate between the average extinction of mag for A stars, mag for G stars, and mag for F stars Pecaut et al. (2012). Stars with mag are atypical for Upper Sco and are not included in the HR diagram analysis. All stars in Upper Sco are assumed to be located at a distance of 145 pc (de Zeeuw, 1999). The cluster is 30 pc wide, and a depth of similar length likely contributes to the large luminosity spread that has been measured for Upper Sco (Slesnick et al., 2008). 55footnotetext: The extinction for both low mass stars and brown dwarfs is 0.66 mag if the photospheric J–K color is adopted from the older moving groups rather than the younger clusters.
Stars without any WISE W2 or W3 photometry (2 of 214 stars total between 3200–5000 K, 7 of 415 total brown dwarfs between 2800–3200 K) are included in the Upper Sco sample because their exclusion could bias any results at low masses against faint objects.
| Parameter | Range | Uncertainty |
| Temperature | K | 200 K or 2 SpT subclasses |
| Temperature | 3750–4100 K | 125 K or 1 SpT subclass |
| Temperature | 2800–3750 K | 75 K or 0.5 SpT subclasses |
| Luminosity | all | parallax distance |
| Luminosity | all | 10-20% kinematic distance |
| Luminosity | all | 2-5% bolometric correctiona |
| aOr 0.02-0.05 in mag | ||
2.2. Colors of the Five Benchmark Clusters
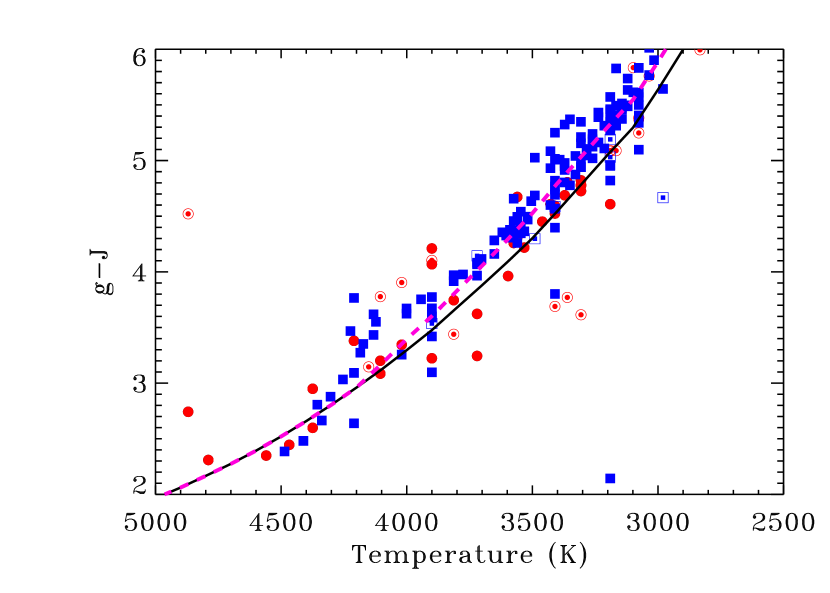
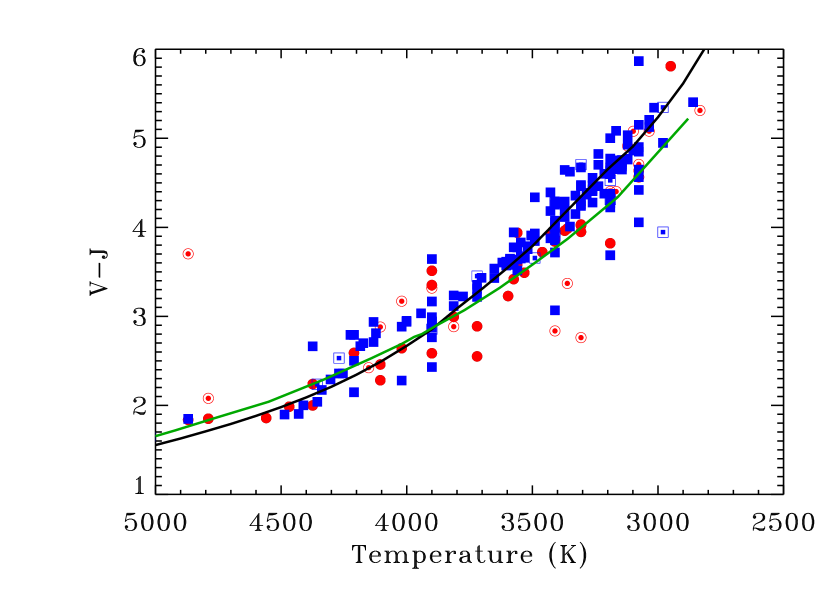
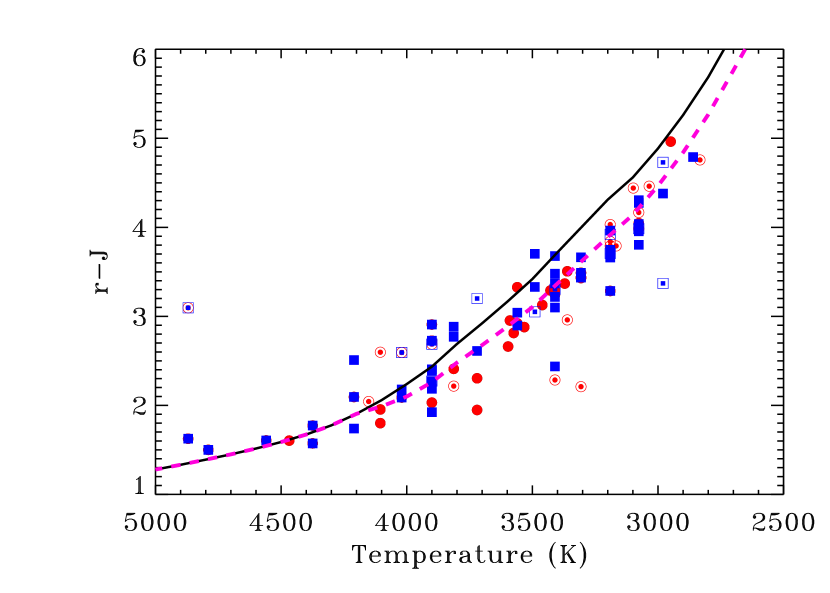
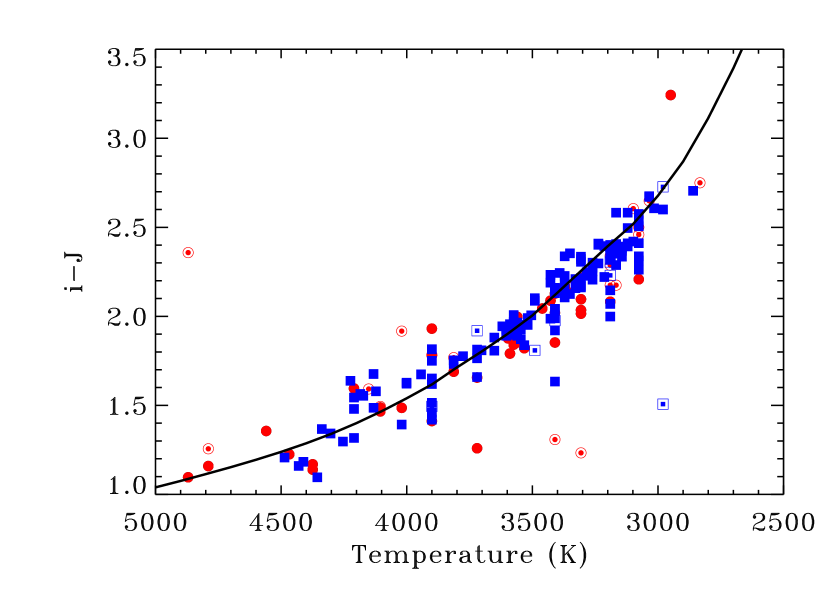
Photometry for members of the five benchmark clusters are obtained from the 2MASS JHKs survey (Skrutskie et al., 2006), WISE W1, W2, W3, W4 survey (Cutri et al., 2012), the UCAC4 APASS all-sky BVgri survey (Zacharias et al., 2013), and the GALEX NUV/FUV survey (Bianchi et al., 2011). This collection of photometry is used in the following subsections to identify and exclude disks, to ensure that extinction is negligible (or correct luminosities for extinction, in the case of Upper Sco members), and to calculate bolometric corrections (see also Appendix A). All objects are detected in JHK. Some objects lack photometry at other bands.
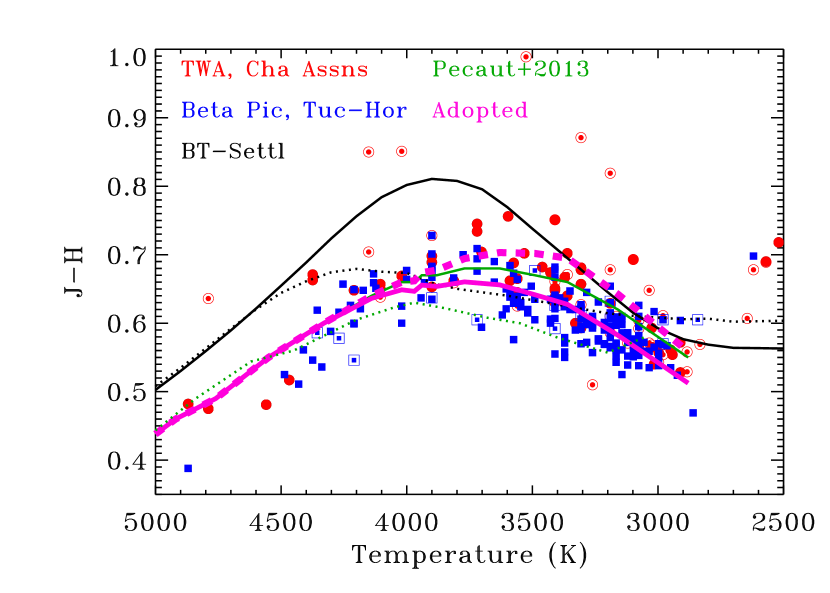
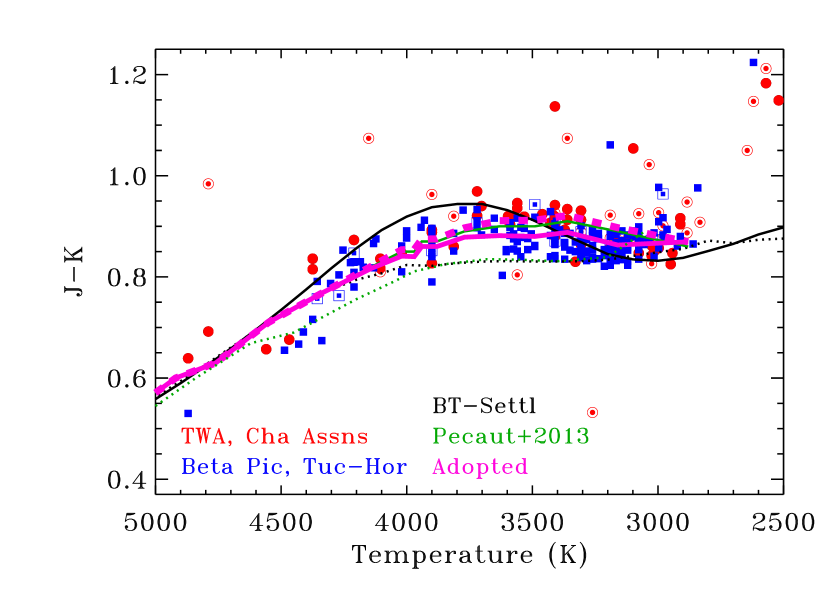
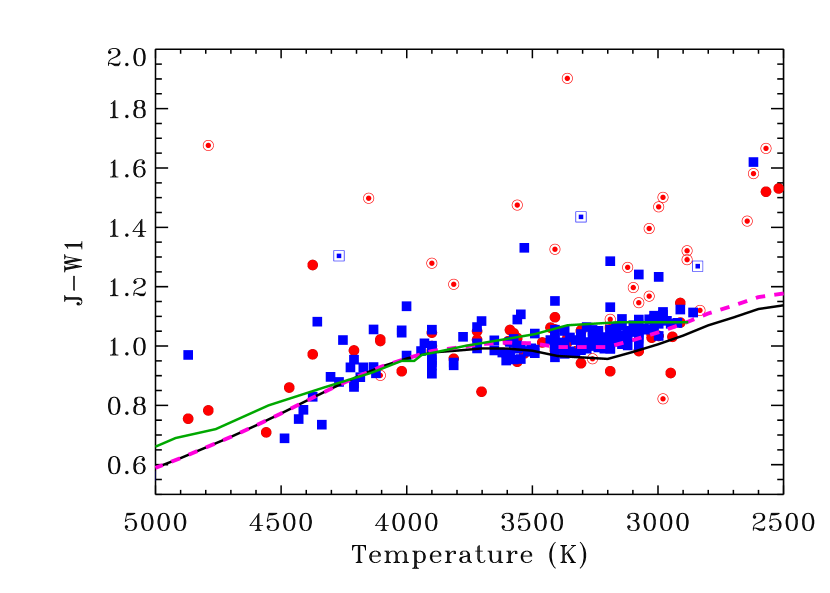
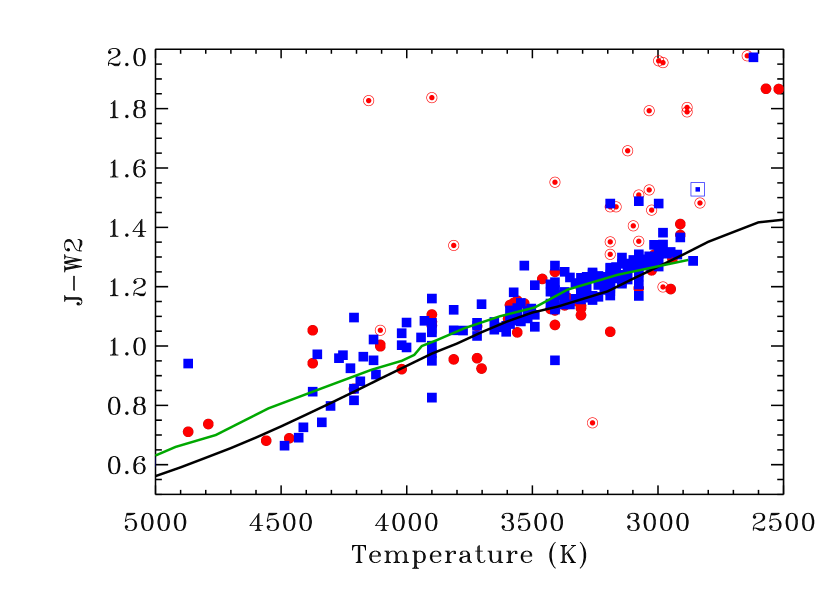
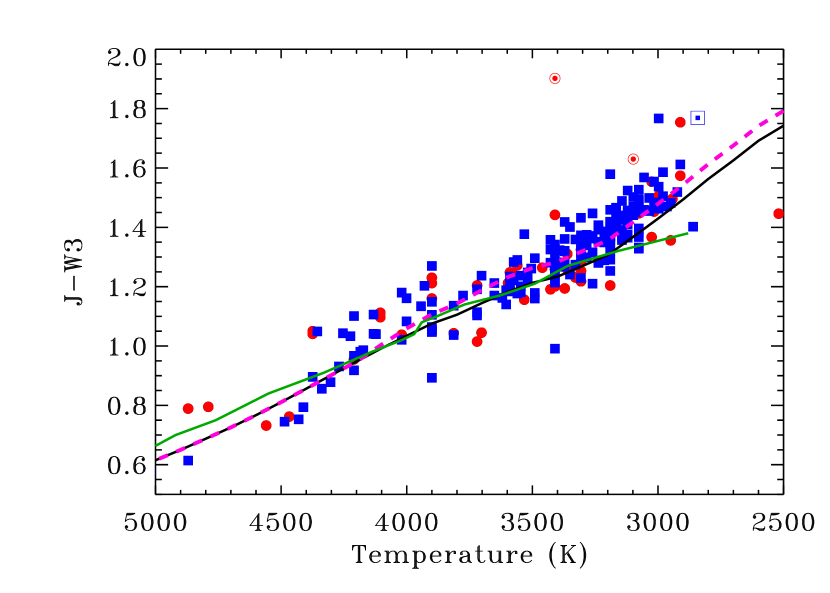
Broadband colors of objects in the younger TW Hya, Cha, and Cha Associations are mostly consistent with those from the older Pic and Tuc-Hor Moving Groups, which all form a tight stellar locus in infrared and optical colors (Figure 1 and Appendix). The contraction to the main sequence corresponds with a gradual increase in gravity. Just as different gravities between main sequence and young stars yields color differences (e.g. Luhman et al., 2003; Pecaut & Mamajek, 2013), corresponding differences should be present between 5 and 30 Myr old pre-main sequence stars. The J–H color is redder for the younger associations relative to the older moving groups (Table 2 and right panel of Figure 1), which is the result of gravity differences and possible mismatches between SpT and temperature between the two samples. The J–K color is also mag redder for early-to-mid M stars in younger associations. Most empirical colors for the sample stars are also consistent with the intrinsic colors for the 5–30 Myr stars as assessed by Pecaut & Mamajek (2013).
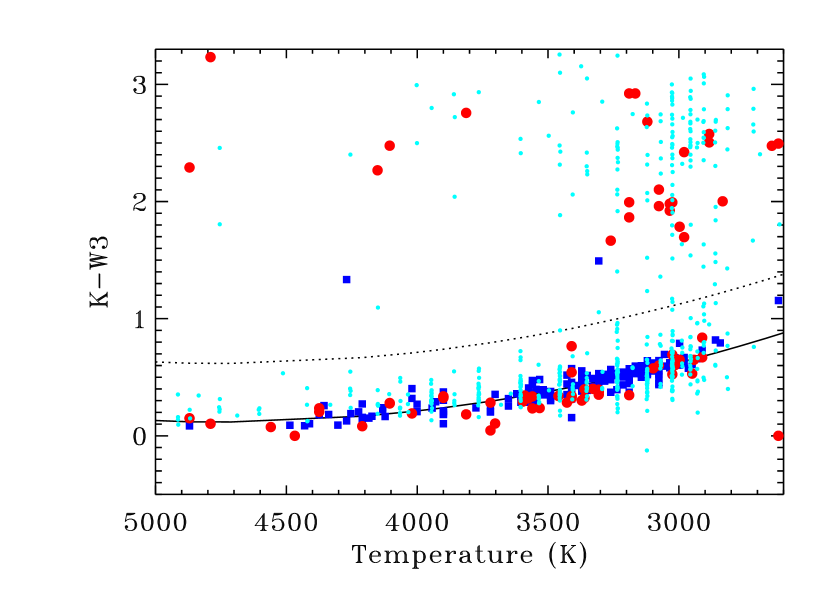
The sample is restricted to diskless stars. Disks are identified by at least one of a K-W3 excess or K-W2 of 0.5 mag above the photospheric level, as determined from the obseved stellar locus and from photospheric models (Figure 2; see also, e.g., Luhman & Mamajek 2012). A few stars may retain transition or debris disks that do not appear as a K-W2 or K-W3 excess, but these disks are unlikely to affect the J-band brightness of the star. The sources 2MASS J08014860-8058052, 2MASS J11550485-7919108, and 2MASS J02153328-5627175 fall below our disk criteria but are excluded in our analysis because of excess emission in the WISE W4 band or the detection of accretion in optical spectra (Murphy et al., 2011, 2013; Cutri et al., 2012).
| BC | J-H | ||||||
| SpT | HH14b | PM13c | Here | PM13c | Oldd | Youngd | PM13c |
| F5 | 6600 | 6420 | 0.79 | 0.85 | 0.17 | 0.17 | 0.19 |
| F8 | 6130 | 6100 | 0.95 | 0.96 | 0.22 | 0.22 | 0.23 |
| G0 | 5930 | 6050 | 1.02 | 0.98 | 0.26 | 0.26 | 0.24 |
| G2 | 5690 | 5870 | 1.10 | 1.03 | 0.30 | 0.30 | 0.27 |
| G5 | 5430 | 5500 | 1.18 | 1.16 | 0.34 | 0.34 | 0.33 |
| G8 | 5180 | 5210 | 1.26 | 1.25 | 0.40 | 0.40 | 0.39 |
| K0 | 4870 | 5030 | 1.36 | 1.30 | 0.47 | 0.47 | 0.43 |
| K2 | 4710 | 4760 | 1.41 | 1.40 | 0.50 | 0.50 | 0.49 |
| K5 | 4210 | 4140 | 1.56 | 1.58 | 0.63 | 0.63 | 0.64 |
| K7 | 4020 | 3970 | 1.62 | 1.63 | 0.66 | 0.66 | 0.66 |
| M0 | 3900 | 3770 | 1.66 | 1.69 | 0.67 | 0.68 | 0.68 |
| M1 | 3720 | 3630 | 1.73 | 1.74 | 0.67 | 0.70 | 0.68 |
| M2 | 3560 | 3490 | 1.78 | 1.80 | 0.65 | 0.70 | 0.67 |
| M3 | 3410 | 3360 | 1.84 | 1.84 | 0.63 | 0.70 | 0.66 |
| M4 | 3190 | 3160 | 1.93 | 1.91 | 0.58 | 0.65 | 0.62 |
| M5 | 2980 | 2880 | 1.99 | 2.01 | 0.53 | 0.59 | 0.55 |
| M6 | 2860 | 2.03 | 0.50 | 0.55 | |||
| M7 | 2770 | 2.06 | 0.48 | 0.53 | |||
| aFollowing Pecaut & Mamajek (2013), the zero point for the | |||||||
| J-band magnitude is erg cm-2 s-1 Å-1 and | |||||||
| for the absolute magnitude is erg cm-2 s-1 | |||||||
| bHH14 refers to Herczeg & Hillenbrand (2014) | |||||||
| cPM13 refers to the 5–30 Myr stars in Table 6 | |||||||
| of Pecaut & Mamajek (2013) | |||||||
| dJ–H colors given for the median of diskless stars from the | |||||||
| two old moving groups and three young associations | |||||||
2.3. Bolometric Corrections and Temperature Scale
The luminosities of stars in the five young, benchmark associations are calculated by applying bolometric corrections to 2MASS J-band magnitudes (Skrutskie et al., 2006). Any bulk offset between the actual and implemented bolometric correction would lead to an offset in luminosity and therefore age, while any temperature dependence in bolometric correction offset would change the relative luminosities/ages of stars in the same association but with different temperatures. These systematic uncertainties introduce problems when comparing different methods and when comparing observations to models. In this subsection, we calculate bolometric corrections and subsequently assess temperature dependence in the uncertainties by comparing results from temperature and bolometric corrections derived here to those of Pecaut & Mamajek (2013). The Appendix describes the color corrections and constants that are used here to calculate fluxes and stellar luminosities.
Our bolometric corrections are calculated from the BT-Settl model atmospheres (version CIFITS2011bc, which use abundances from Caffau et al. 2011) with (Allard et al., 2012). Minor offsets relative to the J-band flux are applied to several spectral bands to account for differences between synthetic and observed photometry (see Figure 13). Spectral types are converted to temperature from the conversion scale of Herczeg & Hillenbrand (2014), which were calculated by comparing low resolution optical blue-red spectra to 2011 BT-Settl models. The model spectra and observed photometry are compared in magnitude space. The synthetic photometry is calculated by convolving the BT-Settl model spectra in photon units with filter transmission curves (see Appendix A). The empirical colors are obtained from the photometry described in §2.2. The primary uncertainties in these empirical corrections are introduced by the lack of photometric coverage in the z and Y bands and in near-IR regions with poor telluric transmission, which are located between the zYJHK filters.
Table 2 compares our spectral type-temperature conversion and bolometric corrections to the 5–30 Myr stars of Pecaut & Mamajek (2013). In general, temperatures in Pecaut & Mamajek (2013) are 100–200 K cooler than those presented here. These errors are roughly assessed from the uncertainty in assigning spectral types from low resolution optical spectra. Pecaut & Mamajek (2013) also include K8 and K9 spectral types. Their SpT-temperature conversion extend only to M5, so results for brown dwarfs (§3.2) are limited to the conversions of Herczeg & Hillenbrand (2014). When evaluated at the same temperature, the bolometric corrections measured directly from the BT-Settl models with the Caffau et al. (2011) abundances reproduce the Pecaut & Mamajek (2013) bolometric corrections to within 1% at all spectral types, even though Pecaut & Mamajek (2013) used models with abundances from Asplund et al. (2009). Differences between our bolometric corrections and those of Pecaut et al. are introduced by differences in the SpT-temperature conversion and by our tweaking of the BT-Settl models to reproduce the measured colors, relative to J. The bolometric correction versus spectral type is also different because of the different spectral type-temperature conversion scale. As a consequence, when compared by temperature, bolometric corrections are similar for M-dwarfs and % smaller here for K-dwarfs. The practical result of these differences is that temperatures are K higher and luminosities are brighter relative to those calculated from Pecaut & Mamajek (2013) bolometric correction and temperature scales.
The analysis of stellar temperatures and luminosities for 3200–5000 K stars (§3.1) is repeated for the Pecaut & Mamajek (2013) SpT-temperature conversions and bolometric corrections. Both Pecaut & Mamajek (2013) and Herczeg & Hillenbrand (2014) base their SpT-temperature conversions on the BT-Settl models, although Tottle & Mohanty (2015) find discrepancies between these models and near-IR colors at both early and late-M spectral types. While the SpT-temperature conversion is still a significant source of uncertainty, the main results of this paper are robust to systematic uncertainties in these scales.
2.4. HR Diagram Methodology
Stellar luminosities are calculated from 2MASS J-band brightness, literature spectral types, and stellar distances calculated from parallax measurements or from association kinematics. The J-band is used for luminosity calculations because of the uniform reliability of the 2MASS survey, and because the J-band is near the peak of the spectral energy distribution for late type stars, which minimizes the uncertainty in bolometric correction caused by spectral type errors. The stars are diskless, so accretion and disk extinction do not affect the observed J-band photometry. Stars in each association are assumed to be co-eval.
Table 1 lists the uncertainties applied here for luminosity and temperature estimates. Luminosity uncertainties are calculated from an assumed 5% uncertainty from a combination of photometric and bolometric correction errors and from distance uncertainties, typically % for parallax distances (5% distance uncertainty is assessed for all Cha Association members), 5% for kinematic distances for Tuc-Hor members (see footnote 3), and 10% for kinematic distances of other regions. Bolometric corrections for the J-band are described in detail in the next section and are more uncertain for cooler stars with large opacities in molecules. The depth of Upper Sco adds uncertainty in the distance and therefore luminosity for individual members, which contributes to its luminosity spread. Temperature uncertainties are based on estimated errors and methodological differences in spectral typing (see discussion in Herczeg & Hillenbrand 2014). Systematic differences in spectral typing between different studies will also affect the HR diagrams constructed in this paper.
In multiple systems, all members with resolved spectral types are included in this analysis. Unresolved spectral types are included if the stars are spatially resolved in J, H, or K-bands. In these cases, the primary is assumed to have the system spectral type. The J-band magnitude of the primary is calculated by assuming that the brightness difference is constant in the near-IR (the J–H and J–K colors roughly constant for M-dwarfs). Optically resolved or double-lined spectroscopic binaries are included if both stars are similar brightness. Single-lined binaries are excluded.
Extinction is negligible and assumed to be negligible for all diskless stars in the five benchmark associations (see colors in §2.2 and the Appendix). Stars in the younger associations have a slightly bluer g-J color, which is the opposite of expectations if extinction were important and supports the assumption that extinction is negligible. The four stars in Cha with mag, as calculated by Murphy et al. (2013), all have disks, which may either produce extinction or may alter the near-IR colors sufficiently to have led to extinction in their calculations.
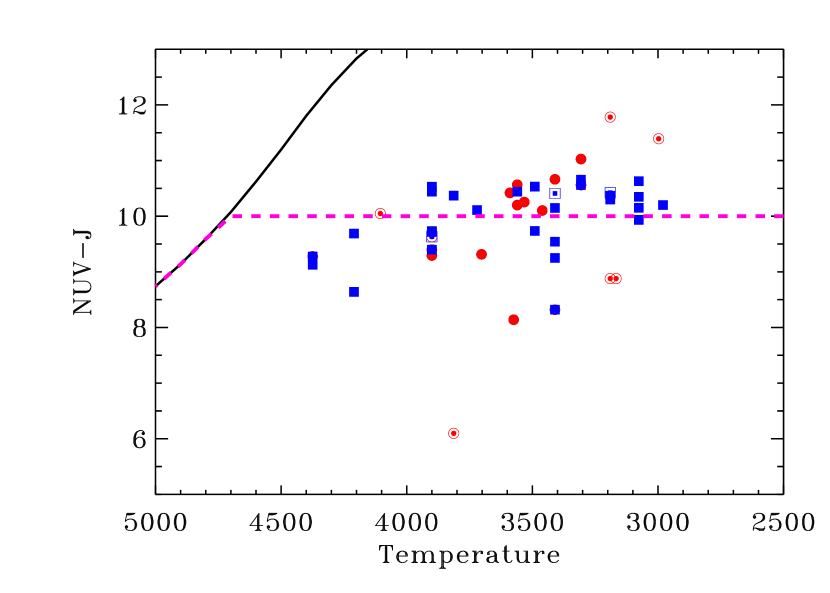
However, extinction affects luminosities of stars in the Upper Sco OB Association. A color excess E(J-K) is calculated for each star here from by measuring the difference between the observed J–K color the J–K color adopted for the young associations, as shown as the dashed purple line in Figure 1. The extinction is then calculated and corrected for by assuming a total-to-selective extinction of , and from Rieke & Lebofsky (1985). If the total-to-selective extinction instead of 3.1, the values would increase by 0.07%, as calculated from the extinction curves of Weingartner & Draine (2001).
Young K and M stars without disks have extinctions accurate to mag, although the precise error in extinction depends on the error in spectral type. Stars with extinctions mag are excluded from our analysis. Negative values for extinction are retained and applied for statistical purposes.
2.5. Models of pre-main sequence evolution
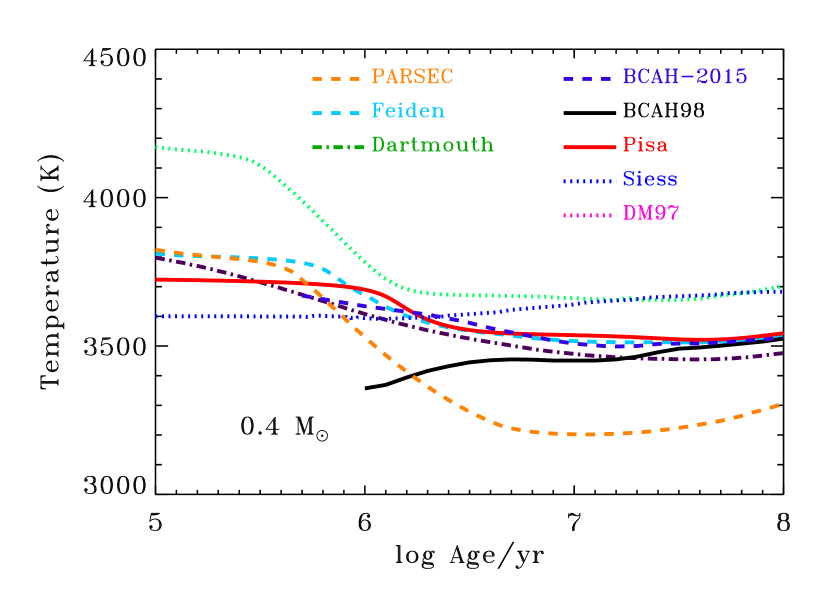
The empirical isochrones derived in §3 are compared to pre-main sequence isochrones in §4. Stassun et al. (2014) summarizes currently available pre-main sequence evolutionary tracks. The evolutionary models used here, D’Antona & Mazzitelli (1997, hereafter DM97), Siess et al. (2000, hereafter Siess), Baraffe et al. (1998, 2003, hereafter BCAH98), Dotter et al. (2008, hereafter Dartmouth), Tognelli et al. (2011, hereafter Pisa), and PARSECv1.2s (Bressan et al. 2012, Chen et al. 2014; herafter PARSEC, also frequently referred to as Padova), are selected based on their availability and prevalence in the pre-main sequence literature. The BCAH98 models have mixing lengths (BCAH98) or mixing length (hereafter BCAH98-1.9). The PARSEC models are selected for their artificial tweaks to the relationship that reproduce the color-magnitude diagrams of very low mass stars in Praesepe and M67. For stars below 4000 K, stars of the same age and mass are much cooler and are only slightly less luminous (because of larger radii) in the PARSECv1.2s models relative to the PARSECv1.1 models (Bressan et al., 2012). The PARSECv1.1 models are used only in Table 3 and are not discussed further.
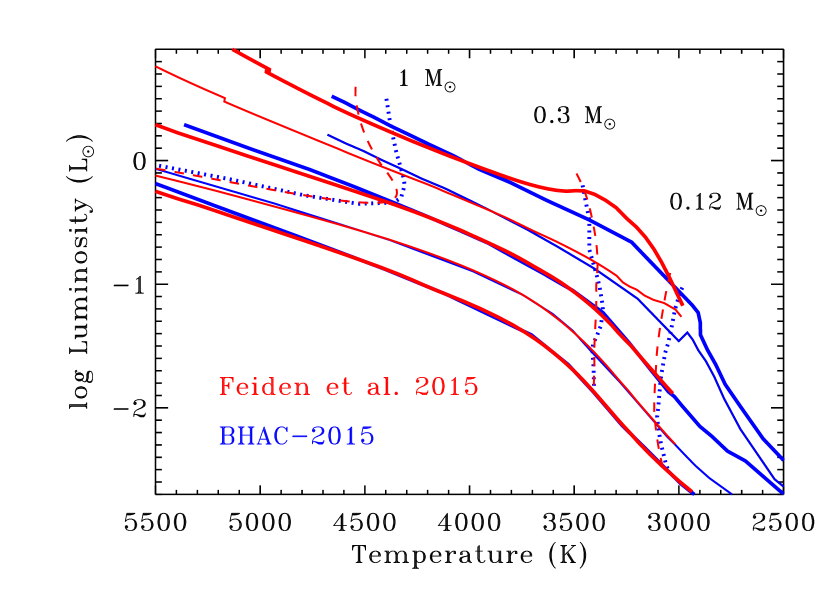
In addition to these sets of models, we include analysis of newly available tracks calculated by Baraffe et al. (2015, hereafter BHAC-2015) using the BT-Settl atmospheric models and a prescription of convection based on 2D/3D models, which is an improvement from the mixing length prescription for convection. We also include new Dartmouth tracks, which improve the thermal structure in the atmosphere by calculating fitting to large optical depths (Feiden et al. in prep., private communication, hereafter Feiden). The Feiden models use the Grevesse & Sauval (1998) abundances with PHOENIX AMES-COND atmospheres (Hauschildt et al., 1999a, b). Stassun et al. (2014) include preliminary descriptions of the Feiden tracks, while Malo et al. (2014a) use a magnetic version of the Feiden tracks. The BHAC-2015 and Feiden models predict very similar temperature/luminosity evolution for low mass stars and brown dwarfs, which then yields very similar isochrones (Figure 4).
All model tracks use solar abundances6, which is consistent with abundance measurements of young stars in the solar neighborhood (e.g. D’Orazi et al., 2011). Only the BCAH98 and the DM97 pre-main sequence tracks are available for masses , while the Pisa models are only available for masses M⊙. The BCAH98 models with are available for stars less massive than while only models between have been calculated with . The PARSEC models are only calculated to M⊙, but extend to low temperatures (2800 K at 1 Myr, 2500 K at 10 Myr) because the tweaks to the relationship reduce the effective temperature of very low mass stars. 66footnotetext: Changes in solar abundance measurements means that these models may use different abundances and are therefore not directly comparable.
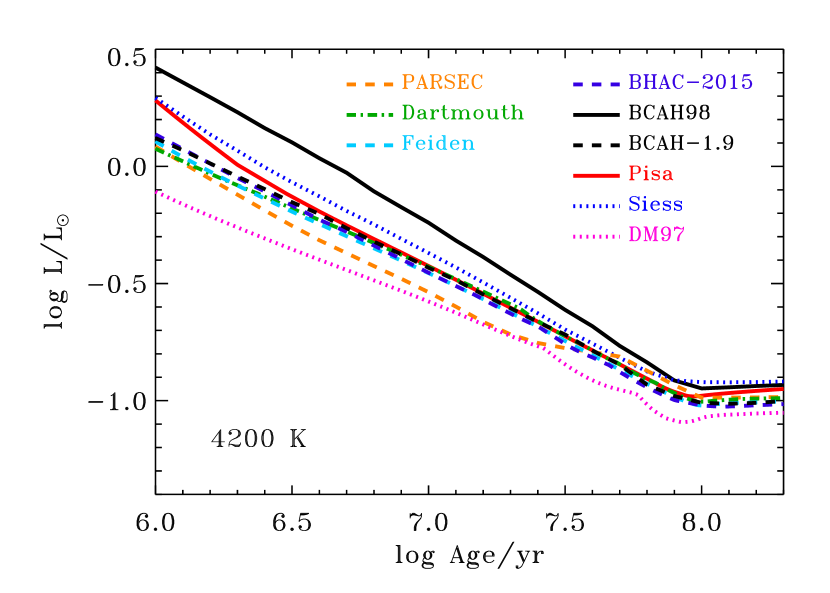
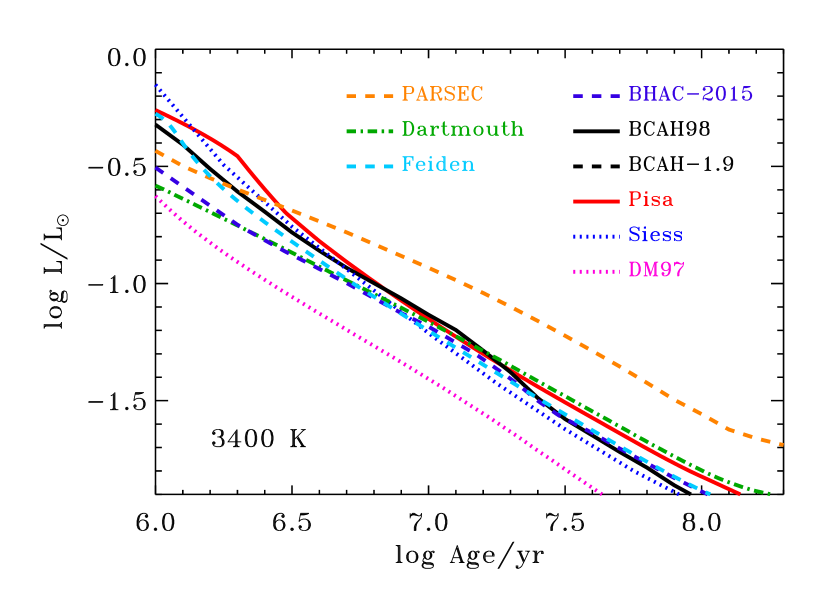
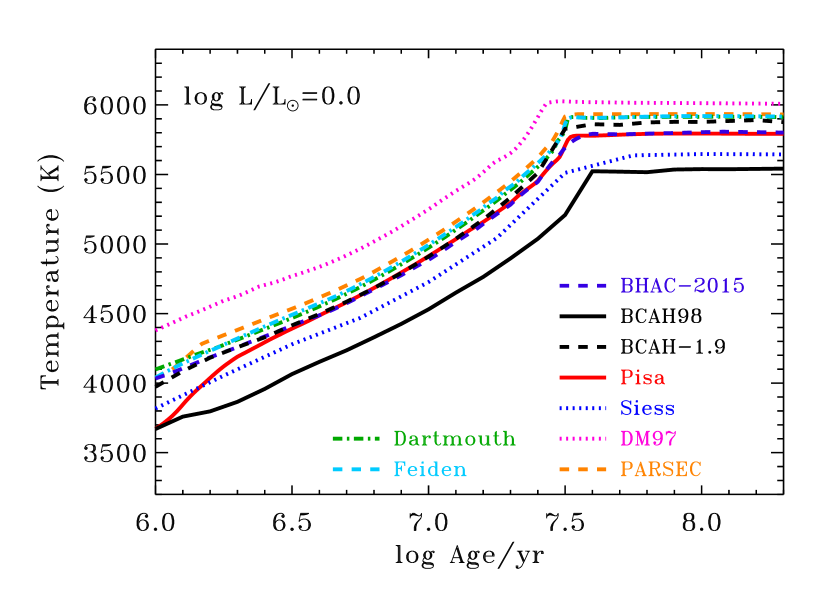
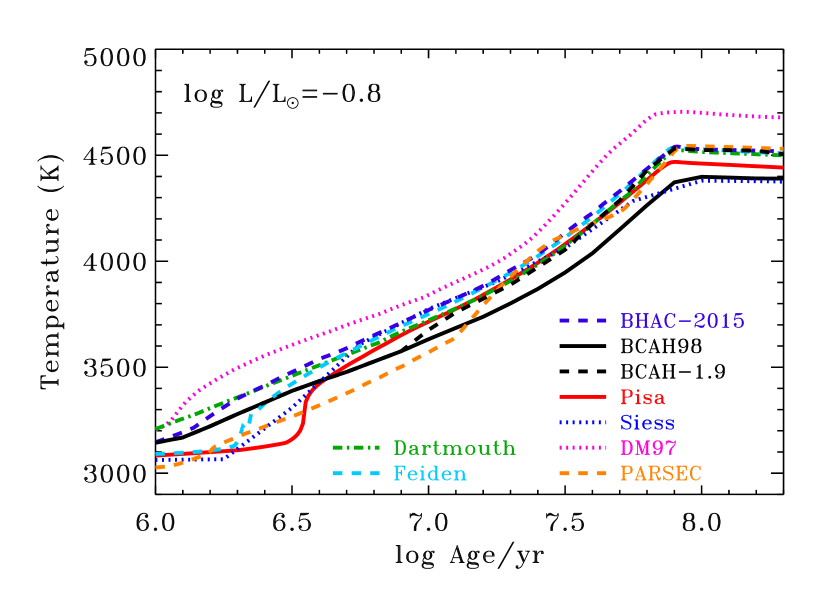
Figure 3 shows the conversion to age at fixed luminosity and at fixed temperature for the different pre-main sequence evolutionary models. The DM97 model tracks are significant outliers (see also, e.g. Hillenbrand, 1997; Bell et al., 2012; Andrews et al., 2013). Their photospheric temperatures are hotter for stars of the same mass, so the corresponding mass of K and M stars is much lower than obtained from other evolutionary tracks. The measured luminosity for a star of that mass is therefore high, leading to a young age. At ages Myr, the Dartmouth tracks also yield ages that are younger than the other tracks. In contrast, the BCAH98 tracks assessed for 4200 K stars are outliers in yielding older ages.
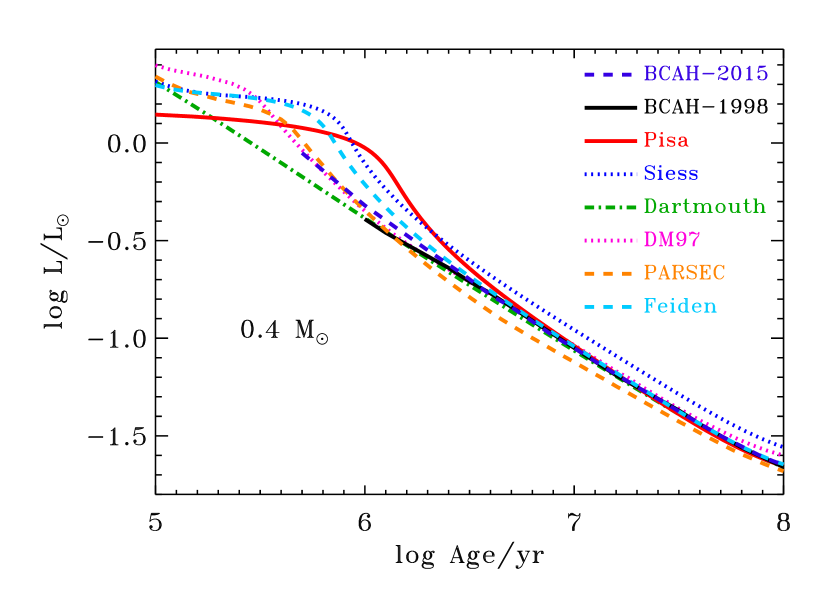
All models predict similar luminosities for stars of the same mass for ages older than 2 Myr, despite different temperatures (Fig. 5). With accurate age dating of young clusters, masses may be inferred from the luminosity alone and with consistent results between different model tracks.
3. EMPIRICAL ISOCHRONES FOR THE NEARBY YOUNG MOVING GROUPS
With an accurate theory of pre-main sequence evolution, the estimated luminosity of a star at a given estimated temperature could be directly converted to an age. However, scatter in and among young cluster members provokes concerns regarding the reliability of age estimates for single stars. Moreover, differences in the slope between observed and model isochrones lead to ages that depend on spectral type. Our approach here focuses on comparing the empirical stellar locus of different associations and interpreting the offsets as relative age differences. Using the stellar loci constructed for young associations, we first focus on empirical trends in versus (this section) before conducting detailed comparisons to models (§4).
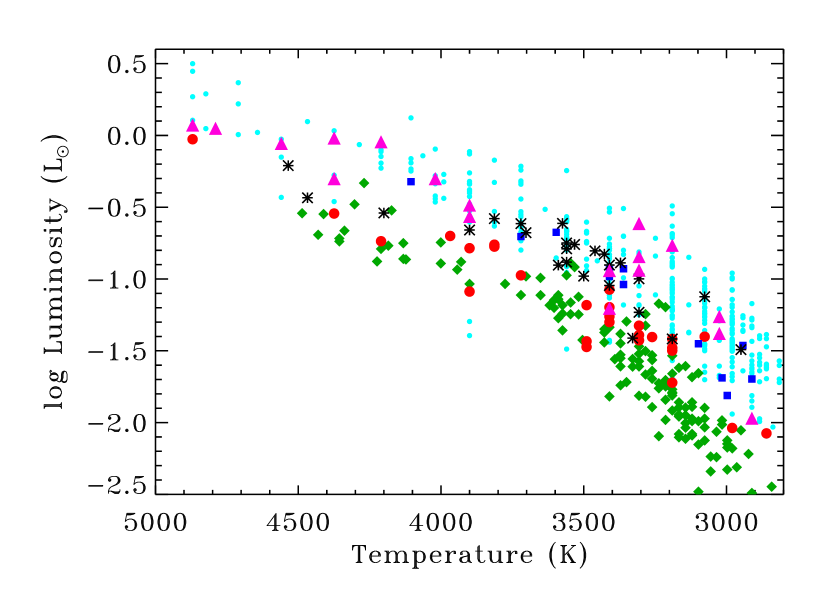
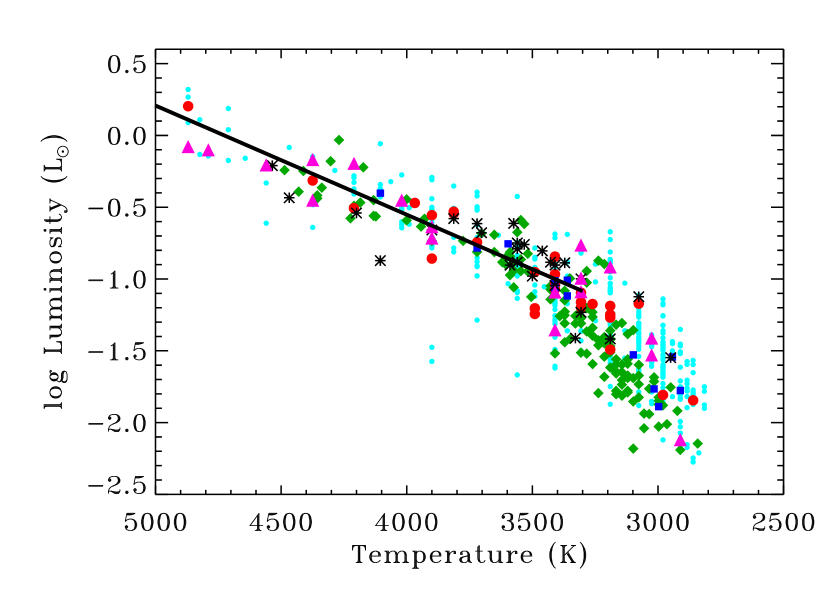
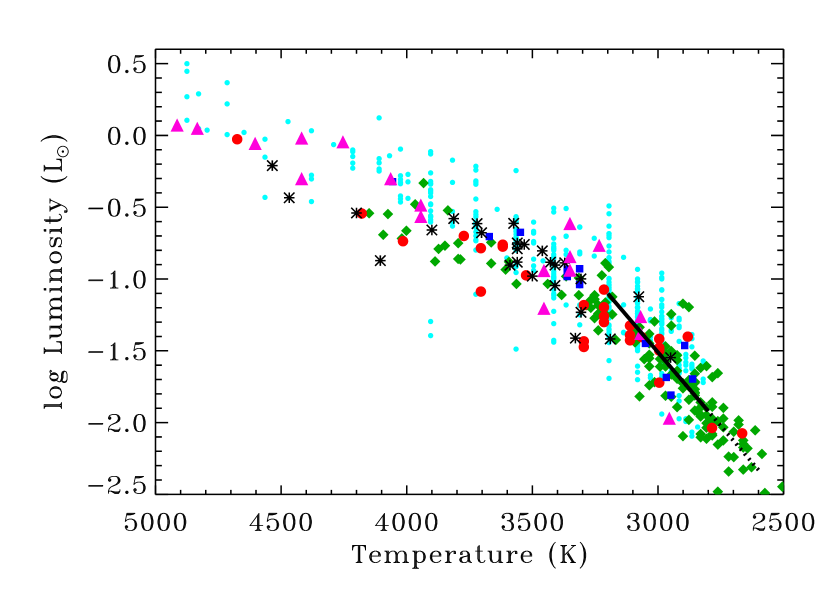
Figure 6 shows the combined HR diagrams for the five benchmark young associations. The stellar locus between 3500–5000 K has a similar shape for all clusters, with offsets in luminosity and temperature. Stars in the older associations have systematically fainter luminosities and warmer temperatures relative to young associations. The slope of the locus is steeper for very low mass stars and brown dwarfs7 ( K for the young clusters and K for older clusters) relative to the locus for solar mass stars. The location where the break in slope of the temperature-luminosity isochrone occurs is referred to here as the inflection point in the isochrone. 77footnotetext: These objects include very low mass stars and brown dwarfs and are termed brown dwarfs in this paper for ease of terminology. Object masses are not calculated in this paper, and the distinction between stars and brown dwarfs is not relevant at young ages.
The observed HR diagrams are consistent with the basic shape predicted from isochrones obtained from pre-main sequence evolutionary models (see comparisons in §4 and Fig. 11). The gradual decrease in luminosity from 5000 to K is roughly consistent with all pre-main sequence evolutionary models. At temperatures cooler than K, the steep dropoff in luminosity is also roughly consistent with predictions from tracks that calculate pre-main sequence evolution for stars . Based on the HR diagrams, the inflection point where the slope steepens occurs at K for the older two associations and K for younger associations. The temperature intervals are therefore different in fits to stellar and brown dwarf loci of the older and younger associations.
The similarity in stellar loci suggests that the members may be analyzed together after accounting for age-dependent differences between the clusters. In the following subsections, we combine the loci from different associations into a single stellar locus to calculate an empirical isochrone, which can then be generically applied to any young cluster. Combining data from different clusters yields results that are more robust than those calculated for individual, sparsely populated associations. When comparing cluster ages, scatter in data points and different spectral type distributions of members can introduce systematic errors in relative ages.
Once a generalized fit to temperature and luminosity is obtained, scaling the slopes to each cluster in the luminosity direction then provide self-consistent comparisons of relative ages that furthermore are robust to certain types of scatter in the temperature-luminosity data points. For example, linear fits to the TWA and Tuc-Hor populations yield median luminosities of and , respectively, for 4200 K stars, or and for 3400 K stars8. These luminosities can be compared among clusters to infer relative ages in as a fuction of . 88footnotetext: These luminosities differ from the final values listed in Table 4 because these values are calculated from best-fit slopes for the two clusters, while the final values are obtained from scaling a line with a slope that best fits all regions together.
The loci of stars above and below the inflection point (3200 K for young regions, 3400 K for the older regions) are discussed separately in §3.1 and §3.2. An underlying assumption to this approach is that the slopes of stellar loci are constant longward and shortward of the inflection point and that the slopes do not change with cluster age. These sections include a discussion of whether this simplifying assumption is correct. For brown dwarfs in particular, the slopes are different for well-populated loci of Upper Sco and Tuc-Hor. The location of the inflection point ranges from 3000–3500 K and is discussed in §3.3.
| 3200-5000 K | 2800-3200 K | ||||
| Empirical Fit | Slope | StD | Slope | StD | |
| Combined | 0.15 | 0.18 | |||
| Young Groups Onlya | 0.16 | 0.20 | |||
| Old Groups Onlyb | 0.14 | 0.18 | |||
| Tuc Hor | 0.14 | 0.18 | |||
| BPMG | 0.14 | 0.16 | |||
| TWA | 0.17 | d | |||
| Cha | 0.17 | d | |||
| Cha | 0.06 | d | |||
| Upper Sco | 0.18 | 0.27 | |||
| Model | Agec | 3400–5000 K | 2800–3200 K | ||
| BCAH98 | 3 | 1.04 | 1.97 | ||
| BCAH98 | 20 | 0.89 | 1.62 | ||
| BCAH98-1.9 | 3 | 0.69 | – | ||
| BCAH98-1.9 | 20 | 0.76 | – | ||
| BHAC-2015 | 3 | 0.68 | 1.49 | ||
| BHAC-2015 | 20 | 0.72 | 1.84 | ||
| Pisa | 3 | 0.71 | – | ||
| Pisa | 20 | 0.76 | – | ||
| Dartmouth | 3 | 0.73 | – | ||
| Dartmouth | 20 | 0.74 | – | ||
| Feiden | 3 | 0.75 | 1.57 | ||
| Feiden | 20 | 0.84 | 2.02 | ||
| Siess | 3 | 0.87 | – | ||
| Siess | 20 | 1.00 | – | ||
| DM97 | 3 | 0.70 | 2.46 | ||
| DM97 | 20 | 0.85 | 2.94 | ||
| PARSEC | 3 | 0.62 | 1.15 | ||
| PARSEC | 20 | 0.51 | 1.32 | ||
| PARSECv1.1 | 3 | 0.83 | – | ||
| PARSECv1.1 | 20 | 1.09 | – | ||
| Slope (in per 103 K), uncertainty, and standard deviation | |||||
| of fits to individual, combined, and model isochrones | |||||
| a Cha, Cha, and TW Hya Associations | |||||
| b Pic and Tuc Hor Moving Groups | |||||
| cAge of the model isochrone in Myr | |||||
| dInsufficient number of data points | |||||
3.1. Empirical Isochrones for low mass stars
In this subsection, we describe global fits to the 3200–5000 K region (3400–5000 K for the Pic and Tuc-Hor Moving Groups), which corresponds to M3–K0 spectral types. Since the empirical loci in this temperature range are similar, a global linear fit to the entire dataset provides a consistent assessment of the relative luminosity evolution of a given cluster. In fits to the combined HR diagram of the five benchmark associations, the free parameters are the slope of the line and a different y-intercept for each cluster. For illustrative purposes, the different y-intercepts are described here as luminosity offsets.
The lower left panel of Figure 6 shows the HR diagram, with each association shifted by the respective difference in y-intercept to match the location of the TWA. The empirical isochrone for the combined HR diagram of nearby associations has a best fit slope of
| (1) |
based on linear regressions that includes errors in and (as described in §2.3) and calculated using mpfitexy.pro in IDL (Williams et al., 2010). The inflection point used for the fits here is 3200 K for the younger groups and 3400 K for the older groups. The 0.07 dex uncertainty includes a 0.05 dex statistical uncertainty and a dex uncertainty based on different linear fitting techniques, how the data points are weighted, and the inclusion or exclusion of deviant data points. This uncertainty does not include possible errors in the spectral type-temperature conversion or in bolometric corrections, which may depend on spectral type. The standard deviation in luminosity between the observations and best linear fits is dex.
The same analysis calculated from the Pecaut & Mamajek (2013) spectral type-temperature conversion and bolometric corrections produces a slope of per 103 K, which is formally consistent with the results when using the Herczeg & Hillenbrand (2014) conversions. The different slopes would yield a change in of dex between the hottest and coolest stars in the applicable temperature range, which is smaller than other systematic errors.
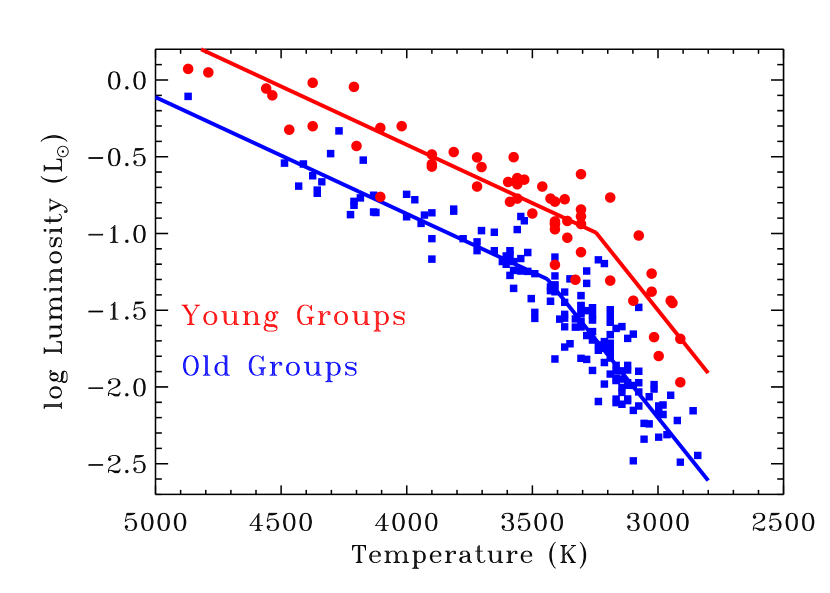
Table 3 lists the best fit slopes for linear fits to the the combined data set, to individual clusters, and to the clusters combined into the young and old groups. When shifted based on the best fit offsets, the three youngest benchmark associations have steeper slopes than the older clusters, which suggests some evolution with age. The difference in slopes between the young and old clusters, 0.76 and 0.85 per 103 K, may lead to systematic differences as large as 0.14 dex for stars at 3400 K compared with 5000 K.
3.2. Empirical Isochrones for Young Brown Dwarfs
In this subsection, we describe global fits to objects cooler than the inflection point in the isochrones (2800–3400 K for the Tuc-Hor and Pic Moving Groups, 2800–3200 K for the TW Hya, Cha, and Cha Associations). For illustrative purposes, the different y-intercepts are visualized as temperature offsets so that the loci overlap (lower right panel of Fig. 6). This visualization is practical because the inflection point occurs at different temperatures but approximately the same luminosity (to within a few tenths of dex; see also similar behavior in the model isochrones in Figs. 4 and 11).
The total combined fit to our benchmark clusters yields a slope of
| (2) |
where the temperature range goes from 2800–3200 K for the younger clusters and 2800–3400 K for the older clusters (as also described above with ). The error in the slope is calculated as in §3.1. The fits are dominated by members of the Tuc Hor and Pic Moving Groups because those regions have more identified brown dwarf members. Fits are calculated for the combined locus of young associations but are not calculated for each individually because each association has only a few data points. Table 3 lists slopes for the individual regions and the combined HR diagram.
The coolest known objects in these regions ( K) are fainter than expected from these linear fits. They are excluded in this analysis, but their inclusion would significantly steepen the slopes of this lines. This discrepancy suggests that these fits may not be robust to the selection of the low temperature cutoff for this fit.
The measured uncertainty in the linear fit of 0.15 per K leads to a 0.06 dex uncertainty in relative luminosity between a 3200 K and 2800 K brown dwarf. The difference in slopes between the older and younger associations likely leads to 0.09 dex uncertainties over the same regions. This difference is likely real evolution in the brown dwarf loci and not related to uncertainty in the fits. In §3.4, comparisons to the Upper Sco OB Association demonstrate that the slope becomes shallower with age. The results from linear fits in producing a luminosity for a 3000 K brown dwarf may still be robust as long as the known membership is well distributed between 2800–3200 K. However, this relationship should only be used with caution.
The fit to the brown dwarf locus is not recalculated for Pecaut & Mamajek (2013) parameters because their bolometric corrections are not calculated for spectral types later than M5.
3.3. Combined Isochrones between 2800–5000 K
Subsections §3.1 and 3.2 describe empirical fits to HR diagrams, as illustrated in Figure 6. The regions warmer and cooler than the inflection point in the temperature-luminosity locus were fit separately, with one slope but different y-intercepts for each association. The shifts obtained from the y-intercepts are visualized as luminosity shifts, while the fits to the cooler stars are visualized as temperature shifts.
The location of the inflection point, which motivates the separate fits to the two temperature ranges, depends on the cluster age. In this subsection, we compare the independent results from the fits to low mass star and brown dwarf isochrones to describe how the empirical lines combine to describe the low mass locus of young clusters. For illustrative purposes only, the combined isochrones are plotted against the young and old associations in Figure 7.
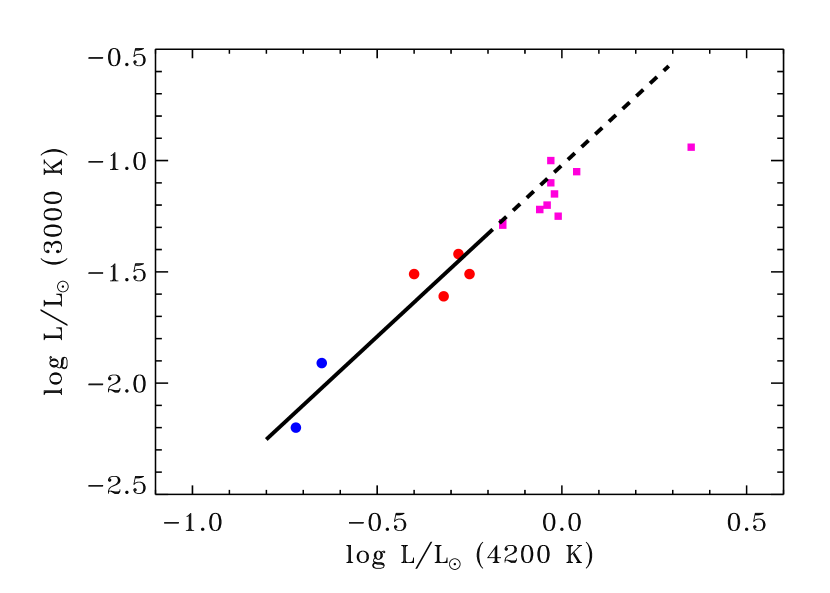
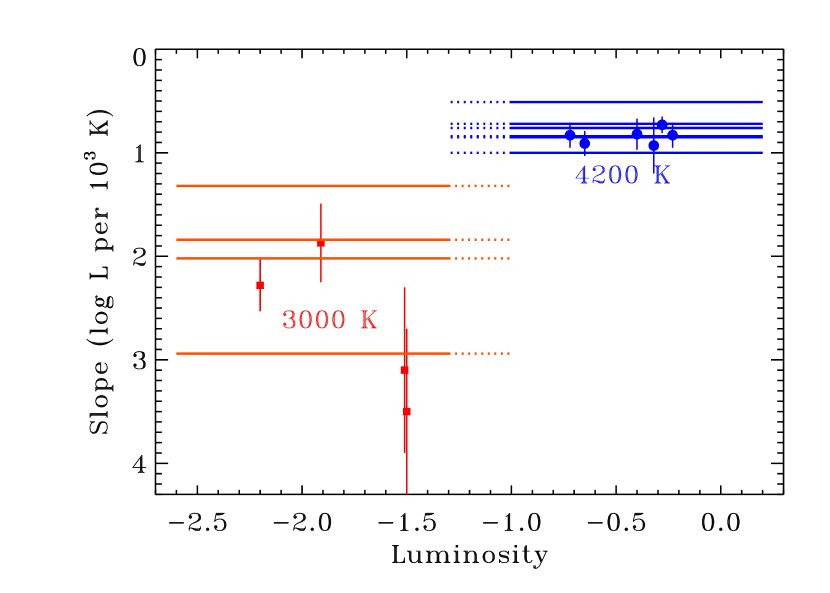
Figure 8 shows the luminosity of 3000 K brown dwarfs versus 4200 K stars from our independent fits to the young clusters with a best fit line of
| (3) |
Combining the line of equation 3 with the two slopes reported in equations 1 and 2 fully describes the evolution of the empirical locus of single low mass stars and brown dwarfs in clusters. The isochrone for low mass stars falls in luminosity more quickly than that for brown dwarfs. The inflection point where the temperature-luminosity slope changes is determined by the intersection of the stellar and brown dwarf locus described by this line.
As a further test of our method, Figure 8 also shows preliminary results of its application to younger clusters with proportionally higher luminosities. The data are obtained for IC 348, Chameleon I, Lupus I, Taurus, Ori, Ori, and the ONC (Luhman et al., 2003; Luhman, 2007; Luhman et al., 2010; Rebull et al., 2010; Rigliaco et al., 2011; Bayo et al., 2011; da Rio et al., 2012). Although the errors in placement of individual stars on the HR diagram are larger for younger stars with more influence from disks and heavier extinction, their mean luminosities are encouragement that our method could be applied to younger regions in order to constrain the luminosity evolution for comparison to theoretical models.
3.4. Application to the Upper Sco OB Association
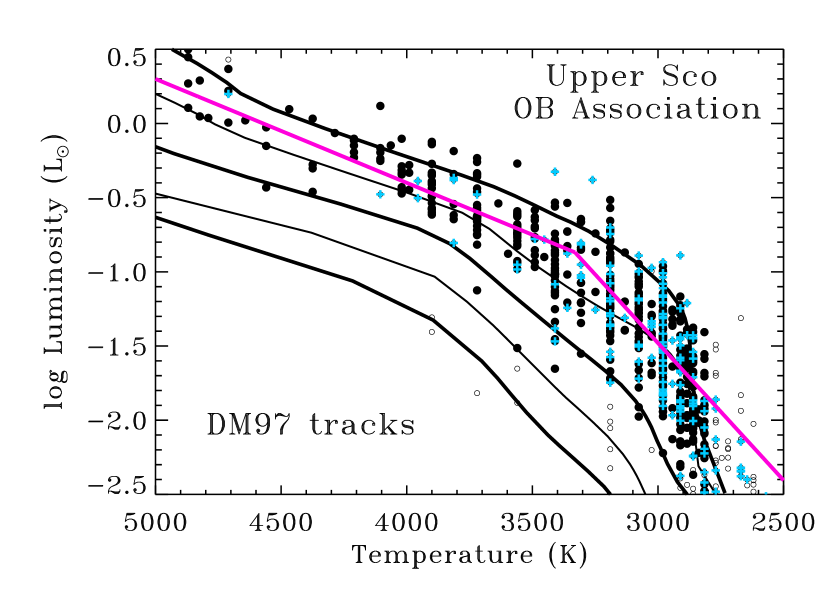
Figure 9 shows how the fits derived above are applied to the HR diagram of the Upper Sco OB Association. Lines with slopes that best fit the loci of low mass stars (3200–5000 K) and brown dwarf/very low mass stars (2800–3200 K) are scaled to the measured isochrone.
The initial sample includes stars with K-W3 color consistent with diskless stars and also stars without WISE detections. An initial scaling to the 3200–5000 K region (186 stars) has with a standard deviation of 0.26 dex, much larger than that obtained for the other clusters. Several stars are severe outliers, defined here as 0.5 dex from the calculated in the initial fit. Our adopted fit of 176 stars excludes these severe outliers. We calculate with a luminosity scatter of 0.18 dex. Fitting stars from 3400–5000 K yields the same . This luminosity spread of 0.18 dex is slightly larger than that calculated for the other associations, with extra scatter that may be caused by a real age spread in the cluster or, as suggested by Slesnick et al. (2008), a pc depth of the region.
The brown dwarf locus of Upper Sco at 2800–3200 K has a much steeper slope than the linear fit to the 5–40 Myr old sample, which points to problems in our simplifying assumption that the slope of the 2800–3200 K object locus does not evolve on these timescales. The fit to the slope of combined loci of the five benchmark clusters is dominated by Tuc-Hor members. However, the slopes from the younger associations are steeper than for the older associations. These differences suggest that the empirical brown dwarf locus is better described by a swinging gate rather than a single slope. This same swinging gate behavior is also suggested by the theoretical isochrones covering this low temperature regime (Figure 9), where the predicted slopes appear to flatten with increasing age. In particular, the brown dwarf loci is remarkably well described by the DM97 isochrones and is also consistent with the BHAC-15 isochrones.
While a more in-depth analysis is beyond the scope of the simple-minded spirit of this paper, these problems with the brown dwarf isochrones lead us to focus subsequent analysis of the correspondence between stellar mean stellar luminosities and stellar ages on the 3200–5000 K stellar locus.

3.5. Ordering Clusters by Luminosity
In this section, we apply the analytical approximations of isochrones from §3.1–3.2 to the set of young clusters to order them in luminosity, as a proxy for age. The fits to luminosities for 3200–5000 K stars (§3.1) are likely more accurate than for the 2800–3200 K brown dwarfs (§3.2) because an analysis of the brown dwarf locus relies heavily on the two older moving groups and may not accurately describe the brown dwarf locus of younger clusters.
| Stellar | Low mass starsa | Brown Dwarfsb | |||||
| Ass’n | dc | N | StD | N | StD | ||
| Upper Sco | 145 | 176 | -0.25 | 0.18 | 286 | -1.51 | 0.27 |
| Cha | 111 | 14 | -0.28 | 0.17 | 4 | -1.42 | 0.23 |
| Cha | 94 | 7 | -0.32 | 0.06 | 5 | -1.61 | 0.16 |
| TW Hya | (57) | 22 | -0.40 | 0.17 | 3 | -1.51 | 0.22 |
| Pic | (30) | 16 | -0.65 | 0.14 | 11 | -1.91 | 0.15 |
| Tuc Hor | (51) | 48 | -0.72 | 0.14 | 89 | -2.20 | 0.18 |
| aFrom linear fits to 3200/3400–5000 K stars, see §3.1 | |||||||
| bFrom temperture shifts for stars of 2800–3200 K, see §3.2 | |||||||
| cDistances in () are median association distances | |||||||
Table 4 shows the ordering of clusters by luminosity for the 3200–5000 K fits. The five benchmark associations are ordered in luminosity as expected from previous studies (e.g., see discussions in Mamajek 2008; Hillenbrand 2009; Kraus et al. 2011 and Fang et al. 2013). The Upper Sco, Cha and Cha Associations are the youngest, followed by the TW Hya Association, the Pic Moving Group, and the Tuc-Hor Moving Group. Use of Pecaut & Mamajek (2013) temperatures and bolometric corrections would increase association by 0.02-0.03 dex.
The formal uncertainties in the luminosity (age) ordering are calculated from a combination of (1) the standard deviation divided by the square root of the number of stars in the sample, and (2) systematic uncertainty in distances. Methodological differences in luminosity calculations and in the census of multiplicity also can affect the luminosity ordering of clusters. For the specific benchmark clusters analyzed here, the age ordering is secure, with the possible exception of the Cha Association. To swap the TWA and Cha Associations would require a systematic change in by 0.08 dex (20%). For young clusters, the primary culprits to explain such a luminosity change of 0.1 dex would be systematic errors in the distance (12% change), extinction (change of mag), and spectral type (change of 140 K). Weinberger et al. (2013) argue that TWA 9A and 9B should be excluded from the TWA census because they are much fainter than expected, which would increase the cluster luminosity by 0.04 dex. These comparisons are also affected by differences in binary accounting and by accretion, if samples include disk sources.
4. Comparing Empirical and Model Isochrones
The relationship between stellar luminosity and effective temperature has been measured for six young associations. Because these stars are contracting pre-main sequence stars, the radius and therefore luminosity decreases with time. The luminosity of stars at a fixed temperature is therefore used in §3.5 as a proxy for age. The conversion from luminosity to age depends on the adopted choice among the many evolutionary models, as shown in Fig. 3, and on the stellar temperature. At a fixed temperature, the age estimates differ between the many evolutionary models. Mismatches between empirical and model isochronal slopes lead to different age estimates along an empirical isochrone when a given model family is applied to stars with different temperatures.
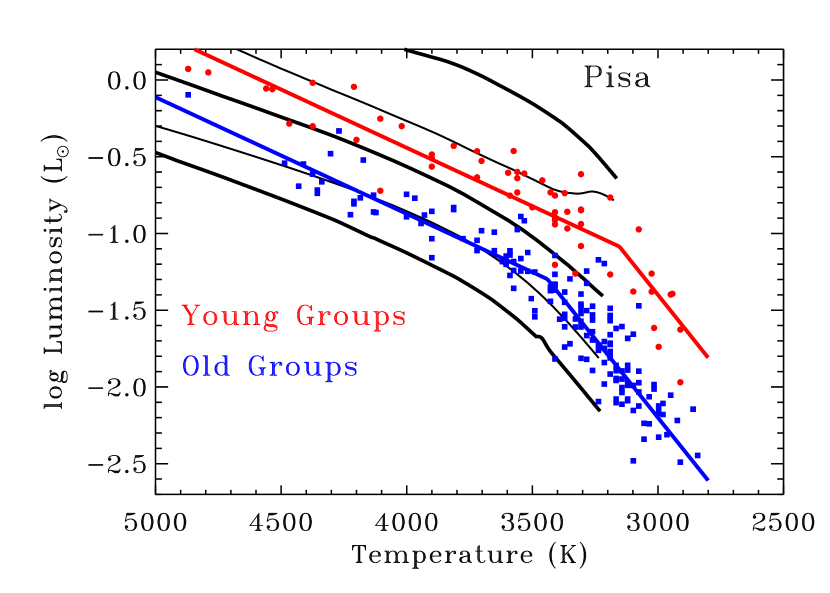


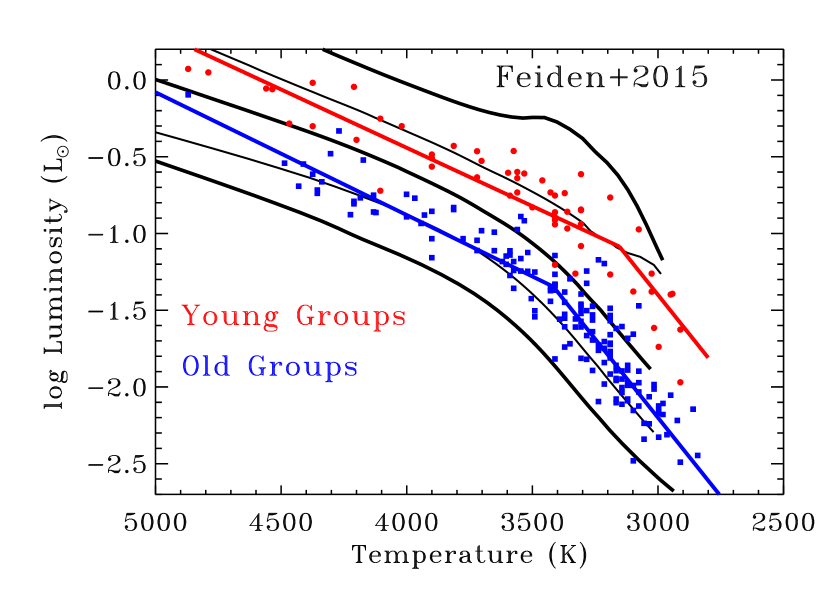


Figures 10-11 and Table 3 compare the empirical isochrones to the pre-main sequence models discussed in this paper. The model isochrones are curved but can be well approximated with a two temperature fit within the 2800–5000 K region. The slopes presented in Table 3 are intended as a guide, with a measured slope that is sensitive to the temperature region defined in the fit. For low mass stars (3200–5000 K), the luminosity slopes in the Dartmouth, Pisa, BCAH98-1.9, BHAC-2015, and Feiden pre-main sequence tracks are consistent with the observations. These models produce similar ages for stars at 3800 and 4200 K. On the other hand, the isochronal slopes predicted from the DM97, Siess, BCAH98, and PARSEC models differ from empirical slopes. This discrepancy leads to differences in expected luminosities versus spectral type. The DM97, Siess, and BCAH98 models all have a steeper slope than is observed, which leads to a temperature (mass) dependence in age estimates. As an example, if we normalize our empirical isochrone and the BCAH98 isochrone to a young 4200 K star, a co-eval star of 3400 K would appear dex more luminous ( dex younger in age) than expected from the BCAH98 isochrone. The PARSEC isochrones conversely have a shallower slope than is observed, which leads to 3400 K stars appearing older than 4200 K stars.
The new BHAC-2015 and Feiden models have isochrones that are similar to the empirical isochrones. The inflection point in both BHAC-2015 and Feiden occurs at temperatures K hotter than in the empirical isochrones, which leads to mismatches between empirical and model isochrones for very low mass stars and brown dwarfs. These two models predict isochrones that are close enough to empirical isochrones that the differences could be explained if effective temperatures below 3500 K are systematically underestimated by 50-100 K.
| Stellar | DM97 | Pisa | BCAH98 | Feiden | BHAC-2015 | Li Depl.b | ||
| Association | d (pc) | 3400 K | 4200 K | 4200 K | 3800 K | 3800 K | Age | |
| Upper Sco | – | |||||||
| Cha | – | |||||||
| Cha | – | |||||||
| TWA | (57) | – | ||||||
| BPMG | (30) | |||||||
| Tuc Hor | (51) | |||||||
| aFor models that produce a younger, intermediate, and old age, plus the recent BHAC-2015 and Feiden models. | ||||||||
| Age assessed at the listed temperature because of temperature dependence in age estimates. | ||||||||
| bLi depletion boundary ages, see text for details. | ||||||||
| cEstimated uncertainty in median cluster distances. | ||||||||
Given these mismatches between model and observed isochrones, even for the latest models for cool temperatures, comparisons between clusters should be made at a constant temperature. Age estimates for each model are evaluated at 3400, 3800, and 4200 K and are plotted in Fig. 12 for three of the benchmark associations and for the Upper Sco OB Association. Because of the discrepancies in slope described above, for most models the 3400 K stars are 0.2–0.5 dex younger than 3800 K and 4200 K stars. The PARSEC models have the reverse dependence, with the 3400 K stars older than the 4200 K stars.
The brown dwarf ages are not plotted. For the now-outdated BCAH98 models, ages of 3000 K stars are another 0.3 dex younger than the 3400 K stars. On the other hand, for PARSEC models ages of 3000 K stars are typically 0.1-0.3 dex older than 3400 K stars. However, the differences between the brown dwarf loci of Upper Sco OB Association and the Tuc Hor Moving Group demonstrates that the shape and slope of the brown dwarf isochrone evolves with time. Fitting a single slope to the brown dwarf isochrones without respect to age is an overly simplistic approach to characterizing the location of brown dwarfs in the HR diagram. The DM97 models reproduce the evolution in the brown dwarf isochones especially well, however the absolute ages are anomalously young.
5. DISCUSSION
Converting the luminosity proxy into a consistent and accurate tool for age measurements requires solving two problems: (1) establishing whether the ages inferred from luminosities are consistent across a temperature range, and (2) comparing the model-dependent age estimates with independent age estimates to establish an absolute and correct age scale.
The empirical isochrone fits presented here lead to a self-consistent luminosity ordering for nearby young associations. Absolute ages are then estimated from comparisons to isochrones for model tracks, but these comparisons lead to a wide range of age estimates for different model tracks and within the same models for stars of different temperatures. If uncorrected, these discrepancies lead to significant spectral type (mass) dependences in ages of young stars.
The temperature dependency of the inferred ages arises from the mismatch between empirical and theoretical slopes in vs temperature. The source for this mismatch may be the evolutionary models, although spectral type/temperature mismatches between different methodologies and uncertainties in the spectral type/temperature conversion also likely contribute to these discrepancies. The BHAC-2015 models improved the prescription for convection, while the Feiden models improve upon the thermal structure in the atmosphere. Both the BHAC-2015 and Feiden models significantly improve the match between predicted and observed stellar loci. Alternately, the PARSEC models apply an ad hoc change to the T- relationship to fit the color constraints of old clusters, and similar tweaks may be able to reproduce loci of low mass young stars.
Ultimately, despite recent advances, some model improvements are still necessary so that the evolution of radius and temperature better reflects the observational constraints of young stellar associations. Missing physics in the evolutionary models, including magnetic fields and spots, may lead to mass dependent discrepancies or absolute errors in age dating young clusters. Age comparisons between clusters are self-consistent only when compared over specific temperature ranges where the model and empirical isochrones match. The BHAC-2015 and Feiden models currently offer the best set of pre-main sequence tracks for relative age estimates, although mismatches at K still lead to temperature-dependent ages. The empirical isochrones derived in this paper offer a method to place stars of different temperatures on the same age scale, albeit with some uncertainty introduced by the possible temporal evolution of the isochronal slopes.
Table 5 lists sets of ages for each cluster based on a consistent application of a single model family at a single stellar temperature. The ages are selected from models that produce young, intermediate, and old ages relative to the average model. Uncertainties in these ages are calculated from the statistical uncertainties in the fits, as listed in Table 49, and an estimate for the systematic uncertainty in the median distance of the Cha, Cha, and Upper Sco OB Associations. 99footnotetext: The luminosity errors in dex are asymmetric in linear space. The listed errors are the median error in Myr.
The reasonableness of these isochronal ages are testable by comparison to Li depletion boundary ages10. The Tuc-Hor Moving Group has a Li depletion boundary age of Myr from the BCAH98 evolutionary models and Myr from the DM97 models (Kraus et al., 2014), so we adopt Myr. The Pic Moving Group has Li depletion boundary ages of Myr from (Binks & Jeffries, 2014) and Myr from the Feiden models (Malo et al., 2014a). We adopt an Li depletion boundary age of Myr for the Pic Moving Group. 1010footnotetext: The Li depletion boundary ages may be systematically overestimated by a few Myr if the radius dispersion within a cluster decreases the timescales for Li depletion (Somers & Pinsonneault, 2014). On the other hand, inclusion of magnetic spots may lead to 30% and 20% underestimates of the ages of the Pic and Tuc-Hor Moving Groups, respectively (Jackson & Jeffries, 2014).
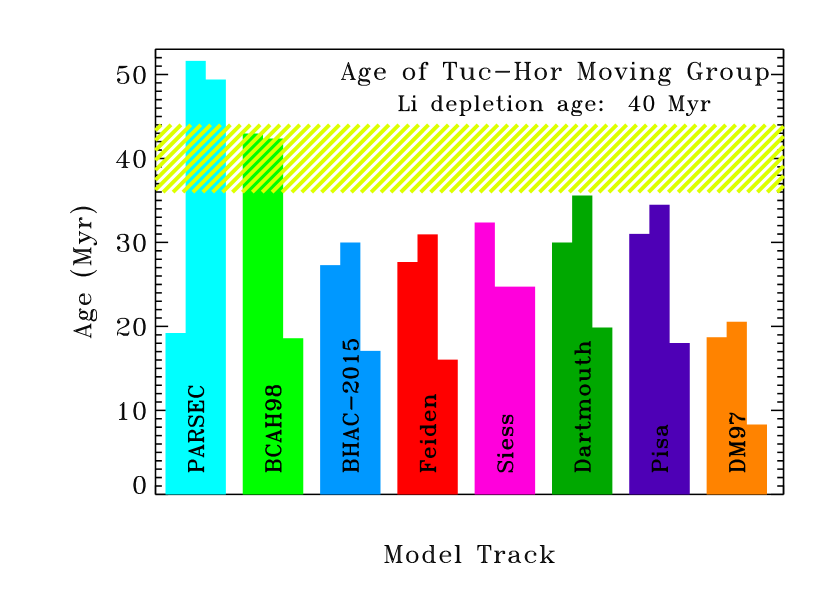
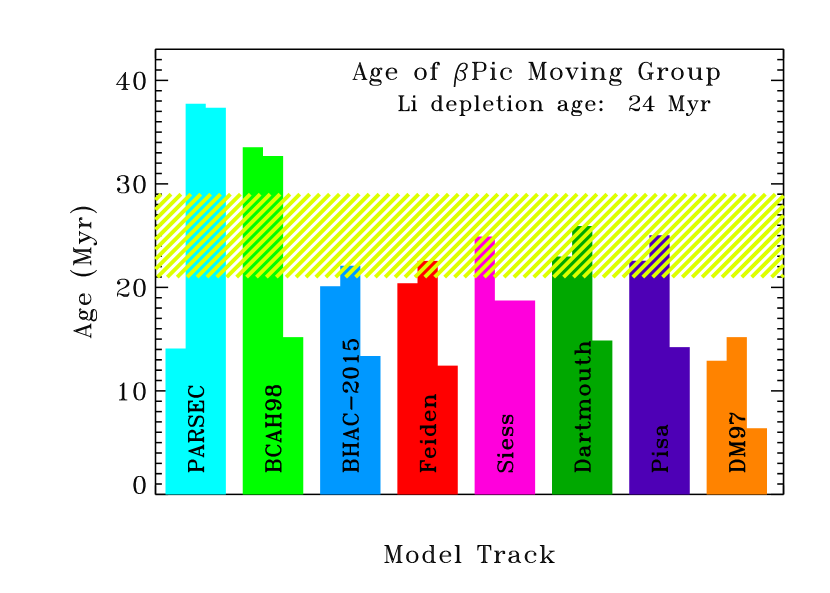
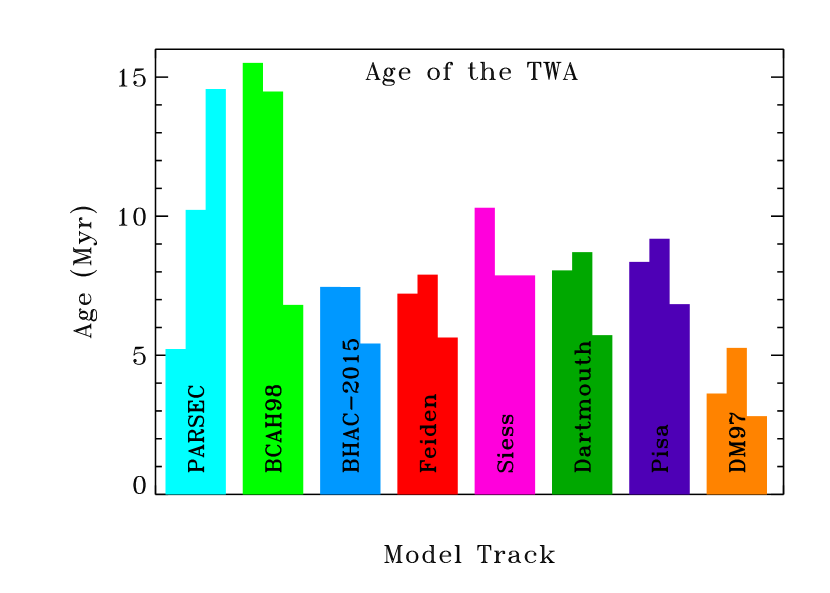
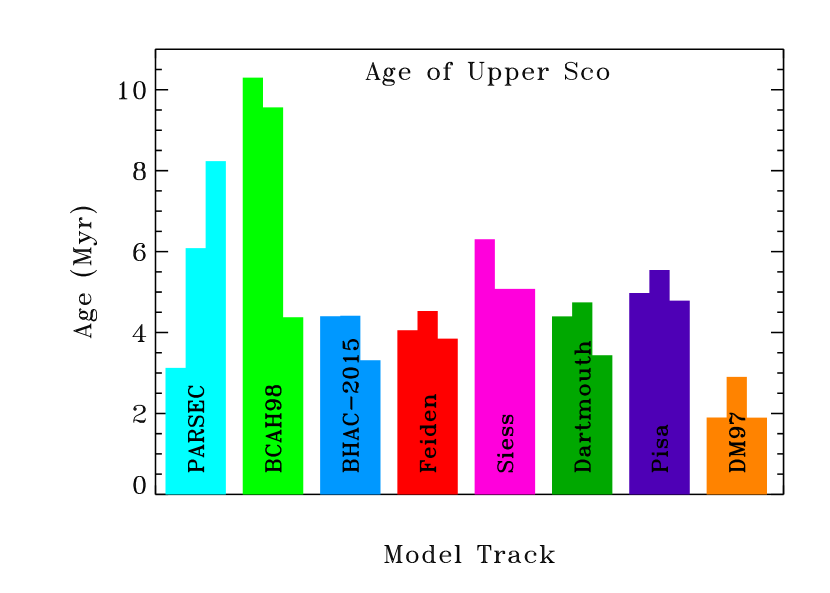
Figure 12 and Table 5 compares the Li depletion boundary ages to the isochronal ages estimated here from the different model tracks. No single model of low mass stars reproduces the Li depletion boundary age for both the Tuc-Hor and Pic Moving Groups. Most models underpredict the age of the Tuc-Hor Moving Group by Myr (or 0.1 dex). On the other hand, most models reproduce the age of the Pic Moving Group. The DM97 models yield especially young ages, likely because the isochrones of low-mass stars have temperatures that are initially too high (see description in §2.5). Both the Feiden and BHAC-2015 models have similar isochrones that yield remarkably similar ages.
When applied consistently, the Li depletion boundary ages for the Pic Moving Group implies a Myr old age for low mass stars in the Upper Sco OB Association, younger than the 11 Myr age measured from intermediate and high mass stars by Pecaut et al. (2012). The 11 Myr age of Upper Sco would require ages of and 55 Myr for the Pic and Tuc-Hor Moving Groups. Either the intermediate mass or low mass age (based on Li depletion boundary ages of older associations) of the Upper Sco OB Association is incorrect, or the identification and evaluation of the low mass and/or higher mass stars is biased in some way.
Errors in ages may be caused by either errors in the birthline or in the contraction rates. A bulk subtraction of 5 Myr to intermediate mass isochrones would shift the intermediate mass isochrones sufficiently for Upper Sco and would not cause any significant discrepancy with the Li depletion age of the Pic Moving Group. The age estimate for the Pic Moving Group from late F and G stars (Mamajek & Bell, 2014) would also not change significantly because these stars are preferentially lower mass than the intermediate/high mass stars that led to the old age estimate for the Upper Sco OB Association. An addition of 5 Myr to low-mass isochrones would also lead to consistent ages, but would encounter severe problems by forcing the youngest known clusters to have ages of 5 Myr. Alternately, the contraction rates for either low-mass or intermediate mass stars may be in error. For low mass stars, the inclusion of magnetic fields and spots in evolutionary models will affect contraction rates. For intermediate and high mass stars, the inclusion of rotation leads to older ages for intermediate and high-mass stars.
Observational errors relative to the benchmark associations may also lead to an underestimate of the age. A bulk increase in temperatures by 250 K would lead to an age of 10 Myr, but such a large systematic difference in spectral typing is unlikely. Alternately, the luminosities could be overestimated by 0.2 dex if the distances are biased and overestimated by 25%. Assuming mag, which disagrees with the colors of Upper Sco stars, would lead to only a 0.07 dex increase in the luminosities.
6. Conclusions
In this paper, we calculate empirical isochrones in HR diagrams for low mass stars and brown dwarfs in young ( Myr) nearby associations. The sample consists of stars that have accurate distances, low extinction, and are not affected by the presence of disks or accretion. The simple formulation of the empirical isochrone assumes that two slopes, one applied to stars with temperatures 3200/3400–5000 K and one for stars between 2800–3200/3400 K, applies to the stellar locus of all young associations. This choice leads to reasonable fits to the five young benchmark clusters and to the stellar and brown dwarf locus of the Upper Sco OB Association.
A successful theory of pre-main sequence evolution should match these empirical fits. The Dartmouth, Pisa, and BCAH98-1.9 pre-main sequence isochrones between 3200–5500 are consistent with the measured slopes. The slopes from DM97, BCAH98, and Siess isochrones are steeper than observed, so that very low mass stars will be assessed as younger than solar mass stars. The PARSEC isochrones have the opposite behavior, so that solar mass stars are assessed as younger than very low-mass stars. The PARSEC and BCAH98 models typically lead to the oldest ages, while the ages obtained from the DM97 models are anomalously young. Advances in prescriptions for convection and the thermal structure of the atmosphere in the BHAC-2015 and Feiden models, respectively, have improved the match to empirical stellar loci at K and match the decrease in luminosity at K, though with a temperature offset relative to established spectral type-temperature conversions.
Applying the empirical isochrone to associations provides a statistically robust age ordering, which is independent of spectral type. Our age ordering is based on the 3200–5000 K region. The assumption that the 2800–3200 K isochrones have the same slope for both the young and old associations is likely overly simplistic. Steeper slopes at younger ages, especially for the Upper Sco OB Association, instead indicates some evolution in the brown dwarf locus. Because the relationship between luminosity and temperature for brown dwarfs is steep, any use of brown dwarfs in age estimates requires accurate temperatures and should be used with caution.
Fitting these isochrones to the six associations discussed in this paper leads to a luminosity/age ordering mostly as expected from previous results, with the Upper Sco (, Cha (), and Cha (), Associations roughly co-eval, followed by the TW Hya Association () and the Pic ( and Tuc-Hor () Moving Groups. For any given association, age estimates of different models evaluated at different temperatures span 0.8 dex. As a consequence, comparisons of ages between different associations should consistently apply a single luminosity-age scaling. The BHAC-2015 and Feiden pre-main sequence models yield very similar ages for low-mass stars. Ages can be adopted to be consistent with the Li depletion boundary age of the Pic Moving Group, but these models imply a Myr age for the Upper Sco OB assocation for low mass stars, younger than the 11 Myr age obtained from intermediate mass and high mass stars stars.
7. Appendix A: Target photometry and bolometric corrections
In §2.2–2.3, we describe the collection and use of photometry to identify disk sources, to tweak bolometric corrections calculated from models, and to measure extinctions for members of the Upper Sco OB Association. This appendix describes how the photometry is implemented in this paper.
Filter curves and zero points are obtained from the Virtual Observatory Filter Profile Service11. The BT-Settl models were convolved with the filter transmission profiles in photon space, which may lead to minor offsets relative to integrations in energy space (Cohen, 2003). The number of counts is then converted into a magnitude from the filter zero point function. Synthetic photometry is then calculated from the zero-point flux for the filter and the central wavelength of the filter. The listed central wavelengths are the average wavelength of the filter, calculated by integrating the transmission over the filter bandpass in wavelength space. 1111footnotetext: http://voservices.net/filter/
Figure 13 shows temperature-color plots that compare the observed photometry to synthetic photometry from the BT-Settl models and, when possible, to photometry of Pecaut & Mamajek (2013). In cases where the observed and synthetic colors (always relative to J) are mismatched, the model fluxes at the corresponding wavelength are corrected to reproduce the observed colors. The J-band flux is always kept constant, so all corrections are relative to the J-band. The bolometric corrections are then calculated from the synthetic J-band photometry and the integrated emission in the full model spectrum.
Finally, the absolute bolometric magnitude is calculated from the distance-corrected J-band magnitude, , and the bolometric correction, BC, . The zero point for ( erg cm-2 s-1) and the assumed erg cm-2 s-1 are obtained from the 1999 IAU Zero Point Scale, as discussed at the webpage of Eric Mamajek listing Basic Astronomical Data for the Sun12. 1212footnotetext: https://sites.google.com/site/mamajeksstarnotes/basic-astronomical-data-for-the-sun
References
- Alcala et al. (2014) Alcala, J.N., Natta, A., Manara, C.F., et al. 2014, A&A, 561, 2
- Allard et al. (2012) Allard, F., Homeier, D., & Freytag, B. 2012, Royal Society of London Philosophical Transactions Series A, 370, 2765
- Andrews et al. (2013) Andrews, S.M., Rosenfeld, K.A., Kraus, A.L, & Wilner, D.J. 2013, ApJ, 771, 129
- Asplund et al. (2009) Asplund, M., Grevesse, N., Saucal, A.J., & Scott, P. 2009, ARAA, 47, 481
- Baraffe et al. (1998) Baraffe, I., Chabrier, G., Allard, F., & Hauschlidt, P.H. 1998, A&A, 337, 403
- Baraffe et al. (2003) Baraffe, I., Chabrier, G., Barman, T.S., Allard, F., & Hauschildt, P.H. 2003, A&A, 402, 701
- Baraffe et al. (2009) Baraffe, I., Chabrier, G., & Gallardo, J. 2009, ApJ, 702, L27
- Baraffe et al. (2015) Baraffe, I., Hormeier, D., Allard, F., & Chabrier, G., ApJ, accepted
- Bayo et al. (2011) Bayo, A., Barrado, D., Stauffer, J., et al. 2011, A&A, 536, 63
- Bell et al. (2012) Bell, C.P.M., Naylor, T., Mayne, N.J., Jeffries, R.D., & Littlefair, S.P. 2012, MNRAS, 424, 3178
- Bell et al. (2013) Bell, C.P.M., Naylor, T., Mayne, N.J., Jeffries, R.D., & Littlefair, S.P. 2013, MNRAS, MNRAS, 434, 806
- Bell et al. (2014) Bell, C.P.M., Rees, J.M., Naylor, T., et al. 2014, MNRAS, 445, 3496
- Bianchi et al. (2011) Bianchi, L., Herald, J., Efremova, B., et al. 2011, Ap&SS, 335, 161
- Biller et al. (2011) Biller, B., Allers, K., Liu, M., Close, L.M., & Dupuy, T. 2011, ApJ, 730, 39
- Binks & Jeffries (2014) Binks, A.S., & Jeffries, R.D 2014, MNRAS, 438, L11
- Brandeker et al. (2006) Brandeker, A., Jayawardhana, R., Khavari, P., Haisch, K.E., & Mardones, D. 2006, ApJ, 652, 1572
- Bressan et al. (2012) Bressan, A.G., Marigo P., Girardi L., Salasnich B., Dal Cero C., Rubele S., Nanni A., 2012, MNRAS, 427, 127
- Caffau et al. (2011) Caffau, E., Ludwig, H.-G., Steffen, M., Freytag, B., & Bonifacio, P. 2011, Sol. Phys., 268, 255
- Chen et al. (2014) Chen, Y., Girardi, L., Bressan, A., Marigo, P., Barbieri, M., & Kong, X. 2014, MNRAS, 444, 2525
- Cohen (2003) Cohen, M., Wheaton, Wm.A., Megeath, S.T. 2003, AJ, 126, 1090
- Contreras et al. (2002) Contreras, M. E., Sicilia-Aguilar, A., Muzerolle, J., et al. 2002, AJ, 124, 1585
- Covino et al. (1997) Covino, S., Lazzati, D., Ghisellini, G., et al. 1999, A&A, 348, 1
- Cutri et al. (2012) Cutri, R. M., et al. 2012, yCat, 2311, 0
- da Rio et al. (2010) da Rio, N., Robberto, M., Soderblom, D.R., et al. 2010, ApJ, 722, 1092
- da Rio et al. (2012) da Rio, N., Robberto, M., Hillenbrand, L.A., Henning, T., & Stassun, K.G. 2012, ApJ, 748, 14
- D’Antona & Mazzitelli (1997) D’Antona F. and Mazzitelli I. (1997) Mem. Soc. Astron. Italiana, 68, 807
- D’Orazi et al. (2011) D’Orazi, V., Biazzo, K., & Randich, S. 2011, A&A, 526, A103
- de Zeeuw (1999) de Zeeuw, P. T., Hoogerwerf, R., de Bruijne, J.H.J., Brown, A.G.G, & Blaauw, A. 1999, AJ, 117, 354
- Dotter et al. (2008) Dotter A., Chaboyer, B., Jevremovic, D., Kostov, V., Baron, E., & Ferguson, J.W. 2008, ApJS, 178, 89
- Ducourant et al. (2014) Ducourant, C., Teixeira, R., Galli, P.A.B., et al. 2014, A&A, 563, 121
- Fang et al. (2013) Fang, M., van Boekel, R., Bouwman, J., Henning, Th., Lawson, W.A., & Sicilia-Aguilar, A. 2013, A&A, 549, 15
- Fischer et al. (2011) Fischer, W., Edwards, S., Hillenbrand, L., & Kwan, J. 2011, ApJ, 730, 73
- Gennaro et al. (2012) Gennaro, M., Prada Moroni, P.G., & Pisa, E. 2012, MNRAS, 420, 986
- Grevesse & Sauval (1998) Grevesse N., & Sauval A.J., 1998, SSRv, 85, 161
- Hartigan et al. (1994) Hartigan, P., Morse, J.A., & Raymond, J. 1994, ApJ, 436, 125
- Hartigan & Kenyon (2003) Hartigan, P., & Kenyon, S.J. 2003, ApJ, 583, 334
- Hartmann et al. (1997) Hartmann, L., Cassen, P., & Kenyon, S.J. 1997, ApJ, 475, 770
- Hauschildt et al. (1999a) Hauschildt, P.H., Allard, F., Ferguson, J., Baron, E., & Alexander, D.R. 1999, ApJ, 525, 871
- Hauschildt et al. (1999b) Hauschildt, P.H., Allard, F., & Baron, E. 1999, ApJ, 512, 377
- Herczeg & Hillenbrand (2014) Herczeg, G.J., & Hillenbrand, L.A. 2014, ApJ, 786, 97
- Hernandez et al. (2007) Hernandez, J., Calvet, N., Briceno, C., et al. 2007, ApJ, 671, 1784
- Hillenbrand (1997) Hillenbrand, L.A. 1997, AJ, 113, 1733
- Hillenbrand et al. (2008) Hillenbrand, L.A., Bauermeister, A., & White, R.J. 2008, ASP Conf. Series 384, 14th Cambridge Workshop on Cool Stars, Stellar Systems, and the Sun. ed. G.T. van Belle
- Hillenbrand (2009) Hillenbrand L.A. (2009) in: IAU Symposium, vol. 258 of IAU Symposium, (edited by E. E. Mamajek, D. R. Soderblom, and R. F. G. Wyse), pp. 81-94.
- Jackson & Jeffries (2014) Jackson, R.J., & Jeffries, R.D. 2014, MNRAS, 445, 4306
- Janson et al. (2012) Janson, M., Hormuth, F., Bergfors, C., et al. 2012, ApJ, 754, 44
- Kraus et al. (2008) Kraus, A.L., Ireland, M.J., Martinache, F., & Lloyd, J.P. 2008, ApJ, 679, 762
- Kraus & Hillenbrand (2009) Kraus, A.L., & Hillenbrand, L.A. 2009, ApJ, 704, 531
- Kraus & Hillenbrand (2012) Kraus, A.L., & Hillenbrand, L.A. 2012, ApJ, 757, 141
- Kraus et al. (2014) Kraus, A.L., Shkolnik, E.L., Allers, K.N., et al. 2014, AJ, 147, 146
- Lafreniere et al. (2014) Lafreniere, D., Jayawardhana, R., van Kerkwijk, M.H., Brandeker, A., & Janson, M. 2014, ApJ, 785, L47
- Laskar et al. (2009) Laskar, T., Soderblom, D.R., Valenti, J.A., & Stauffer, J.R. 2009, ApJ, 698, 660
- Lopez Marti et al. (2013) Lopez Marti, B., Jiminez Esteban, F., Bayo, A. Barrado, D., Solano, E., & Rodrigo, C. 2013, A&A, 551, 46
- Luhman et al. (2003) Luhman, K.L., Stauffer, J.R., Muench, A.A., et al. 2003, ApJ, 593, 1093
- Luhman & Steeghs (2004) Luhman, K.L., & Steeghs, D. 2004, ApJ, 609, 917
- Luhman (2007) Luhman, K. 2007, ApJS, 173, L104
- Luhman et al. (2010) Luhman, K.L., Allen, P.R., Espaillat, C., Hartmann, L., & Calvet, N. 2010, ApJS, 186, L111
- Luhman & Mamajek (2012) Luhman, K.L., & Mamajek, E.E. 2012, ApJL, 758, 31
- Malo et al. (2013) Malo, L., Doyon, R., Lafreniere, D., Artigau, E., Gagne, J., Baron, F., & Riedel, A. 2013, ApJ, 762, 88
- Malo et al. (2014b) Malo, L., Artigau, E., Doyon, R., Lafreniere, D., Albert, L., & Gagne, J. 2014, ApJ, 788, 81
- Malo et al. (2014a) Malo, L., Doyon, R., Feiden, G.A., et al. 2014, ApJ, 792, 37
- Mamajek et al. (1999) Mamajek, E. E., Lawson, W. A., & Feigelson, E. D. 1999, ApJ, 516, L77
- Mamajek (2009) Mamajek, E. E. 2009, in American Institute of Physics Conference Series, Vol. 1158, American Institute of Physics Conference Series, ed. T. Usuda, M. Tamura, & M. Ishii, 3-10
- Mamajek & Bell (2014) Mamajek, E.E., & Bell, C.P.M. 2014, MNRAS, 445, 2169
- Manara et al. (2013) Manara, C.F., Beccari, G., Da Rio, N., de Marchi, G., Natta, A., Ricci, L., Robberto, M., & Testi, L. 2013, A&A, 557, 114
- Mayne & Naylor (2008) Mayne, N.J., & Naylor, T. 2008, MNRAS, 386, 261
- Murphy et al. (2010) Murphy, S.J., Lawson, W.A., & Bessell, M.S. 2010, MNRAS, 406, L50
- Murphy et al. (2011) Murphy, S.J., Lawson, W.A., Bessell, M.S., & Bayliss, D.D.R. 2011, MNRAS, 411, L51
- Murphy et al. (2013) Murphy, S.J., Lawson, W.A., & Bessell, M.S. 2013, MNRAS, 435, 1325
- Naylor (2009) Naylor, T. 2009, MNRAS, 399, 432
- Pecaut et al. (2012) Pecaut, M.J., Mamajek, E.E., & Bubar, E.J. 2012, ApJ, 746, 154
- Pecaut & Mamajek (2013) Pecaut, M.J., & Mamajek, E.E. 2013, ApJS, 208, 9
- Preibisch et al. (2002) Preibisch, T., Brown, A. G. A., Bridges, T., Guenther, E., & Zinnecker, H. 2002, AJ, 124, 404
- Preibisch et al. (2012) Preibisch, T. 2012, RAA, 12, 1
- Rebull et al. (2010) Rebull, L.M., Padgett, D.L., McCabe, C.-E., et al. 2010, ApJS, 186, 259
- Reggiani (2011) Reggiani, M., Robberto, M., Da Rio, N., Meyer, M.R., Soderblom, D.R., & Ricci, L. 2011, A&A, 534, 83
- Riedel et al. (2014) Riedel, A.R., Finch, C.T., Henry, T.J., et al. 2014, ApJ, 147, 85
- Rieke & Lebofsky (1985) Rieke, G.H. & Lebofsky, M.J. 1985, ApJ, 288, 618
- Rigliaco et al. (2011) Rigliaco, E., Natta, A., Randich, S., Testi, L., & Biazzo, K. 2011, A&A, 525, 47
- Siess et al. (2000) Siess, L., Dufour, E., & Forestini, M. 2000, A&A, 358, 593
- Skrutskie et al. (2006) Skrutskie, M.F., Cutri, R.M., Stiening, R., et al. 2006, AJ, 131, 1163
- Slesnick et al. (2006) Slesnick, C.L., Carpenter, J.M., & Hillenbrand, L.A. 2006, AJ, 131, 3016
- Slesnick et al. (2008) Slesnick, C.L., Hillenbrand, L.A., & Carpenter, J.M. 2008, ApJ, 688, 377
- Soderblom et al. (2014) Soderblom, D.R., Hillenbrand, L.A., Jeffries, R.D., Mamajek, E.E., & Naylor, T. 2014, PP VI
- Somers & Pinsonneault (2014) Somers, G., & Pinsonneault, M.H. 2014, ApJ, 790, 72
- Stassun et al. (2014) Stassun, K.G., Feiden, G.A., & Torres, G. 2014, NewAR, 60, 1
- Tognelli et al. (2011) Tognelli, E., Prada Moroni, P.G., & Degl’Innocenti, S. 2011, A&A, 533, 109
- Tottle & Mohanty (2015) Tottle, J., & Mohanty, S. 2015, accepted by ApJ, astro-ph://1412.7191
- van Leeuwen (2007) van Leeuwen, F. 2007, A&A, 474, 653
- Weinberger et al. (2013) Weinberger, A.J., Anglada-Escudé G., & Boss, A.P. 2013, ApJ, 762, 118
- Weingartner & Draine (2001) Weingartner, J.C., & Draine, B.T. 2001, ApJ, 548, 296
- Williams et al. (2010) Williams, M.J., Bureau, M., & Cappellari, M. 2010, MNRAS, 409, 1330
- Zacharias et al. (2013) Zacharias, N., Finch, C.T., Girard, T.M., et al. 2013, AJ, 145, 44