Defining and Identifying Sleeping Beauties in Science
Abstract
A Sleeping Beauty (SB) in science refers to a paper whose importance is not recognized for several years after publication. Its citation history exhibits a long hibernation period followed by a sudden spike of popularity. Previous studies suggest a relative scarcity of SBs. The reliability of this conclusion is, however, heavily dependent on identification methods based on arbitrary threshold parameters for sleeping time and number of citations, applied to small or monodisciplinary bibliographic datasets. Here we present a systematic, large-scale, and multidisciplinary analysis of the SB phenomenon in science. We introduce a parameter-free measure that quantifies the extent to which a specific paper can be considered an SB. We apply our method to 22 million scientific papers published in all disciplines of natural and social sciences over a time span longer than a century. Our results reveal that the SB phenomenon is not exceptional. There is a continuous spectrum of delayed recognition where both the hibernation period and the awakening intensity are taken into account. Although many cases of SBs can be identified by looking at monodisciplinary bibliographic data, the SB phenomenon becomes much more apparent with the analysis of multidisciplinary datasets, where we can observe many examples of papers achieving delayed yet exceptional importance in disciplines different from those where they were originally published. Our analysis emphasizes a complex feature of citation dynamics that so far has received little attention, and also provides empirical evidence against the use of short-term citation metrics in the quantification of scientific impact.
Significance—Scientific papers have typically a finite lifetime: their rate to attract citations achieves its maximum a few years after publication, and then steadily declines. Previous studies pointed out the existence of a few blatant exceptions: papers whose relevance has not been recognized for decades, but then suddenly become highly influential and cited. The Einstein, Podolsky, and Rosen “paradox” paper is an exemplar Sleeping Beauty. We study how common Sleeping Beauties are in science. We introduce a quantity that captures both the recognition intensity and the duration of the “sleeping” period, and show that Sleeping Beauties are far from exceptional. The distribution of such quantity is continuous and has power-law behavior, suggesting a common mechanism behind delayed but intense recognition at all scales.
There is an increasing interest in understanding the dynamics underlying scientific production and the evolution of science egghe1990introduction . Seminal studies focused on scientific collaboration networks Newman-coauthor-04 , evolution of disciplines Sun-dynamics-13 , team science Guimera-team-05 ; Wuchty-team-07 ; Jones-team-08 ; Milojevic-team-14 , and citation-based scientific impact Radicchi-impact-08 ; Wang-impact-13 ; Uzzi-comb-13 . An important issue at the core of many research efforts in science of science is characterizing how papers attract citations during their lifetime. Citations can be regarded as the credit units that the scientific community attributes to its research products. As such, they are at the basis of several quantitative measures aimed at evaluating career trajectories of scholars hirsch2005index and research performance of institutions kinney2007national ; davis1984faculty . They are also increasingly used as evaluation criteria in very important contexts, such as hiring, promotion, and tenure, funding decisions, or department and university rankings bornmann2006selecting ; liu2005academic . Several factors can potentially affect the amount of citations accumulated by a paper over time, including its quality, timeliness, and potential to trigger further inquiries Wang-impact-13 , the reputation of its authors sarigol2014predicting ; Petersen-reputation-14 , as well as its topic and age Radicchi-impact-08 .
Studies about fundamental mechanisms that drive citation dynamics started already in the 1960s, when de Solla Price introduced the cumulative advantage (CA) model to explain the emergence of power-law citation distributions Price-cumuadv-76 . CA essentially provisions that the probability of a publication to attract a new citation is proportional to the number of citations it already has. The criterion, now widely referred to as preferential attachment, was recently popularized by Barabási and Albert Barabasi-pa-99 , who proposed it as a general mechanism that yields heterogeneous connectivity patterns in networks describing systems in various domains albert2002statistical ; boccaletti2006complex . Other processes that effectively incorporate the CA mechanism have been proposed to explain power-law citation distributions. Krapivsky and Redner, for example, considered a redirection mechanism, where new papers copy with a certain probability the citations of other papers Krapivsky-redirect-01 .
An important effect not included in the CA mechanism is the fact that the probability of receiving citations is time dependent. In the CA model, papers continue to acquire citations independently of their age so that, on average, older papers accumulate higher number of citations Barabasi-pa-99 ; Krapivsky-redirect-01 ; newman2009first . However, it has been empirically observed that the rate at which a paper accumulates citations decreases after an initial growth period hajra2004phase ; hajra2005aging ; hajra2006modelling ; wang2008measuring . Recent studies about growing network models include the aging of nodes as a key feature hajra2004phase ; wang2008measuring ; dorogovtsev2000evolution ; dorogovtsev2001scaling ; zhu2003effect . More recently, Wang et al. developed a model that includes, in addition to the CA and aging, an intuitive yet fundamental ingredient: a fitness or quality parameter that accounts for the perceived novelty and importance of individual papers Wang-impact-13 .
In this work, we focus on the citation history of papers receiving an intense but late recognition. Note that delayed recognition cannot be predicted by current models for citation dynamics. All models, regardless of the number of ingredients used, naturally lead to the so-called first-mover advantage, according to which either papers start to accumulate citations in the early stages of their lifetime or they will never be able to accumulate a significant number of citations newman2009first . Back in the 1980s, Garfield provided examples of articles with delayed recognition and suggested to use citation data to identify them Garfield-beauty-80 ; Garfield-beauty-89 ; Garfield-beautyb-89 ; Garfield-beauty-90 . Through a broad literature search, Glänzel et al. gave an estimate for the occurrence of delayed recognition, and highlighted a few shared features among lately recognized papers Glanzel-beauty-03 . The coinage of the term “Sleeping Beauty” (SB) in reference to papers with delayed recognition is due to van Raan Raan-Beauty-04 . He proposed three dimensions along which delayed recognition can be measured: (i) length of sleep, i.e., the duration of the “sleeping period;” (ii) depth of sleep, i.e., the average number of citations during the sleeping period; and (iii) awake intensity, i.e., the number of citations accumulated during 4 years after the sleeping period. By combining these measures, he identified a few SB examples occurred between and . These seminal studies suffer from two main limitations: (i) the analyzed datasets are very small, especially if compared to the size of the bibliographic databases currently available; and (ii) the definition and the consequent identification of SBs are to the same extent arbitrary, and strongly depend on the rules adopted. More recently, Redner analyzed a very large dataset covering years of publications in physics Redner-110citation-2005 . Redner proposed a definition of revived classic (or SB) for articles satisfying the three following criteria: (i) publication date antecedent 1961; (ii) number of citations larger than 250; and (iii) ratio of the average citation age to publication age greater than 0.7. Whereas Redner was able to overcome the first limitation mentioned above, his study is still affected by an arbitrary selection choice of top SBs, justified by the principle that SBs represent exceptional events in science. In addition, Redner’s analysis has the limitation to be field specific, covering only publications and citations within the realm of physics.
Here we perform an analysis on the SB phenomenon in science. We propose a parameter-free approach to quantify how much a given paper can be considered as an SB. We call this index “beauty coefficient,” denoted as . By measuring for tens of millions of publications in multiple scientific disciplines over an observation window longer than a century, we show that is characterized by a heterogeneous but continuous distribution, with no natural separation between papers with low, high, or even extreme values of . Also, we demonstrate that the empirical distributions of cannot be easily reconciled with obvious baseline models for citation accumulation that are based solely on CA or the reshuffling of citations. We introduce a simple method to identify the awakening time of SBs, i.e., the year when their citations burst. The results indicate that many SBs become highly influential more than 50 years after their publication, far longer than typical time windows for measuring citation impact, corroborating recent studies on understanding the use of short time windows to approximate long-term citations Bornmann-percentile-2013 ; Bornmann-improve-2014 ; Wang-window-2013 . We further show that the majority of papers exhibit a sudden decay of popularity after reaching the maximum number of yearly citations, independently of their values. Our study points out that the SB phenomenon has two important multidisciplinary components. First, particular disciplines, such as physics, chemistry, and mathematics, are able to produce top SBs at higher rates than other scientific fields. Second, top SBs achieve delayed exceptional importance in disciplines different from those where they were originally published. Based on these results, we believe that our study may pave the way to the identification of the complex dynamics that trigger the awakening mechanisms, shedding light on highly cited papers that follow nontraditional popularity trajectories.
I materials
I.1 Beauty coefficient
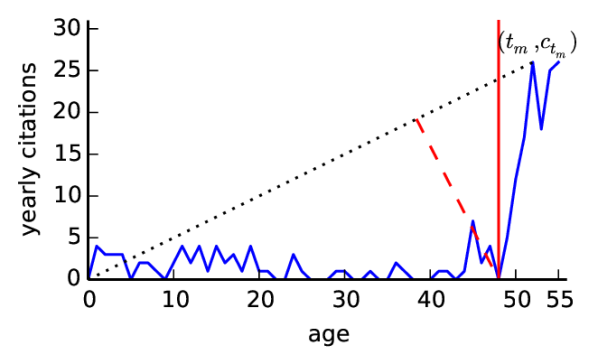
The beauty coefficient value for a given paper is based on the comparison between its citation history and a reference line that is determined only by its publication year, the maximum number of citations received in a year (within a multi-year observation period), and the year when such maximum is achieved. Given a paper, let us define as the number of citations received in the -th year after its publication; indicates the age of the paper. Let us also assume that our index is measured at time , and that the paper receives its maximum number of yearly citations at time .
Consider the straight line that connects the points and in the time-citation plane (Fig. 1). This line is described by the equation
| (1) |
where is the slope of the line, and the number of citations received by the paper in the year of its publication. For each , we then compute the ratio between and . Summing up the ratios from to , the beauty coefficient is defined as
| (2) |
By definition, for papers with . Papers with citations growing linearly with time () have . is non-positive for papers whose citation trajectory is a concave function of time. Our index has a number of desirable properties: (i) can be computed for any paper and does not rely on arbitrary thresholds on the sleeping period or the awakening intensity, paving the way to treat the SB phenomenon not as just an exception; (ii) increases with both the length of the sleeping period and the awakening intensity; (iii) takes into account the entire citation history in the time window ; and (iv) The denominator of Eq. 2 penalizes early citations so that, at parity of total citations received, the later those citations are accumulated the higher is the value of .
I.2 Awakening time
We now give a plausible definition of awakening time—the year when the abrupt change in the accumulation of citations of SBs occurs. Being able to pinpoint the awakening time may help identifying possible general trigger mechanisms behind said change. For example, in SI Appendix we show that around the awakening time, the SBs co-citation dynamics exhibit clear topical patterns (SI Appendix, Fig. S11) Redner-110citation-2005 . We define the awakening time as the time at which the distance between the point and the reference line reaches its maximum:
| (3) |
where is given by
As we shall show, the above definition works well for limit cases where there are no citations until the spike, and seems to well capture the qualitative notion of awakening time when a strong SB-like behavior is present.
I.3 Datasets
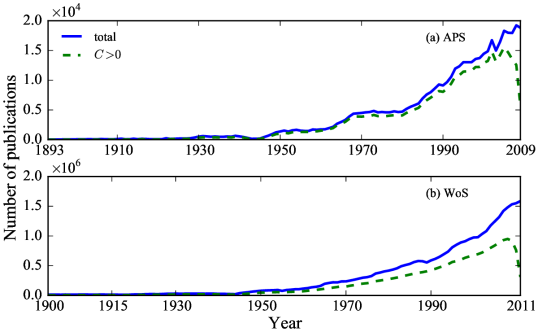
We use two datasets in the following empirical analysis, the American Physical Society (APS) and the Web of Science (WoS) dataset (SI Appendix, section S1). The APS journals are the major publication outlets in physics. WoS includes papers in both sciences and social sciences. We focus on the papers in the APS and papers in the WoS that received at least one citation. Those papers span more than a century, and thus allow us to investigate the SB phenomenon for a long observation period. Whereas the APS dataset can be viewed as a perfect proxy to characterize citation dynamics within the monodisciplinary research field of physics and is used to compare our analysis with a previous study Redner-110citation-2005 , the WoS dataset allows us to underpin multidisciplinary features of the SB phenomenon.
II Results
II.1 Sleeping Beauties in physics
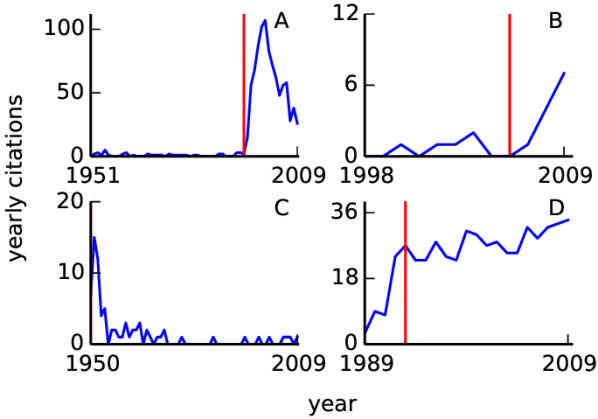
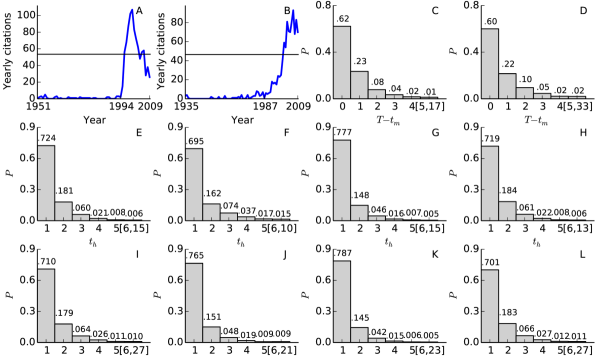
First, we qualitatively demonstrate the resolution power of for four papers with radically different citation trajectories. Fig. 2A shows a paper with a very high value. Published in 1951, this paper collected a small number of yearly citations until , when it suddenly started to receive many citations until reaching its maximum in . Fig. 2B exhibits a qualitatively similar citation trajectory for a recently published paper with a very low and consequently a much smaller . The paper in Fig. 2C achieved its maximum yearly citations at . The citation history therefore coincides with the reference line in , yielding . Note that our measure only examines how the citation curve reaches its peak, but does not consider how it decreases after that. The paper in Fig. 2D is characterized by a negative value, as is above the reference line.
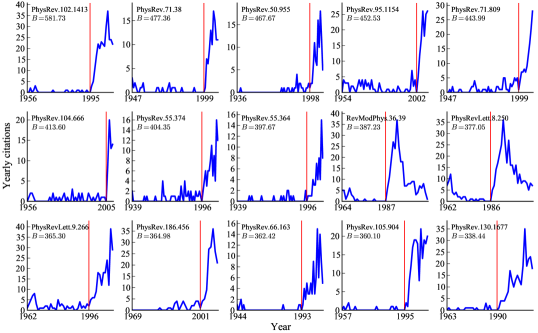
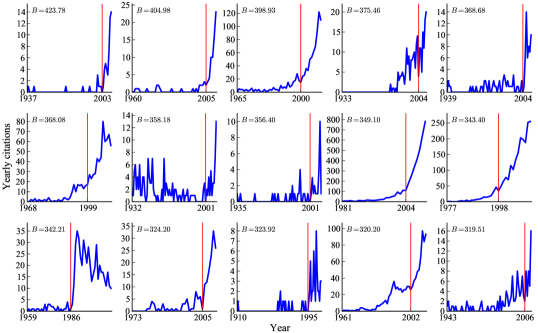
Second, we test the effectiveness of to identify top SBs in the APS by using the revived classics, previously identified by Redner, as a benchmark set Redner-110citation-2005 . Our results are in excellent agreement with Redner’s analysis Redner-110citation-2005 : 6 out 12 of the revived classics detected by Redner are in our top 10 list; the other 6 have also very high values, although they occupy less important positions in the ranking according to (SI Appendix, Table S1). Differences are due to the principles underlying the two approaches, with ours not relying on threshold parameters for the sleeping time and the number of citations. To better clarify the diversity of the two approaches, SI Appendix, Figs. S2 and S3 report the citation history of the papers with highest values in the APS dataset. We see that our measure identifies papers with a long hibernation period followed by a sudden burst in yearly citations, without the need to reach extremely high values of citations. As already pointed out by Redner Redner-110citation-2005 , the list of top SBs in the APS reveals a natural grouping into a relatively small number of coarse topics, with papers belonging to the same topic exhibiting remarkably similar citation histories (SI Appendix, Fig. S11). This suggests that a “premature” topic may fail to attract the community attention even when it is introduced by authors who have already established a strong scientific reputation. A corroborating evidence is provided by the famous EPR paradox paper by Einstein, Podolsky, and Rosen that is among the top SBs we found in this dataset (SI Appendix, Fig. S2B).
II.2 How rare are Sleeping Beauties?
In contrast with previous SB definitions Glanzel-beauty-03 ; Raan-Beauty-04 ; Redner-110citation-2005 , ours does not rely on the arbitrary choice of age or citation thresholds. This fact puts us in the unique position of investigating the SB phenomenon at the systemic level and asking fundamental questions from the macroscopic point of view: Are papers with extreme values of exceptional occurrences? Do the majority of papers behave in a qualitatively different way from the extreme cases discussed above, when their sleeping period and bursty awakening are considered?
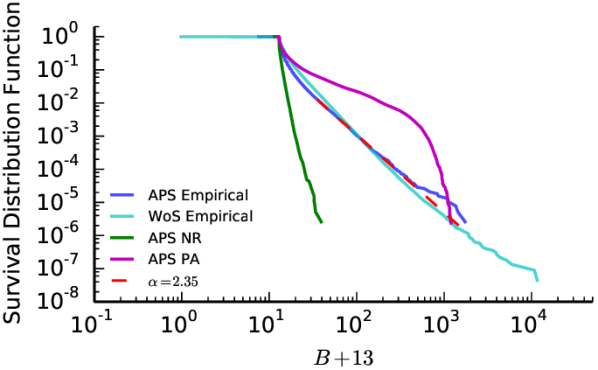
To this end, we provide a statistical description of the distribution of beauty coefficients across all papers in each of the two datasets. Fig. 3 shows the survival distribution functions of for all papers in the APS and WoS datasets. We observe a heterogeneous but continuous distribution of , spanning several orders of magnitude. Except for the cutoff—which is much larger for the WoS dataset—APS and WoS exhibit remarkably similar distributions. Although the vast majority of papers exhibit low values of , there is a consistent number of papers with high . The distributions also show no typical value or mode; there are no clear demarcation values that allow us to separate SBs from “normal” papers: delayed recognition occurs on a wide and continuous range, in sharp contrast with previous results claiming that SBs are extraordinary cases Glanzel-beauty-03 ; Glanzel-beauty-04 ; Redner-110citation-2005 .
It may appear as not entirely fair to compare beauty coefficients for papers of different ages marx2010reference : Later papers have by definition less chance to develop a long sleeping period and to exhibit a sudden awakening. This may, to some extent, dictate the shapes of observed distributions. On the other hand, the vast majority of papers tend to have a single and well-defined peak in their yearly citations early during their lifetime, implying that their values do not change with moving the observation time far into the future. In particular, our estimations indicate that nearly of the papers have already experienced a drastic decrement after their maximum number of yearly citations, irrespective of their value (SI Appendix, section S3). The shapes of the empirical distributions remain essentially unchanged if we consider only the papers that have experienced the typical sharp decline of the post-maximum yearly citation rate.
II.3 Is the Sleeping Beauty phenomenon statistically significant?
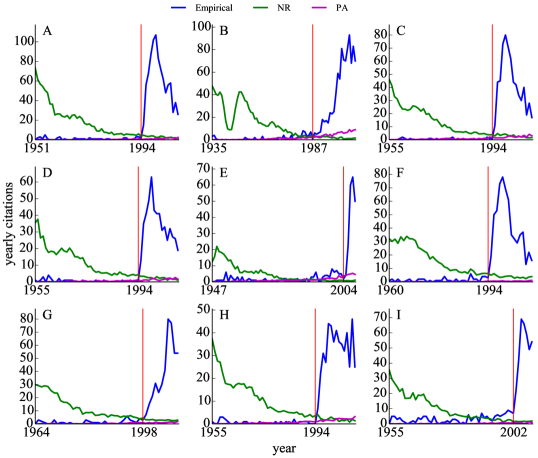
The result of the previous section implicitly suggests that the SB phenomenon could be in principle described via a simple mechanism that works essentially at all scales. This leads naturally to the question whether the observed distributions of can be accounted for by idealized network evolution models. To address this question, we first consider a citation network randomization (NR) process where citations are randomly reshuffled, preserving time order (SI Appendix, section S4). SI Appendix, Fig. S2 compares the citation history of the top nine SBs in the APS dataset and the corresponding ones obtained through the NR process. They typically show opposite trends, with NR histories exhibiting a rapid decline. This is not surprising: As later papers are considered, the probability for an existing paper to receive a citation from one of such late papers decreases simply because there is a larger number of papers that could potentially receive the citation. This leads to typically smaller beauty coefficients, as evident in the sharp decrease of the NR distribution in Fig. 3, and the associated small maximum value .
Next, we consider the preferential attachment (PA) mechanism as another baseline model, as it is one of the most fundamental ingredients used in most modeling efforts aimed at describing citation histories of papers. In the PA baseline, references of progressively added citing papers are reassigned according to the PA mechanism (SI Appendix, section S4). SI Appendix, Fig. S2 also shows slowly increasing yearly citations by the PA model, explained by the positive feedback effect generated via the PA mechanism. The overall number of citations according to PA baseline for the nine papers in SI Appendix, Fig. S2 remains small. Those are relatively young papers in the dataset and their probability to receive citations, according to PA, is reduced by that of older papers. The resulting distribution of in Fig. 3 shows a much smaller range and a well-defined cutoff. It remains to be seen to what extent a recently proposed model for citation histories Wang-impact-13 are compatible with the SB phenomenon.
II.4 Sleeping Beauties in science
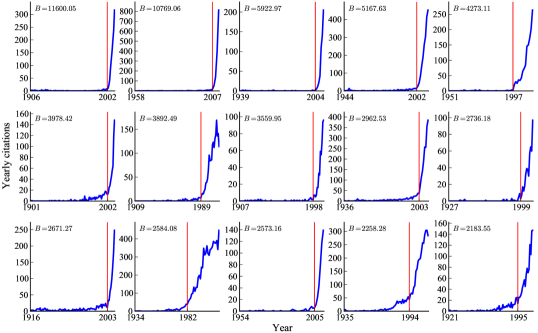
The occurrence of extreme cases of SBs is not limited to physics. Table 1 lists basic information about the papers with the highest values in the WoS dataset (see SI Appendix, Fig. S4 for their citation histories). This list contains four SBs that were published in the 1900s. Consistent with previous studies, we find that many SBs are in the field of physics and chemistry Glanzel-beauty-03 . Two papers are, however, in the field of statistics, which fails to be noted before as a top discipline producing SBs. One of them slept for more than one century: the paper by the influential statistician Karl Pearson, published in in the journal Philosophical Magazine, shows the relation between principal component analysis and the minimization chi-distance. The other one, published in (therefore sleeping for more than years), introduces the Wilson score interval, one type of confidence interval for estimating a proportion that improves over the commonly used normal approximation interval. The 3rd (), 12th (), and 15th () top-ranked papers in the WoS dataset were published in Physical Review, but were not ranked as top papers in the APS dataset, suggesting that the bulk of their citations are mainly from journals not contained in the APS dataset. The EPR paradox paper (the 14th), however, is ranked at the top in both datasets.
| Author(s) | Title | Pub., awake | Journal | Field | |
| 11600 | Freundlich, H | Concerning adsorption in solutions | 1906, 2002 | Z. Phys. Chem. | Chem. |
| 10769 | Hummers, WS | Preparation of Graphitic Oxide | 1958, 2007 | J. Am. Chem. Soc. | Chem. |
| Offeman, RE | |||||
| 5923 | Patterson, AL | The Scherrer formula for x-ray particle size | 1939, 2004 | Phys. Rev. | Phys. |
| determination | |||||
| 5168 | Cassie, ABD | Wettability of porous surfaces | 1944, 2002 | Trans. Faraday Soc. | Chem. |
| Baxter, S | |||||
| 4273 | Turkevich, J | A study of the nucleation and growth | 1951, 1997 | Discuss. Faraday Soc. | Chem. |
| Stevenson, PC | processes in the synthesis of colloidal | ||||
| Hillier, J | gold | ||||
| 3978 | Pearson, K | On lines and planes of closest fit to | 1901, 2002 | Philos. Mag. | Statist. |
| systems of points in space | |||||
| 3892 | Stoney, GG | The tension of metallic films deposited by electrolysis | 1909, 1989 | Proc. R. Soc. Lond. A | Phys. |
| 3560 | Pickering, SU | CXCVI.–Emulsions | 1907, 1998 | J. Chem. Soc., Trans. | Chem. |
| 2962 | Wenzel, RN | Resistance of solid surfaces to wetting by water | 1936, 2003 | Ind. Eng. Chem. | Chem. |
| 2736 | Wilson, EB | Probable inference, the law of succession, | 1927, 1999 | J. Am. Statist. Assoc. | Statist. |
| and statistical inference | |||||
| 2671 | Langmuir, I | The constitution and fundamental properties | 1916, 2003 | J. Am. Chem. Soc. | Chem. |
| of solids and liquids Part I Solids | |||||
| 2584 | Moller, C; | Note on an approximation treatment for | 1934, 1982 | Phys. Rev. | Phys. |
| Plesset, MS | many-electron systems | ||||
| 2573 | Pugh, SF | Relations between the elastic moduli and the | 1954, 2005 | Philos. Mag. | Metallurgy |
| plastic properties of polycrystalline pure metals | |||||
| 2258 | Einstein, A | Can quantum-mechanical description of | 1935, 1994 | Phys. Rev. | Phys. |
| Podolsky, B | physical reality be considered complete? | ||||
| Rosen, N | |||||
| 2184 | Washburn, EW | The dynamics of capillary flow | 1921, 1995 | Phys. Rev. | Phys. |
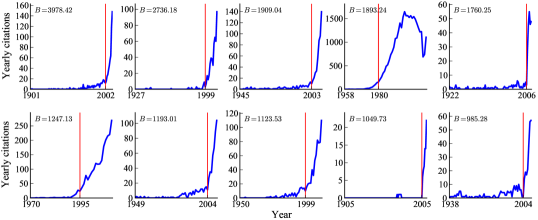
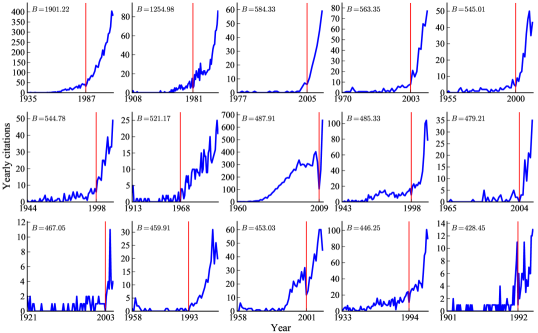
SI Appendix, Tables S2 and S3 list basic information about the top SB papers in statistics and mathematics, respectively. Publications introducing many important techniques, like Fisher’s exact test, Metropolis–Hastings algorithm, and Kendall rank correlation coefficient, have high beauty coefficients. We also find numerous examples of SBs in the social sciences (SI Appendix, Table S4), in contrast with previous results about their alleged absence Glanzel-beauty-03 .
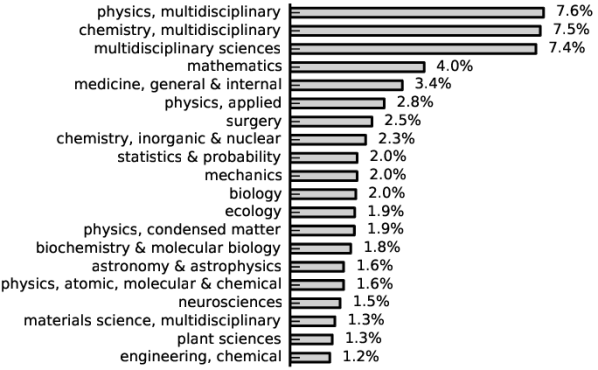
How are SBs distributed among different (sub-)disciplines? To further investigate the multidisciplinary character of the SB phenomenon, we took advantage of journal classifications provided by Journal Citation Reports (JCR) (thomsonreuters.com/en/products-services/scholarly-scientific-research/research-managementand-evaluation/journal-citation-reports.html), which classify scientific journals into one or more subject categories (e.g. physics, multidisciplinary; mathematics; medicine, general and internal). We first consider only papers published in journals belonging to at least one JCR subject category, and focus on the top of papers with highest values. Then, we compute the fraction of those papers that belong to a given subject category. Fig. 4 shows the top categories producing SBs. Subfields of physics, chemistry, and mathematics are noticeably the top disciplines, consistently with previous studies Glanzel-beauty-03 . Some disciplines not previously noted include medicine (internal and surgery), statistics and probability. Particularly interesting is the category multidisciplinary sciences, ranked third, that includes top journals like Nature, Science, and PNAS, because (i) delayed recognition signals that such contributions may be perceived by the academic community as too premature or futuristic, although it is common ground among academics to speculate that such venues only publish trending topics, and (ii) journals in the multidisciplinary sciences subject category are really more fit to attract publications that become field-defining even decades after their appearance.
II.5 What triggers the awakening of an SB?
A full answer to this question would require a case-by-case examination, but it can be addressed in a systematic way by studying the papers that cite the SB before and after its awakening. To illustrate this strategy, it is worth to examine two paradigmatic examples of top SBs.
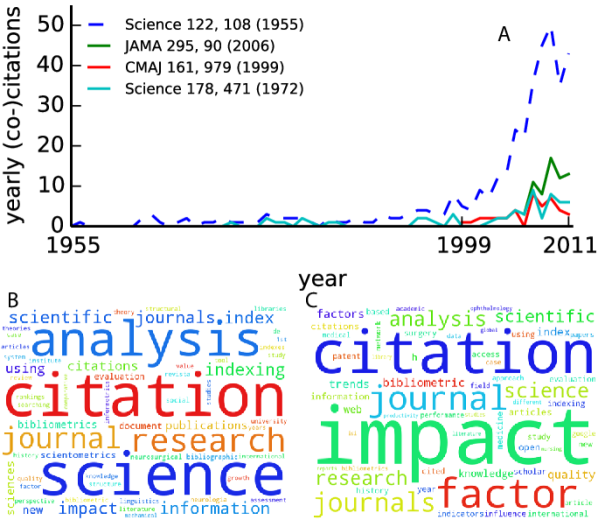
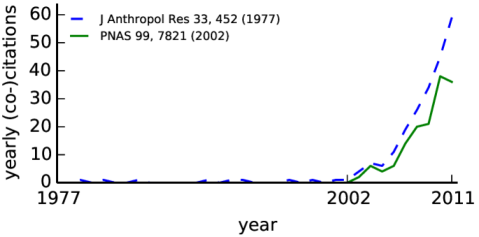
The first is the 1955 Garfield paper introducing the ancestor of the Web of Science database Garfield-sci-1955 . This paper slept for almost years, becoming suddenly popular around . A simple investigation based on co-citations, similar to the one performed in ref. marx2014shockley , reveals that the delayed recognition of the 1955 paper by Garfield was triggered by later articles by the same author (Fig. 5A). Such papers, in turn, were cited by very influential works in two different contexts: (i) the 1999 article by Kleinberg about the hyperlink-induced topic search (HITS) algorithm, which can be considered one pioneering works in network science kleinberg1999authoritative ; and (ii) the 1998 paper by Seglen on the limitations of the journal impact factor, which historically represents the beginning of the ongoing debate about the (mis)use of citation indicators in research evaluation seglen1997impact . The change in contextual importance of the 1955 paper by Garfield is further revealed by the frequency of keywords appearing in the titles of its citing papers before and after year 2000 (Fig. 5B and C), with the notion of “impact factor” becoming the main recognizable difference. With a similar motivation, the 1977 paper by Zachary also tops the ranking of SBs coming from the social sciences Zachary-karate-1977 . This paper was essentially unnoticed for about years, but then became suddenly important in network science research after the publication of the seminal paper by Girvan and Newman, which adopts the social network described in the Zachary paper as a paradigmatic benchmark to validate community detection methods on graphs Girvan-comm-2002 (SI Appendix, Fig. S12).
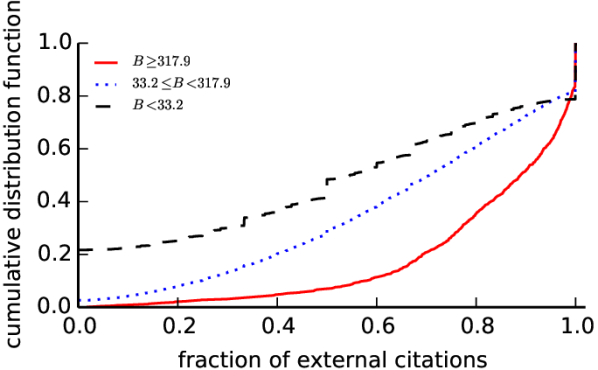
The examples above suggest that a partial explanation behind the sudden awakening of top SBs may lie in the fact that the paper in question is suddenly “discovered” as relevant by an entire community in another discipline. To support this hypothesis, in Fig 6 we divide the papers in the WoS dataset in three disjoint subsets with high, medium, and low values of . For each subset we compute the cumulative distribution for the fraction of citations received by a paper from publications in a discipline (as inferred by the journal of publication) different from that of the cited paper. Top SBs are clearly different from the other two categories and are characterized by a typically very high fraction of citations from other disciplines: for about of the top SBs, as much as or more of citations are of interdisciplinary nature.
III Discussion
The main purpose of this work was to introduce a parameter-free method to quantify to what extent a paper is an SB. Through a systematic analysis carried out on large-scale bibliographic databases and over observation windows longer than a century, we have shown that our method correctly identifies cases that meet the intuitive notion of SBs. We noticed that our measure is not entirely free of biases: Comparing the degree of beauty between papers in different disciplines or ages may be problematic due to differences in the overall citation patterns. Despite this limitation, we found that papers whose citation histories are characterized by long dormant periods followed by fast growths are not exceptional outliers, but simply the extreme cases in very heterogeneous but otherwise continuous distributions. Simple models based on cumulative advantage, although consistent with overall citation distributions, are not easily reconciled with the observed distributions of beauty coefficients. Further work is needed to uncover the general mechanisms that may be held responsible for the awakening of SBs.
Acknowledgements.
We thank Claudio Castellano, Filippo Menczer, Yong-Yeol Ahn, Cassidy Sugimoto, and Chaoqun Ni for insightful discussions, and the American Physical Society for making the APS dataset publicly available. This work is partially supported by NSF (grant SMA-1446078).References
- (1) Egghe L, Rousseau R (1990) Introduction to Informetrics: Quantitative Methods in Library, Documentation and Information Science (Elsevier Science, Amsterdam).
- (2) Newman MEJ (2004) Coauthorship networks and patterns of scientific collaboration. Proc Natl Acad Sci USA 101(suppl 1):5200–5205.
- (3) Sun X, Kaur J, Milojević S, Flammini A, Menczer F (2013) Social dynamics of science. Sci Rep 3:1069.
- (4) Guimerà R, Uzzi B, Spiro J, Amaral LAN (2005) Team assembly mechanisms determine collaboration network structure and team performance. Science 308(5722):697–702.
- (5) Wuchty S, Jones BF, Uzzi B (2007) The increasing dominance of teams in production of knowledge. Science 316(5827):1036–1039.
- (6) Jones BF, Wuchty S, Uzzi B (2008) Multi-university research teams: Shifting impact, geography, and stratification in science. Science 322(5905):1259–1262.
- (7) Milojević S (2014) Principles of scientific research team formation and evolution. Proc Natl Acad Sci USA 111(11):3984–3989.
- (8) Radicchi F, Fortunato S, Castellano C (2008) Universality of citation distributions: Toward an objective measure of scientific impact. Proc Natl Acad Sci USA 105(45):17268–17272.
- (9) Wang D, Song C, Barabási AL (2013) Quantifying long-term scientific impact. Science 342(6154):127–132.
- (10) Uzzi B, Mukherjee S, Stringer M, Jones B (2013) Atypical combinations and scientific impact. Science 342(6157):468–472.
- (11) Hirsch JE (2005) An index to quantify an individual’s scientific research output. Proc Natl Acad Sci USA 102(46):16569–16572.
- (12) Kinney A (2007) National scientific facilities and their science impact on nonbiomedical research. Proc Natl Acad Sci USA 104(46):17943–17947.
- (13) Davis P, Papanek GF (1984) Faculty ratings of major economics departments by citations. Am Econ Rev 74(1):225–230.
- (14) Bornmann L, Daniel HD (2006) Selecting scientific excellence through committee peer review-a citation analysis of publications previously published to approval or rejection of post-doctoral research fellowship applicants. Scientometrics 68(3):427–440.
- (15) Liu NC, Cheng Y (2005) The academic ranking of world universities. High Educ Eur 30:127–136.
- (16) Sarigöl E, Pfitzner R, Scholtes I, Garas A, Schweitzer F (2014) Predicting scientific success based on coauthorship networks. EPJ Data Science 3(1):9.
- (17) Petersen AM, et al. (2014) Reputation and impact in academic careers. Proc Natl Acad Sci USA 111(43):15316–15321.
- (18) de Solla Price DJ (1976) A general theory of bibliometric and other cumulative advantage processes. J Am Soc Inf Sci 27(5):292–306.
- (19) Barabási AL, Albert R (1999) Emergence of scaling in random networks. Science 286(5439):509–512.
- (20) Albert R, Barabási AL (2002) Statistical mechanics of complex networks. Rev Mod Phys 74(1):47–97.
- (21) Boccaletti S, Latora V, Moreno Y, Chavez M, Hwang DU (2006) Complex networks: Structure and dynamics. Phys Rep 424(4–5):175–308.
- (22) Krapivsky PL, Redner S (2001) Organization of growing random networks. Phys Rev E Stat Nonlin Soft Matter Phys 63(6 Pt 2):066123.
- (23) Newman MEJ (2009) The first-mover advantage in scientific publication. EPL 86(6):68001.
- (24) Hajra KB, Sen P (2004) Phase transitions in an aging network. Phys Rev E Stat Nonlin Soft Matter Phys 70(5 Pt 2):056103.
- (25) Hajra KB, Sen P (2005) Aging in citation networks. Physica A 346(1–2):44–48.
- (26) Hajra KB, Sen P (2006) Modelling aging characteristics in citation networks. Physica A 368(2):575–582.
- (27) Wang M, Yu G, Yu D (2008) Measuring the preferential attachment mechanism in citation networks. Physica A 387(18):4692–4698.
- (28) Dorogovtsev SN, Mendes JFF (2000) Evolution of networks with aging of sites. Phys Rev E Stat Nonlin Soft Matter Phys 62:1842.
- (29) Dorogovtsev SN, Mendes JF (2001) Scaling properties of scale-free evolving networks: Continuous approach. Phys Rev E Stat Nonlin Soft Matter Phys 63(5 Pt 2):056125.
- (30) Zhu H, Wang X, Zhu JY (2003) Effect of aging on network structure. Phys Rev E Stat Nonlin Soft Matter Phys 68(5 Pt 2):056121.
- (31) Garfield E (1980) Premature discovery or delayed recognition—why? Current Contents 21:5–10.
- (32) Garfield E (1989) Delayed recognition in scientific discovery: Citation frequency analysis aids the search for case histories. Current Contents 23:3–9.
- (33) Garfield E (1989) More delayed recognition. Part 1. Examples from the genetics of color blindness, the entropy of short-term memory, phosphoinositides, and polymer rheology. Current Contents 38:3–8.
- (34) Garfield E (1990) More delayed recognition. Part 2. From inhibin to scanning electron microscopy. Current Contents 9:3–9.
- (35) Glänzel W, Schlemmer B, Thijs B (2003) Better late than never? On the chance to become highly cited only beyond the standard bibliometric time horizon. Scientometrics 58(3):571–586.
- (36) van Raan AFJ (2004) Sleeping Beauties in science. Scientometrics 59(3):467–472.
- (37) Redner S (2005) Citation statistics from 110 years of physical review. Phys Today 58(6):49–54.
- (38) Bornmann L, Leydesdorff L, Wang J (2013) Which percentile-based approach should be preferred for calculating normalized citation impact values? An empirical comparison of five approaches including a newly developed citation-rank approach (p100). J Informetrics 7(4):933–944.
- (39) Bornmann L, Leydesdorff L, Wang J (2014) How to improve the prediction based on citation impact percentiles for years shortly after the publication date? J Informetrics 8(1):175–180.
- (40) Wang J (2013) Citation time window choice for research impact evaluation. Scientometrics 94(3):851–872.
- (41) Glänzel W, Garfield E (2004) The myth of delayed recognition. The Scientist 18:8–9.
- (42) Marx W, Bornmann L, Cardona M (2010) Reference standards and reference multipliers for the comparison of the citation impact of papers published in different time periods. J Am Soc Info Sci Technol 61(10):2061–2069.
- (43) Garfield E (1955) Citation indexes for science: A new dimension in documentation through association of ideas. Science 122(3159):108–111.
- (44) Marx W (2014) The Shockley-Queisser paper–a notable example of a scientific sleeping beauty. Annalen der Physik 526(5-6):A41–A45.
- (45) Kleinberg JM (1999) Authoritative sources in a hyperlinked environment. J ACM 46(5):604–632.
- (46) Seglen PO (1997) Why the impact factor of journals should not be used for evaluating research. BMJ 314(7079):497.
- (47) Zachary WW (1977) An information flow model for conflict and fission in small groups. J Anthropol Res 33(4):452–473.
- (48) Girvan M, Newman MEJ (2002) Community structure in social and biological networks. Proc Natl Acad Sci USA 99(12):7821–7826.
- (49) Karplus R, Luttinger J (1954) Hall effect in ferromagnetics. Phys Rev 95(5):1154–1160.
- (50) Zener C (1951) Interaction between the -shells in the transition metals. ii. ferromagnetic compounds of manganese with perovskite structure. Phys Rev 82(3):403–405.
- (51) Molina M (1998) Transport of localized and extended excitations in a nonlinear anderson model. Phys Rev B 58(19):12547–12550.
- (52) Nordheim L (1950) -decay and the nuclear shell model. Phys Rev 78(3):294.
- (53) Metzner W, Vollhardt D (1989) Correlated lattice fermions in dimensions. Phys Rev Lett 62(3):324–327.
- (54) Clauset A, Shalizi CR, Newman MEJ (2009) Power-law distributions in empirical data. SIAM Rev 51(4):661–703.
- (55) Garfield E (2006) The history and meaning of the journal impact factor. JAMA 295(1):90–93.
- (56) Garfield E (1972) Citation analysis as a tool in journal evaluation. Science 178(4060):471–479.
- (57) Garfield E (1999) Journal impact factor: A brief review. Can Med Assoc J 161(8):979–980.
Supporting Information
S1 Datasets
In this work, we use two large datasets, namely the American Physical Society (APS) and the Web of Science (WoS). APS contains papers published from to in APS journals and is publicly available upon request at http://journals.aps.org/datasets; WoS is comprised of papers published between and in journals covering most research fields, and is available upon purchase from Thomson Reuters. Most papers in the APS dataset are also in the WoS. The APS dataset, though, contains fewer citations: only those originating from papers within the APS journals are therein recorded. Our analysis is based on papers that received at least one citation. A total number of and such papers were found in the APS and WoS dataset, respectively. Fig. S1 shows the yearly number of papers with at least one citation received before the end of the observation period. The fact that recent papers have had less time to accumulate citations is reflected in the sharp decrease that is noticeable as time approaches the end of the observation period.
S2 Examples of top Sleeping Beauties
Figs. S2 and S3 show the citation history of the top 24 papers in the APS dataset. Table S1 presents the comparison between our results and Redner’s results Redner-110citation-2005-1 .
Fig. S4 displays the citation history of the top Sleeping Beauties in the WoS dataset showed in Table I of the main text. Tables S2, S3, and S4 present the basic information of the top Sleeping Beauties in Statistics, Mathematics, and Social Sciences and Humanities, respectively. See Figs. S5–S8 for corresponding citation histories.
S3 Characterizing Decreasing Patterns
This section presents a statistical characterization of how yearly citations of papers decrease after the peak. In summary, for most of the papers the yearly citation rate decreases quickly (possibly exponentially) after its peak. Our analysis focused only papers with positive beauty coefficient , for a total of (out of ; ) and (out of ; ) papers in the APS and WoS dataset, respectively. We further classify every of these papers into two categories depending on whether or not their yearly citation counts decreased to half of its maximum during the observation period (Figs. S9A-B).
We identify () papers in the APS whose have not decreased below , and () in the WoS dataset. Figs. S9C–D display the histograms of . We observe that a large fraction are recently awakening papers, with about of them getting their maximum yearly citations in the last year of the observation periods ().
For the remaining papers whose yearly citations have decreased below , we define the paper “half-life” as the number of years required by to decrease from to . Figs. S9E–H show the distributions of across all these papers in the APS (Fig. S9E), papers whose values ranked in the top (Fig. S9F), from to (Fig. S9G), and the rest (Fig. S9H). We see that yearly citations of SBs decrease rapidly after the peak regardless of their values. These results are confirmed also in the WoS dataset, as shown in Figs. S9I–L.
S4 Null Models
To verify that the beauty coefficients cannot be explained by the underlying citation networks or other well-known mechanisms, we compare the citation history of each paper as well as the beauty coefficient distribution with those obtained from some null models. Here we employ two null models on the APS dataset, namely citation network randomization (NR) and the preferential attachment mechanism (PA).
The NR procedure starts from the original citation network and carries out a series of link swapping. The end-point nodes (the papers being cited) of a randomly selected pair of links (citations) are swapped if: (i) the two links do not share source or target node; (ii) there are no multiple links after swapping; and, (iii) the publication year of the cited article is not greater than that of the citing article after swapping. Performing switches, where is the number of links in the citation network and is set to , yields a transformation of the original citation network into a random directed graph. This procedure preserves for each paper its number of references (out degree) and total number of citations (in degree), but destroys the dynamics of yearly citations.
PA considers as initial network the empirical APS citation network from to when the first citation occurred; it contains nodes and 1 link. In each following year until 2009, papers are added at the same time, and each paper brings references. is set to the number of APS papers actually published in year and each corresponds to the number of references of one of the papers in such set. As we progressively add papers to the citation network, the references they contain are addressed to previously published papers chosen with probability proportional to one plus the number of citations those papers already have.
S5 Coarse topics of Sleeping Beauties in the APS
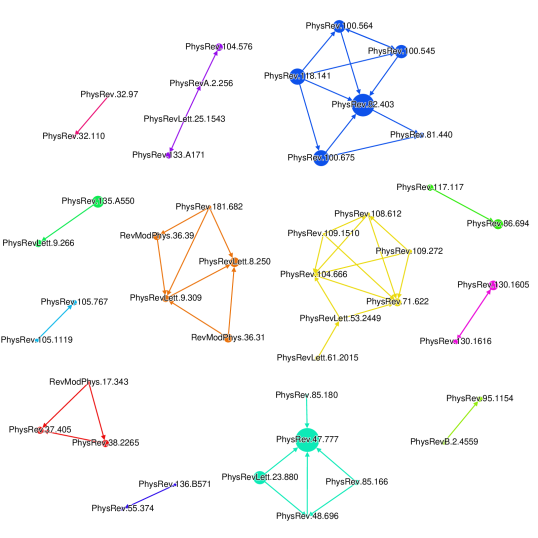
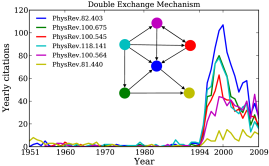
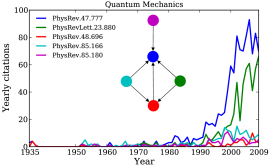
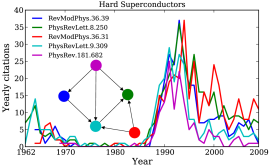
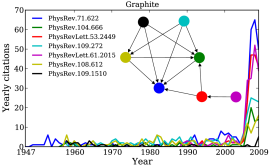
Examining the citation relationships between papers with high values gives us some coarse topics of Sleeping Beauties. In Fig. S10 we present the citation network of the 100 papers with the highest values in the APS dataset. Despite many isolated nodes, we observe some (weakly) connected components. Diving into each component, we find that each one corresponds to one coarse topic. In Fig. S11, for instance, we show the topic of each of the 4 largest components and the citation histories of its constituent papers. Except for Fig. S11(b), we observe that papers belonging to the same group exhibit remarkably similar citation histories. They are awoken in the same year and exhibit similar up- and down-going citation patterns. Fig. S11(a) shows the double exchange mechanism works. This theory was introduced in 1950s and became popular in the 1990s. The second group shown in Fig. S11(b) is about Quantum Mechanics. The central paper (blue line and blue node), which is cited by every other paper in the group, is the famous EPR paradox paper by Einstein, Podolsky, and Rosen. The third group shown in Fig. S11(c) is particularly interesting, as it exhibits complex fluctuations in the citation histories. Finally, the group shown in Fig. S11(d) is about graphite and graphene. The central paper (blue line and blue node) in Fig. S11(d) is a pioneering work on the band structure of graphite, foundation of the discovery of graphene, the subject of the 2010 Nobel Prize in Physics.
| Publication | Rank | Awakening | |
|---|---|---|---|
| PR 40, 749 (1932) | 45 | 250.79 | 1980 |
| PR 46, 1002 (1934) | 54 | 237.40 | 1975 |
| PR 47, 777 (1935) | 2 | 1419.15 | 1987 |
| PR 56, 340 (1939) | 96 | 174.59 | 1987 |
| PR 82, 403 (1951) | 1 | 1722.25 | 1994 |
| PR 82, 664 (1951) | 192 | 122.56 | 2007 |
| PR 100, 545 (1955) | 4 | 1106.82 | 1994 |
| PR 100, 564 (1955) | 8 | 670.42 | 1994 |
| PR 100, 675 (1955) | 3 | 1348.26 | 1994 |
| PR 109, 1492 (1958) | 147 | 138.63 | 2004 |
| PR 115, 485 (1959) | 218 | 115.07 | 2001 |
| PR 118, 141 (1960) | 6 | 841.47 | 1994 |
| Author | Title | Pub., awake | Journal | |
| 3978 | Pearson, K | On lines and planes of closest fit to systems of points in space | 1901, 2002 | Philos. Mag. |
| 2736 | Wilson, EB | Probable inference, the law of succession, and statistical inference | 1927, 1999 | J. Am. Statist. Assoc. |
| 1909 | Mann, HB | Nonparametric tests against trend | 1945, 2003 | Econometrica |
| 1893 | Kaplan, EL; | Nonparametric estimation from incomplete observations | 1958, 1980 | J. Am. Statist. Assoc. |
| Meier, P | ||||
| 1760 | Fisher, RA | On the interpretation of from contingency tables, | 1922, 2006 | J. R. Stat. Soc. |
| and the calculation of | ||||
| 1247 | Hastings, WK | Monte-carlo sampling methods using markov chains and | 1970, 1995 | Biometrika |
| their applications | ||||
| 1193 | Metropolis, N | The monte carlo method | 1949, 2004 | J. Am. Statist. Assoc. |
| 1124 | Moran, PAP | Notes on continuous stochastic phenomena | 1950, 1999 | Biometrika |
| 1050 | Lorenz, MO | Methods of measuring the concentration of wealth | 1905, 2005 | J. Am. Statist. Assoc. |
| 985 | Kendall, MG | A new measure of rank correlation | 1938, 2004 | Biometrika |
| Author | Title | Pub., awake | Journal | |
| 1215 | Wiener, N | The homogeneous chaos | 1938, 2001 | Amer. J. Math. |
| 1060 | Leray, J | On the movement of a viscous fluid to fill the space | 1934, 1995 | Acta Math. |
| 851 | Pringsheim, A | On the theory of the double infinite numerical orders | 1900, 2005 | Math. Ann. |
| 765 | Jensen, JLWV | On the convex functions and inequalities between mean values | 1906, 2006 | Acta Math. |
| 706 | Mann, WR | Mean value methods in iteration | 1953, 2004 | Proc. Am. Math. Soc. |
| 670 | Halpern, B | Fixed points of nonexpanding maps | 1967, 2004 | Bull. Amer. Math. Soc. |
| 669 | Haar, A | On the theory of orthogonal function systems (first announcement) | 1910, 1988 | Math. Ann. |
| 609 | Weyl, H | The asymptotic dispersal law of eigen values of linear partial equations | 1912, 2002 | Math. Ann. |
| differential (with an application for the theory of cavity radiation) | ||||
| 578 | Painleve, P | About second order and higher order differential equations whose | 1902, 1990 | Acta Math. |
| general integral is uniform | ||||
| 558 | Schmidt, E | On the theory of linear and non-linear integral equations chapter i | 1907, 1992 | Math. Ann. |
| development of random functions in specific systems |
| Author | Title | Pub., awake | Journal | |
| 1901 | Stroop, JR | Studies of interference in serial verbal reactions | 1935, 1987 | J. Exp. Psychol. |
| 1255 | Yerkes, RM; | The relation of strength of stimulus to rapidity of habit-formation | 1908, 1981 | J. Comp. Neurol. |
| Dodson, JD | ||||
| 584 | Zachary, WW | Information flow model for conflict and fission in small groups | 1977, 2005 | J. Anthropol. Res. |
| 563 | Tobler, WR | Computer movie simulating urban growth in Detroit region | 1970, 2003 | Econ. Geogr. |
| 545 | Garfield, E | Citation indexes for science - new dimension in documentation | 1955, 2000 | Science |
| through association of ideas | ||||
| 545 | Heider, F; | An experimental study of apparent behavior | 1944, 1998 | Am. J. Psychol. |
| Simmel, M | ||||
| 521 | Watson, JB | Psychology as the behaviorist views it | 1913, 1968 | Psychol. Rev. |
| 488 | Cohen, J | A coefficient of agreement for nominal scales | 1960, 2009 | Educ. Psychol. Meas. |
| 485 | Maslow, AH | A theory of human motivation | 1943, 1998 | Psychol. Rev. |
| 479 | Glaser, BG | The constant comparative method of qualitative analysis | 1965, 2004 | Social Problems |
| 467 | Todd TW | Age changes in the pubic bone | 1921, 2003 | Am. J. Phys. Anthropol. |
| 460 | Forrester, JW | Industrial dynamics - a major breakthrough for decision makers | 1958, 1993 | HBR |
| 453 | Rosenblatt, F | Perceptron - a probabilistic model for information storage and | 1958, 2001 | Psychol. Rev. |
| organization in the brain | ||||
| 446 | Hotelling, H | Analysis of a complex of statistical variables into principal components | 1933, 1994 | J. Educ. Psychol. |
| 428 | Thorndike, EL; | The influence of improvement in one mental function upon the | 1901, 1992 | Psychol. Rev. |
| Woodworth, RS | of efficiency other functions (I) | |||
| 424 | Holzinger, KJ; | The bi-factor method | 1937, 2003 | Psychometrika |
| Swineford, F | ||||
| 405 | Thistlethwaite, DL; | Regression-discontinuity analysis - | 1960, 2005 | J. Educ. Psychol. |
| Campbell, DT | an alternative to the ex-post-facto experiment | |||
| 399 | Horn, JL | A rationale and test for the number of factors in factor-analysis | 1965, 2000 | Psychometrika |
| 375 | Fisher, I | The debt-deflation theory of great depressions | 1933, 2004 | Econometrica |
| 369 | Spitzer, HF | Studies in retention | 1939, 2004 | J. Educ. Psychol. |
| 368 | Linn, BS; | Cumulative illness rating scale | 1968, 1999 | J Am Geriatr Soc. |
| Linn, MW; | ||||
| Gurel, L | ||||
| 358 | Hull, CL | The goal gradient hypothesis and maze learning | 1932, 2001 | Psychol. Rev. |
| 356 | Elftman, H; | Chimpanzee and human feet in bipedal walking | 1935, 2001 | Am. J. Phys. Anthropol. |
| Manter, J | ||||
| 349 | Fornell, C; | Evaluating structural equation models with unobservable variables and | 1981, 2004 | J. Marketing Res. |
| Larcker, DF | measurement error | |||
| 343 | Armstrong, JS; | Estimating nonresponse bias in mail surveys | 1977, 1998 | J. Marketing Res. |
| Overton, TS | ||||
| 342 | Wechsler, H | Toward neutral principles of constitutional-law | 1959, 1986 | Harv. Law Rev. |
| 324 | Cohen, J | Eta-squared and partial eta-squared in fixed factor anova designs | 1973, 2005 | Educ. Psychol. Meas. |
| 324 | Dunlap, K | Reactions to rhythmic stimuli, with attempt to synchronize | 1910, 1995 | Psychol. Rev. |
| 320 | Ellsberg, D | Risk, ambiguity, and the savage axioms | 1961, 2002 | Q. J. Econ. |
| 320 | Lewin, K | Defining the ‘field at a given time’ | 1943, 2006 | Psychol. Rev. |
| Subject category | Range of |
|---|---|
| physics, multidisciplinary | [90.56, 5922.97] |
| chemistry, multidisciplinary | [90.57, 10769.06] |
| multidisciplinary sciences | [90.54, 3892.49] |
| mathematics | [90.62, 1215.38] |
| medicine, general & internal | [90.58, 1522.30] |
| physics, applied | [90.63, 3978.42] |
| surgery | [90.57, 799.65] |
| chemistry, inorganic & nuclear | [90.55, 1333.20] |
| statistics & probability | [90.56, 2736.18] |
| mechanics | [90.56, 3978.42] |
| biology | [90.68, 1247.13] |
| ecology | [90.60, 1792.29] |
| physics, condensed matter | [90.58, 3978.42] |
| biochemistry & molecular biology | [90.62, 839.22] |
| astronomy & astrophysics | [90.56, 984.81] |
| physics, atomic, molecular & chemical | [90.60, 774.23] |
| neurosciences | [90.59, 633.23] |
| materials science, multidisciplinary | [90.63, 3978.42] |
| plant sciences | [90.54, 1199.00] |
| engineering, chemical | [90.60, 2962.53] |
References
- (1) P. Anderson and H. Hasegawa. Considerations on double exchange. Phys. Rev., 100:675–681, Oct 1955.
- (2) P. de Gennes. Effects of double exchange in magnetic crystals. Phys. Rev., 118:141–154, Apr 1960.
- (3) G. Dresselhaus. Spin-orbit coupling effects in zinc blende structures. Phys. Rev., 100:580–586, Oct 1955.
- (4) A. Einstein, B. Podolsky, and N. Rosen. Can quantum-mechanical description of physical reality be considered complete? Phys. Rev., 47:777–780, May 1935.
- (5) P. Fulde and R. Ferrell. Superconductivity in a strong spin-exchange field. Phys. Rev., 135:A550–A563, Aug 1964.
- (6) M. Girvan and M. E. J. Newman. Community structure in social and biological networks. Proceedings of the National Academy of Sciences, 99(12):7821–7826, 2002.
- (7) J. Goodenough. Theory of the role of covalence in the perovskite-type manganites . Phys. Rev., 100:564–573, Oct 1955.
- (8) S. Redner. Citation statistics from 110 years of physical review. Physics Today, 58(6):49–54, 2005.
- (9) P. Wallace. The band theory of graphite. Phys. Rev., 71:622–634, May 1947.
- (10) E. Wollan and W. Koehler. Neutron diffraction study of the magnetic properties of the series of perovskite-type compounds . Phys. Rev., 100:545–563, Oct 1955.
- (11) W. W. Zachary. An information flow model for conflict and fission in small groups. Journal of Anthropological Research, 33(4):452–473, 1977.
- (12) C. Zener. Interaction between the -shells in the transition metals. ii. ferromagnetic compounds of manganese with perovskite structure. Phys. Rev., 82:403–405, May 1951.