1505.01065
The Minimum Spanning Tree of Maximum Entropy
Abstract
In computer vision, we have the problem of creating graphs out of unstructured point-sets, i.e. the data graph. A common approach for this problem consists of building a triangulation which might not always lead to the best solution. Small changes in the location of the points might generate graphs with unstable configurations and the topology of the graph could change significantly. After building the data-graph, one could apply Graph Matching techniques to register the original point-sets. In this paper, we propose a data graph technique based on the Minimum Spanning Tree of Maximum Entropty (MSTME). We aim at a data graph construction which could be more stable than the Delaunay triangulation with respect to small variations in the neighborhood of points. Our technique aims at creating data graphs which could help the point-set registration process. We propose an algorithm with a single free parameter that weighs the importance between the total weight cost and the entropy of the current spanning tree. We compare our algorithm on a number of different databases with the Delaunay triangulation.
1 Introduction
The problem of point-set registration often involves the construction of the so-called data graph [4, 7], which is the graph created out of unstructured point-sets. One possibility for registering point-sets using graphs is to formulate the problem as Graph Matching [12]. We are interested in exploiting some topological properties of data graphs which would alleviate the registration procedure. For instance, we could design a data-graph which would decrease the search space when matching points.
The Iterative Closest Point (ICP) algorithm [3] is a powerful solution for the registration of point-sets. Such an algorithm would try to find for each point in one set the closest point in the other set. Therefore, we could avoid checking all points if we have some prior knowledge. For instance, if we could state that the point we would like to match has a certain degree value, we could evaluate only the points which match this criteria and greatly reduce the search space for the registration. This would be true for a non regular data-graph 111A graph in which all nodes have the same degree value., otherwise we would still need to search the whole space of points.
We would like to obtain a graph with high variability in the degree distribution. This high variability can be encoded by the entropy of the degree distribution. In [5], we have performed the registration of point-sets via the Min-Weight Max-Entropy problem in which the generated edge-induced subgraph had the maximum entropy. In this work, we constrain our edge-induced subgraph to be a tree. Our problem is called the Minimum Spanning Tree with Maximum Entropy (MSTME). By minimizing the total edge weight, we can allow some robustness of the data graph with respect to small deviations of the points, by maximizing the entropy, we increase the variability of the degree distribution which could later ease the registration process. We evaluate the current approach under different levels of noise and compare the stability of the data-graph with a Delaunay triangulation.
The remainder of this paper is organized as follows: The related work is presented in Section 2. Section 3 discusses our objective function and explains how the entropy is measured in the graph. Our optimization strategy is explained in details in Section 4. Our experimental setup is disclosed in Section 5. Our conclusions and future work are available in Section 6.
2 Related Work
A data graph can be obtained in a variety of ways, it is common to use the Delaunay triangulation for the registration of point-sets [4, 7, 6]. The Delaunay triangulation is based on the condition that no other point should lie inside the circumcircle of any triangle. It is the dual of the Voronoi diagram which partitions the embedding space into regions closest to the point set. In this work, we are working on suitable alternatives which would allow more stability during the registration.
Our cost function is built upon a Minimum Spanning Tree formulation and entropy maximization. In this sense, our work is closely related to [8] as the authors also formulate an optimization problem focusing on the entropy of a Minimum Spanning Tree. However, they are dealing with a different problem by proposing an entropy estimator for clustering. In our work, we are interested on the data graph construction problem and our cost function differs from theirs since our entropy is calculated on the degree distribution of the generated MST while they estimate the data entropy based on the length of the spanning tree.
Our problem can also be seen as a bi-criteria optimization problem. Ravi and Goemans [10] proposed a Lagrangian relaxation to solve the constrained minimum spanning tree problem, which is also a bi-criteria optimization proven to be NP-Hard by Aggarwal et al. [1]. Neighborhood search and adjacency search heuristics for the bicriterion minimum spanning tree problem were proposed by Andersen et al. [2].
3 Objective Function
In order to measure the diversity found in the degree distribution, we can calculate the Shannon entropy () for a graph as follows:
| (1) |
where is the probability of finding a node with a degree of among all distinct degree values ( is the set of distinct degree values of ). The entropy measures the uncertainty associated with a random variable. As defined in Eq. 1, a high entropy of a graph would indicate a high “variability” in the distribution of nodes . The converse is also true, a low entropy means low variability, as in a -regular graph whose probability and .
Given a point-set , we calculate the distance from each point to all the other points and store those distances in . This generates a complete graph . We seek to find a vector in such a way that when , we add to our graph. We can formulate our cost function simply as:
| (2) | ||||||
| subject to | ||||||
where is an edge-induced subgraph from vector . is a parameter which weighs the importance between the two terms: minimizing the total edge and maximizing the graph entropy. The first constraint states that we have a discrete problem, i.e. we either add an edge () or we do not add it. The second constraint is a necessary condition for our graph to be a tree, however, we need the third constraint to force the graph to be connected.
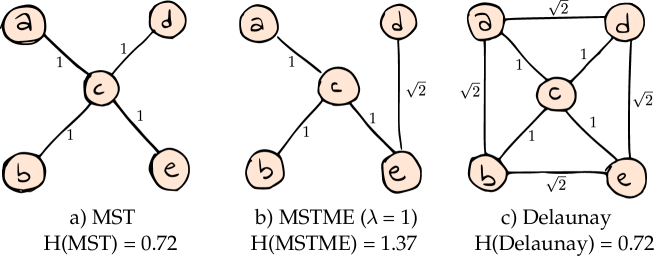
Figure 1 displays three different graphs of the same point-set . The first graph (Figure 1a) is simply a Minimum Spanning Tree (MST) whose cost is . It could be obtained by setting and therefore the entropy part vanishes from Equation 2. The second graph (Figure 1b) now considers , a higher entropy would be able to decrease the cost of solution in comparison with the MST, the cost is c(MSTME,) = 3.04. Notice that although the edge weight cost is higher, the total cost was decreased due to the higher entropy. Finally, we show in contrast that calculating a Delaunay triangulation yields an entropy as high as the MST one.
4 Optimization for the MSTME Problem
Our optimization is based on the following strategy: we pose the MSTME as a capacity problem with respect to the edge set. At each iteration, we increase the capacity of the edges, and we add the one whose cost is minimum based on our cost function which evaluates the weight and entropy of the current generated MST.
The input is a complete graph composed of the point-set as the vertices and the edges are weighted according to the Euclidean distance. For each edge , we check if the subgraph induced by our vector contains a cycle by the addition of such an edge, in which case, we discard (line 8). Otherwise, we calculate the new cost obtained by the weight of and we estimate the entropy of the MST (line 12). In line 16, we remove this edge from our graph and continuing searching within the same capacity for an edge which could yield a smaller cost. At the end, we add the edge with the best cost an increase the capacity of our MST up to (line 17).
5 Experiments
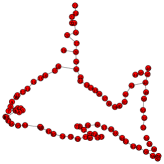
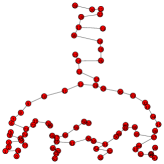
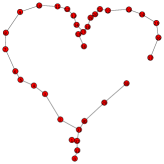
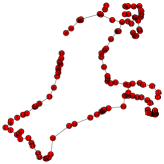
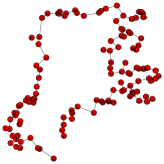
Our experimental section focus on evaluating the stability of our algorithm on point-sets sampled from the silhouette of objects. Figure 2 shows some point-sets connected using the MSTME. It is noticeable that the entropy takes over in thin areas, i.e. the degree values of the points are higher in regions such as the top of the fish, the feet of the dog, while other regions follow the silhouette of the object, since it is too costly to make an edge cross the shape of the object.
 |
|
 |
|
Our noise experiment is built upon the shortest pairwise distance () in the point-set. Then, we perburb each point by a length and an angle , where , and the radius and varies from , e.g. means that each point of the dataset was perturbed within a radius of 5 times the shortest pairwise distance in the graph. Certainly, the higher the noise, the lower the stability of the algorithms will be.
|
|
|
|
|---|---|---|---|
| Noise up to | Noise up to | Noise up to | Noise up to |
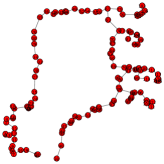
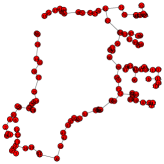
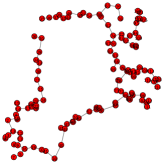
Figure 3 shows the impact of noise in the point-sets varying according to in a cow silhouette. It is not an easy task even for humans to match such points (e.g. feet). It is worth mentioning that as the algorithm searches for the optimal, it has to decide on which edges to take, therefore, a simple wrong edge will cause a much higher impact on the results when compared with Delaunay triangulation, which has many more edges.
As our algorithm outputs a tree, it cannot contain cycles, therefore, the silhouette will “break” in locations where the weights of the edges are high, and the split point will vary according to the noise. Notice that the split occurred in the face of the cow when noise level was but in level it happened at a different location.
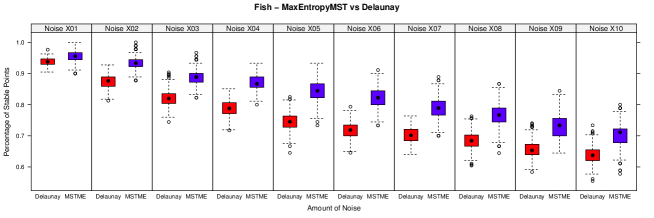
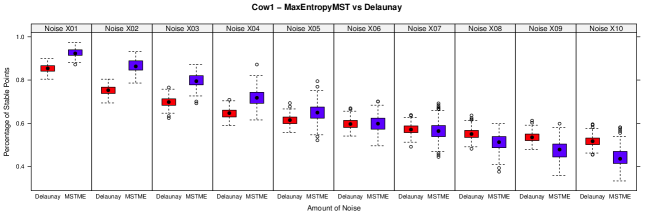
Figure 4 shows the quantitative analysis of stability between MSTME and Delaunay triangulation. The way we evaluate the stability is by calculating the percentage of edges which remained stable in all graphs within the same noise level. The first graph shows the results for the fish dataset222The fish dataset was obtained from the Coherent Point Drift [9].. The -axis displays the percentage of stable edges, e.g. 0.8 means that 80% of edges were found across all data-graphs within the same level. For this dataset, our algorithm for the MSTME was always more stable than the Delaunay triangulation up to the highest noise level. The boxplot displays several other types of information, such as the median, quartiles, etc. The instability observed was found on the thin parts of the fish, such as the dorsal and caudal fins. The second plot shows the results on the cow1 dataset333the cow1 dataset was obtained from the kimia99 dataset [11].
We observed that the MSTME was, in general, more stable than the Delaunay algorithm. Small variations in the location of the nodes affected the triangulation more than it affected the MSTME. As the triangulation generates many more edges, a single wrong edge will have a high impact on the results of the MSTME. Nevertheless, it was still able to obtain higher stability than Delaunay up to a certain level of noise.
6 Conclusions
In this paper, we proposed a data-graph technique by searching for a tree whose cost is minimum regarding the total edge weight and maximum regarding entropy of the degree distribution. We called this problem the Minimum Spanning Tree of Maximum Entropy (MSTME). In point-sets sampled from the silhouette of an object, we observed that points lying in thin areas were often unstable when there was noise. After analyzing and comparing the robustness of the generated graph, we notice that the data-graph generated by the MSTME was more stable than the one by the Delaunay triangulation.
In the future, we would like to propose an approximation algorithm which could guarantee bounds on the MSTME problem. Moreover, we will apply this data-graph in a framework similar to ICP and evaluate the accuracy of the results obtained as well as comparing the results using other data-graph techniques.
Acknowledgments
The first author of this paper is financially supported by the Vienna PhD School of Informatics.
References
- Aggarwal et al. [1982] V. Aggarwal, Y.P. Aneja, and K.P.K. Nair. Minimal spanning tree subject to a side constraint. Computers & Operations Research, 9(4):287 – 296, 1982. ISSN 0305-0548.
- Andersen et al. [1996] Kim Allan Andersen, Kurt Jőrnsten, and Mikael Lind. On bicriterion minimal spanning trees: An approximation. Computers & Operations Research, 23(12):1171 – 1182, 1996. ISSN 0305-0548.
- Besl and McKay [1992] P.J. Besl and Neil D. McKay. A method for registration of 3-d shapes. IEEE Transactions on Pattern Analysis and Machine Intelligence, 14(2):239–256, 1992. ISSN 0162-8828.
- Cross and Hancock [1998] A. D J Cross and E.R. Hancock. Graph matching with a dual-step em algorithm. IEEE Transactions on Pattern Analysis and Machine Intelligence, 20(11):1236–1253, 1998. ISSN 0162-8828.
- de Sousa and Kropatsch [2015a] Samuel de Sousa and Walter G. Kropatsch. Data graph formulation as the minimum-weight maximum-entropy problem. In Cheng-Lin Liu, Bin Luo, Walter G. Kropatsch, and Jian Cheng, editors, Graph-Based Representations in Pattern Recognition, volume 9069 of Lecture Notes in Computer Science, pages 13–22. Springer International Publishing, 2015a. ISBN 978-3-319-18223-0.
- de Sousa and Kropatsch [2015b] Samuel de Sousa and Walter G. Kropatsch. Graph-based point drift: Graph centrality on the registration of point-sets. Pattern Recognition, 48(2):368 – 379, 2015b. ISSN 0031-3203.
- Luo and Hancock [2002] B. Luo and E.R. Hancock. Iterative procrustes alignment with the EM algorithm. Image and Vision Computing, 20(5 – 6):377 – 396, 2002. ISSN 0262-8856.
- Műller et al. [2012] Andreas C. Műller, Sebastian Nowozin, and Christoph H. Lampert. Information theoretic clustering using minimum spanning trees. In Axel Pinz, Thomas Pock, Horst Bischof, and Franz Leberl, editors, Pattern Recognition, volume 7476 of Lecture Notes in Computer Science, pages 205–215. Springer Berlin Heidelberg, 2012. ISBN 978-3-642-32716-2.
- Myronenko and Song [2010] Andriy Myronenko and Xubo Song. Point Set Registration: Coherent Point Drift. IEEE Transactions on Pattern Analysis and Machine Intelligence, 32(12):2262–2275, December 2010. ISSN 0162-8828.
- Ravi and Goemans [1996] R. Ravi and M.X. Goemans. The constrained minimum spanning tree problem. In Rolf Karlsson and Andrzej Lingas, editors, Algorithm Theory – SWAT’96, volume 1097 of Lecture Notes in Computer Science, pages 66–75. Springer Berlin Heidelberg, 1996. ISBN 978-3-540-61422-7.
- Sharvit et al. [1998] Daniel Sharvit, Jacky Chan, Hüseyin Tek, and Benjamin B. Kimia. Symmetry-based indexing of image databases. Journal of Visual Communication and Image Representation, 9(4):366–380, December 1998.
- Vento [2013] Mario Vento. A one hour trip in the world of graphs, looking at the papers of the last ten years. In Walter G. Kropatsch, NicoleM. Artner, Yll Haxhimusa, and Xiaoyi Jiang, editors, Graph-Based Representations in Pattern Recognition, volume 7877 of Lecture Notes in Computer Science, pages 1–10. Springer Berlin Heidelberg, 2013. ISBN 978-3-642-38220-8.