HerMES: Current Cosmic Infrared Background Estimates Can be Explained by Known Galaxies and their Faint Companions at †
Abstract
We report contributions to cosmic infrared background (CIB) intensities originating from known galaxies and their faint companions at submillimeter wavelengths. Using the publicly-available UltraVISTA catalog, and maps at 250, 350, and 500m from the Herschel Multi-tiered Extragalactic Survey (HerMES), we perform a novel measurement that exploits the fact that uncatalogued sources may bias stacked flux densities — particularly if the resolution of the image is poor — and intentionally smooth the images before stacking and summing intensities. By smoothing the maps we are capturing the contribution of faint (undetected in ) sources that are physically associated, or correlated, with the detected sources. We find that the cumulative CIB increases with increased smoothing, reaching , , and at 250, 350, and 500m at full width at half-maximum. This corresponds to a fraction of the fiducial CIB of , , and at 250, 350, and 500m, where the uncertainties are dominated by those of the absolute CIB. We then propose, with a simple model combining parametric descriptions for stacked flux densities and stellar mass functions, that emission from galaxies with log( can account for the most of the measured total intensities, and argue against contributions from extended, diffuse emission. Finally, we discuss prospects for future survey instruments to improve the estimates of the absolute CIB levels, and observe any potentially remaining emission at .
Subject headings:
cosmology: observations, submillimeter: galaxies – infrared: galaxies – galaxies: evolution – large-scale structure of universe1. Introduction
Of all the light that has been emitted by stars, about half has been absorbed by interstellar dust and thermally re-radiated at far-infrared to submillimeter wavelengths, appearing as a diffuse, extragalactic, cosmic infrared background spanning 1–1000m (CIB; Hauser & Dwek, 2001; Dole et al., 2006). Statistically characterizing the sources responsible for this background is necessary to gain a full understanding of galaxy formation and cosmology, and thus remains an ongoing pursuit.
The CIB was first detected in spectroscopy with the Far Infrared Absolute Spectrophotometer (FIRAS; Puget et al., 1996; Mather et al., 1999). Observations of local starburst galaxies with the Infrared Astronomical Satellite (IRAS; Soifer et al., 1984) showed that galaxies could emit a surprisingly large part of their energy in the far-infrared, and ground-based measurements later confirmed the existence of a rare population of extremely luminous submillimeter galaxies (or SMGs; Blain et al., 2002). While these bright objects generated tremendous excitement, and in fact constitute a significant fraction of the total star-formation rate density at (e.g., Le Floc’h et al., 2005; Murphy et al., 2011), their low abundance only accounts for a small fraction of the total CIB.
The arrival of the Herschel Space Observatory — whose instruments, PACS (70, 100, and 160m; Poglitsch et al., 2010) and SPIRE (250, 350, and 500m; Griffin et al., 2010), bracket the peak of the thermal spectrum of dust emission — brought the promise of directly detecting less luminous and far more numerous dusty star-forming galaxies (DSFGs). However, source confusion resulting from the relatively large point-spread functions (e.g., Nguyen et al., 2010) limited the number of galaxies that could be individually resolved by PACS at 100 and 160m to 75% (Magnelli et al., 2013) and 74% (Berta et al., 2011) of the CIB, respectively, and by SPIRE at 250m to 15% (Béthermin et al., 2012; Oliver et al., 2012). Statistical methods including stacking (e.g., Béthermin et al., 2012; Viero et al., 2013a) and P(D) (Glenn et al., 2010; Berta et al., 2011) performed better, resolving 70% at 250, 350, and 500m for the former, and 89% and 70% of the CIB at 100 and 250m for the latter, respectively.
The origin of the rest remained unclear. Viero et al. (2013a) suggested that the missing flux could be tied up in faint sources — faint either because they are low mass, at high redshift, or extremely dusty. Another possible source is diffuse emission from the dust that is known to be distributed in the halos of galaxies (Ménard et al., 2010; Hildebrandt et al., 2013), and could be heated by stripped stars (e.g., Tal & van Dokkum, 2011; Zemcov et al., 2014).
Here we present a technique to demonstrate that most, if not all, of the CIB can be accounted for by the combined emission from galaxies detected in current near-infrared surveys, and their faint companion objects, at . We show with a simple model that galaxies alone are the most plausible source of this signal, and argue that any remaining CIB likely originates from galaxies at still higher redshifts.
2. Data
2.1. UltraVISTA Catalog
We perform our analysis on catalogs and images located in the COSMOS field (Scoville et al., 2007), centered at . We use the -selected, publicly-available111http://www.strw.leidenuniv.nl/galaxyevolution/ULTRAVISTA catalog from Muzzin et al. (2013b, UltraVISTA), which consists of a subset of the full COSMOS field, where both near-infrared and optical wavelengths are available (30 bands in all). The catalog contains photometric redshifts computed with EAZY (Brammer et al., 2008), and stellar masses computed with FAST (Kriek et al., 2009). Galaxies are split into star-forming or quiescent based on their positions in the rest-frame vs. color-color diagram (UVJ; Williams et al., 2009).
2.2. Herschel/HerMES Submillimeter Maps
We use submillimeter maps observed with the Spectral and Photometric Imaging REceiver (SPIRE; Griffin et al., 2010) at 250, 350, and 500m from the Herschel Multi-tiered Extragalactic Survey (HerMES; Oliver et al., 2012). COSMOS is a level 5 field, consisting of 4 repeat observations, to an instrumental depth of 15.9, 13.3, and 19.1 mJy (5), with confusion adding an additional noise term of 24.0, 27.5, and 30.5 mJy (5) at 250, 350, and 500m, respectively (Nguyen et al., 2010). Absolute calibration is detailed in Griffin et al. (2013), with calibration uncertainties of . Maps are made with 4 arcsec pixels at all wavelengths using the SMAP (Levenson et al., 2010; Viero et al., 2013b) pipeline.
SPIRE maps are chosen specifically for this study because its wavelengths probe the rest-frame peak of thermal dust emission at –3 (Madau & Dickinson, 2014), and because large-scale features can be reconstructed with minimal filtering (Pascale et al., 2011).
3. Method
We now present a novel method to estimate the extent to which known sources and their faint companions contribute to the CIB. We do this by exploiting an inherent weakness of stacking: that stacking on images with poor angular resolution can result in a boosted (or biased) average flux density arising from faint, uncatalogued, companion galaxies (e.g., Serjeant et al., 2008; Fernandez-Conde et al., 2010; Kurczynski & Gawiser, 2010; Heinis et al., 2013; Viero et al., 2013a). The trick is in recognizing that only correlated (i.e., clustered) sources will bias the stacked flux density (for an in-depth discussion see Marsden et al., 2009; Viero et al., 2013a), so that summed intensities estimated with increasingly smoothed maps places limits on the full intensity in a given redshift range. Meanwhile, emission that is not correlated — say, emission coming from sources at redshifts greater than those of our catalog objects — will not influence the primary measurement, except as a potential noise term.
For this analysis we use the publicly-available simstack code222http://www.stanford.edu/~viero/downloads.html, which is described in detail in Viero et al. (2013a). Briefly, synthetic images of the sky are constructed from correlated subsets of catalogs (i.e., objects in the same redshift range) with the assumption that galaxies that are physically similar — in this case quiescent or star-forming galaxies within a stellar mass bin — have comparable infrared luminosities and submillimeter flux densities. Synthetic images are then convolved with the PSF of the instrument, and are fit simultaneously to the actual sky map to retrieve the mean flux densities of the subsample.
To induce a bias we smooth the maps by convolving them with Gaussians whose widths are the geometric differences of the nominal SPIRE and effective beams, i.e., , where the nominal SPIRE resolutions are 17.5, 23.7, and 34.6 arcsec full width at half-maximum (FWHM) at 250, 350, and 500m, respectively, and the effective resolutions are 20, 30, 40, 60, 80, 110, 140, 180, 220, 260, and 300 arcsec FWHM. Above 300 arcsec, statistical uncertainties become consistent with zero (see Section 4). All synthetic images and sky maps are mean-subtracted before stacking.
Following Viero et al. (2013a) we split the sample into bins of redshift ( to 4 with ) and stellar mass (5 star-forming and 3 quiescent), and stack the subsamples with simstack at each smoothing scale. Stacked flux densities are then color-corrected to account for the observed spectral shape of the sources through the passbands, with temperatures taken from Viero et al. (2013a, Equation 18). Color corrections range between, 1.006–0.984, 0.993–0.977, and 1.007–0.991 at 250, 350, and 500m, respectively.
We use simulations to check that stacking and smoothing with a Gaussian, as opposed to the measured SPIRE beam or any other kernel, is a reasonable approximation, finding a bias of less than 4% for the largest smoothing kernel, which we include in the reported errors. We test that the method does not introduce unintended biases by performing 100 null tests for each set of synthetic images and maps. Null tests involve running the identical stacking pipeline with the same binning of sources, but after randomizing the positions of the sources in the catalogs. Because the map and images are mean-subtracted, we expect the stacked flux densities of the null tests to be consistent with zero. In Section 4 we show that this is the case.
We note that this method has the advantage that missing sources are not double-counted, meaning that the flux density from a single missing object will be distributed among the synthetic images, rather than appearing multiple times (as would be the case in thumbnail stacking). Also note that stacked flux densities are intentionally not corrected for completeness because it is precisely the flux densities of the missing (i.e., incomplete, but similarly applies to misclassified AGN or DSFGs) sources that we are attempting to measure by degrading the effective resolution of the map. As a result, this technique is not limited to CIB studies, but is applicable to any study where estimates of the level of faint, correlated emission are in question.
4. Results
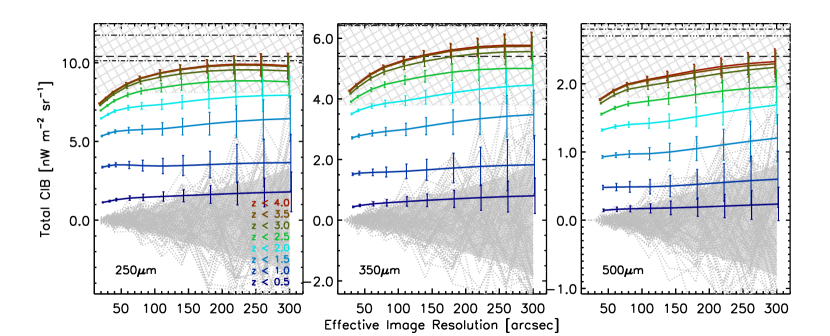
We report total intensities of our stacking measurement as the cumulative sum over redshift (from to the redshifts labeled with different color lines) vs. the effective resolution of the image, in Figure 1333Tabulated values for the intensities in Figure 1 can be found at https://web.stanford.edu/ṽiero/downloads.html. At lower redshifts () the fractional CIB that is measured increases weakly with increasing effective beam size, which is expected given that the completeness of the catalog at these redshifts is near unity for stellar masses log(. Conversely, at higher redshifts the fractional CIB that is measured increases rapidly with increased smoothing. The maximum CIB we resolve is , , at 250, 350, and 500m. We note slightly different behaviors between the three bands; particularly at 500m, which appears to have not converged, and may be indicative of higher redshift contributions to the CIB.
Estimates of the exact measured fraction of the absolute CIB are limited by the uncertainties in the reported absolute values of the CIB derived from FIRAS spectra by Fixsen et al. (1998) and Lagache et al. (1999), which range between 22% and 30%. The Fixsen et al. (1998) levels (, , ; hereafter chosen to represent the fiducial values) are shown as dashed lines in Figure 1, and the Lagache et al. (1999) levels (, , ) are shown as 3-dot-dashed lines. Additionally, Béthermin et al. (2012, dot-dashed lines) provide estimates of the total CIB by extrapolating their measured counts, finding they agreed with FIRAS with similarly large uncertainties. In total we find that the fraction of the Fixsen et al. (1998) fiducial CIB we resolve is , , and at 250, 350, and 500m, respectively.
The full set of 100 null tests at each effective beam size are shown as gray dotted lines in Figure 1, with the 1 limits represented by the shaded grey region. For clarity only the tests for are shown. As expected, the results of the null tests fluctuate around zero, with the magnitude of that fluctuation increasing with increasing effective beam size. Additional systematic uncertainties include calibration and beam area uncertainties, and cosmic variance, which is estimated following Moster et al. (2011).
5. Discussion
The CIB can be divided into three components: (i) the contribution from the sources in the parent catalog; (ii) the contribution from correlated companion sources that for some reason do not make the catalog cut but are recovered with our smoothing-stacking method; and (iii) uncorrelated emission, including and likely dominated by sources lying at .
It is interesting to consider the nature of (ii), the undetected sources that are captured by our smoothing procedure: are they very low-mass galaxies; massive but dusty galaxies that evade detection in current deep -selected catalogs; or some other unknown component?
We now propose — through a simple model that combines a parametric description of the stellar mass function with simple fits to nominal stacked flux densities — that the galaxies that make up the stellar mass function are alone able to describe our measurement, and that by extension the missing CIB can reasonably be attributed to galaxies in the low-mass end of the stellar mass function.
5.1. A Model of the CIB
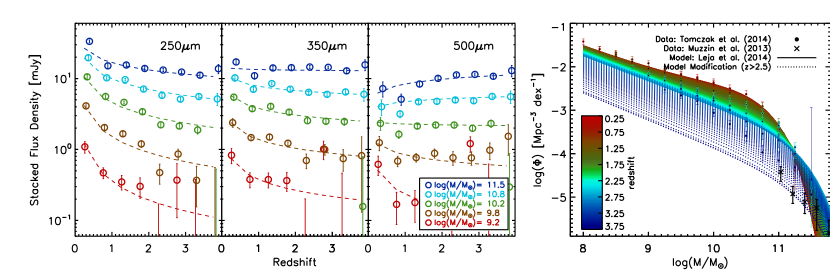
The first component of the model adopts the Leja et al. (2015, Equation 1) parameterization of the Tomczak et al. (2014) stellar mass function. The rightmost panel of Figure 2 illustrates the performance of the Leja et al. (2015) model (solid lines) against the Tomczak et al. (2014) data (circles). We find that it diverges from the measurements at higher redshifts and so we add a modification at (dotted lines) by simply interpolating between the model and the measured stellar mass functions of Muzzin et al. (2013a) to . We check that the exact value of faint-end slope at high- negligibly affects the integral, and set it to -1.6.
Similarly, the second component of the model consists of power-law fits to the stacked flux densities vs. lookback time for each stellar mass bin, with the added condition that the mass dependence of the slopes and offsets themselves follow smooth functions. The three left panels of Figure 2 show the stacked flux densities and best-fit power laws as open circles with error bars, and dotted lines, respectively. Finally, the model is integrated over the redshift range –4, and stellar mass range log(–14; although the contribution from galaxies below log( is found to be negligible.
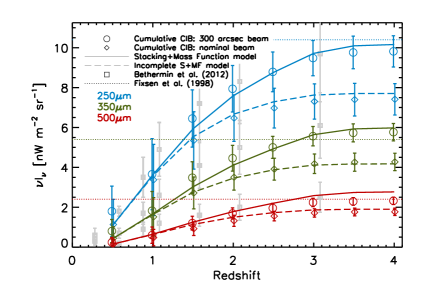
Figure 3 compares the resulting model (solid lines) with the full CIB measurements (open circles) at all three wavelengths. Note that model is not a fit, and yet describes the measurement remarkably well, demonstrating that the faint-end of the mass function can plausibly explain the recovered CIB. Also in good agreement are the Béthermin et al. (2012, gray squares) estimates derived through extrapolation of their number counts. We note some tension with the Planck Collaboration et al. (2014) intensity at 350m (), which is an output of their halo model fit to CIB power spectra; although their 550m estimate from the same model is in relative agreement ().
Also shown (as diamonds) are measurements made when stacking on the native SPIRE images (i.e., no smoothing). They are again compared to the model (dashed lines), but this time the model is modified so that the low-mass limit of the integral over the mass function effectively begins at higher masses with increasing redshift, reflecting the completeness behavior of the catalog. The difference between the solid and dashed lines can be interpreted as a measure of how much of the CIB originates from the parent sample, and how much is from companion sources not detected at this limit. If, for arguments sake, the catalog were 100% complete at all stellar masses and all redshifts, then the dashed and solid lines would overlap.
Arguments for additional, diffuse, sources of CIB; in particular dust in the extended halos of galaxies (Ménard et al., 2010), are thus disfavored.
5.2. A CIB beyond of 4?
While our measurements are consistent with the fiducial levels of the total CIB, the existing uncertainties on the absolute level are so large that it is difficult to convincingly estimate how much CIB is still unresolved. Any missing CIB is more likely to occur at longer wavelengths, which are more sensitive to higher redshifts (because of the negative -correction; Blain et al., 2003), from where we would expect uncorrelated emission to originate.
Indeed, several exceptional ULIRG-like galaxies have been identified at , albeit with low abundances (e.g., Riechers et al., 2013; Vieira et al., 2013; Dowell et al., 2014; Swinbank et al., 2014). However, extrapolations of the contribution of ULIRGs to the star-formation rate density at (e.g., Murphy et al., 2011; Viero et al., 2013a) points to them dominating the far-infrared emission at this epoch. Determining the relative levels that they and less luminous galaxies contribute is a key question going forward.
To resolve these high- questions, more data are required; particularly: i) an update of the absolute CIB; ii) deeper catalogs with stellar masses and redshifts to redshifts greater than 4; iii) submillimeter surveys (350 to 1000m) with large angular-scale fidelity and smaller PSFs in the regions of those deep catalogs — particularly at longer wavelengths which are more sensitive to galaxies at higher redshifts. The former can only be achieved with space-based missions to measure the DC level above atmospheric foregrounds. The second requirement is steadily growing from multiple current or upcoming efforts (e.g., SDSS/BOSS, CANDLES, DES, LSST), although the photometric redshifts for very dusty galaxies may remain quite uncertain (see Spitler et al., 2014). The last point will require a ground-based submillimeter observatory similar in scope to CCAT (Sebring et al., 2006).
6. Conclusion
We find that most of the CIB at 250, 350, and 500m can be accounted for by galaxies detected in current near-infrared surveys of moderate depth (), and galaxies correlated with them. We report total intensities of , , at 250, 350, and 500m, which corresponds to a fraction of the Fixsen et al. (1998) absolute CIB of , , and .
We find that a simple model combining parametric descriptions for the stellar mass function and stacked flux densities for log( and is able to convincingly reproduce the measurements, which supports the argument that the sources in the faint-end of the mass function make up the previously missing CIB. We note that emission from objects that are not in the catalog, and is either uncorrelated with catalog objects or exists at scales greater than 300 arcsec, would be missed. However unlikely, this cannot be ruled out without a better absolute measurement to compare against.
Finally, we propose that any remaining CIB likely originates from galaxies at , and if so should be detectable at submillimeter and millimeter wavelengths.
Acknowledgments
MPV warmly thanks Charlotte Clarke, Pete Hurley, Seb Oliver, and the University of Sussex for their hospitality during the development of this study; and Phil Hopkins for valuable discussions of the Universe. We also thank the anonymous referee, whose careful comments greatly improved this paper. SPIRE has been developed by a consortium of institutes led by Cardiff Univ. (UK) and including: Univ. Lethbridge (Canada); NAOC (China); CEA, LAM (France); IFSI, Univ. Padua (Italy); IAC (Spain); Stockholm Observatory (Sweden); Imperial College London, RAL, UCL-MSSL, UKATC, Univ. Sussex (UK); and Caltech, JPL, NHSC, Univ. Colorado (USA). This development has been supported by national funding agencies: CSA (Canada); NAOC (China); CEA, CNES, CNRS (France); ASI (Italy); MCINN (Spain); SNSB (Sweden); STFC, UKSA (UK); and NASA (USA). The SPIRE data for this paper were obtained as a part of proposal KPGT_soliver_1, with images made using the following OBSIDs: 1342222819-26, 1342222846-54, 1342222879-80, 1342222897-901.
References
- Berta et al. (2011) Berta, S., Magnelli, B., Nordon, R., Lutz, D., Wuyts, S., Altieri, B., Andreani, P., Aussel, H., et al. 2011, A&A, 532, A49
- Béthermin et al. (2012) Béthermin, M., Le Floc’h, E., Ilbert, O., Conley, A., Lagache, G., Amblard, A., Arumugam, V., Aussel, H., et al. 2012, A&A, 542, A58
- Blain et al. (2003) Blain, A. W., Barnard, V. E., & Chapman, S. C. 2003, MNRAS, 338, 733
- Blain et al. (2002) Blain, A. W., Smail, I., Ivison, R. J., Kneib, J.-P., & Frayer, D. T. 2002, Phys. Rep., 369, 111
- Brammer et al. (2008) Brammer, G. B., van Dokkum, P. G., & Coppi, P. 2008, ApJ, 686, 1503
- Dole et al. (2006) Dole, H., Lagache, G., Puget, J.-L., Caputi, K. I., Fernández-Conde, N., Le Floc’h, E., Papovich, C., Pérez-González, P. G., et al. 2006, A&A, 451, 417
- Dowell et al. (2014) Dowell, C. D., Conley, A., Glenn, J., Arumugam, V., Asboth, V., Aussel, H., Bertoldi, F., Béthermin, M., et al. 2014, ApJ, 780, 75
- Fernandez-Conde et al. (2010) Fernandez-Conde, N., Lagache, G., Puget, J.-L., & Dole, H. 2010, A&A, 515, A48
- Fixsen et al. (1998) Fixsen, D. J., Dwek, E., Mather, J. C., Bennett, C. L., & Shafer, R. A. 1998, ApJ, 508, 123
- Glenn et al. (2010) Glenn, J., Conley, A., Béthermin, M., Altieri, B., Amblard, A., Arumugam, V., Aussel, H., Babbedge, T., et al. 2010, MNRAS, 409, 109
- Griffin et al. (2010) Griffin, M. J., Abergel, A., Abreu, A., Ade, P. A. R., André, P., Augueres, J.-L., Babbedge, T., Bae, Y., et al. 2010, A&A, 518, L3
- Griffin et al. (2013) Griffin, M. J., North, C. E., Schulz, B., Amaral-Rogers, A., Bendo, G., Bock, J., Conversi, L., Conley, A., et al. 2013, MNRAS, 434, 992
- Hauser & Dwek (2001) Hauser, M. G. & Dwek, E. 2001, ARA&A, 39, 249
- Heinis et al. (2013) Heinis, S., Buat, V., Béthermin, M., Aussel, H., Bock, J., Boselli, A., Burgarella, D., Conley, A., et al. 2013, MNRAS, 429, 1113
- Hildebrandt et al. (2013) Hildebrandt, H., van Waerbeke, L., Scott, D., Béthermin, M., Bock, J., Clements, D., Conley, A., Cooray, A., et al. 2013, MNRAS, 429, 3230
- Kriek et al. (2009) Kriek, M., van Dokkum, P. G., Labbé, I., Franx, M., Illingworth, G. D., Marchesini, D., & Quadri, R. F. 2009, ApJ, 700, 221
- Kurczynski & Gawiser (2010) Kurczynski, P. & Gawiser, E. 2010, AJ, 139, 1592
- Lagache et al. (1999) Lagache, G., Abergel, A., Boulanger, F., Désert, F. X., & Puget, J.-L. 1999, A&A, 344, 322
- Le Floc’h et al. (2005) Le Floc’h, E., Papovich, C., Dole, H., Bell, E. F., Lagache, G., Rieke, G. H., Egami, E., Pérez-González, P. G., et al. 2005, ApJ, 632, 169
- Leja et al. (2015) Leja, J., van Dokkum, P. G., Franx, M., & Whitaker, K. E. 2015, ApJ, 798, 115
- Levenson et al. (2010) Levenson, L., Marsden, G., Zemcov, M., Amblard, A., Blain, A., Bock, J., Chapin, E., Conley, A., et al. 2010, MNRAS, 409, 83
- Madau & Dickinson (2014) Madau, P. & Dickinson, M. 2014, ARA&A, 52, 415
- Magnelli et al. (2013) Magnelli, B., Popesso, P., Berta, S., Pozzi, F., Elbaz, D., Lutz, D., Dickinson, M., Altieri, B., et al. 2013, A&A, 553, A132
- Marsden et al. (2009) Marsden, G., Ade, P. A. R., Bock, J. J., Chapin, E. L., Devlin, M. J., Dicker, S. R., Griffin, M., Gundersen, J. O., et al. 2009, ApJ, 707, 1729
- Mather et al. (1999) Mather, J. C., Fixsen, D. J., Shafer, R. A., Mosier, C., & Wilkinson, D. T. 1999, ApJ, 512, 511
- Ménard et al. (2010) Ménard, B., Scranton, R., Fukugita, M., & Richards, G. 2010, MNRAS, 405, 1025
- Moster et al. (2011) Moster, B. P., Somerville, R. S., Newman, J. A., & Rix, H.-W. 2011, ApJ, 731, 113
- Murphy et al. (2011) Murphy, E. J., Chary, R.-R., Dickinson, M., Pope, A., Frayer, D. T., & Lin, L. 2011, ApJ, 732, 126
- Muzzin et al. (2013a) Muzzin, A., Marchesini, D., Stefanon, M., Franx, M., McCracken, H. J., Milvang-Jensen, B., Dunlop, J. S., Fynbo, J. P. U., et al. 2013a, ApJ, 777, 18
- Muzzin et al. (2013b) Muzzin, A., Marchesini, D., Stefanon, M., Franx, M., Milvang-Jensen, B., Dunlop, J. S., Fynbo, J. P. U., Brammer, G., et al. 2013b, ApJS, 206, 8
- Nguyen et al. (2010) Nguyen, H. T., Schulz, B., Levenson, L., Amblard, A., Arumugam, V., Aussel, H., Babbedge, T., Blain, A., et al. 2010, A&A, 518, L5+
- Oliver et al. (2012) Oliver, S. J., Bock, J., Altieri, B., Amblard, A., Arumugam, V., Aussel, H., Babbedge, T., Beelen, A., et al. 2012, MNRAS, 424, 1614
- Pascale et al. (2011) Pascale, E., Auld, R., Dariush, A., Dunne, L., Eales, S., Maddox, S., Panuzzo, P., Pohlen, M., et al. 2011, MNRAS, 415, 911
- Planck Collaboration et al. (2014) Planck Collaboration, Ade, P. A. R., Aghanim, N., Armitage-Caplan, C., Arnaud, M., Ashdown, M., Atrio-Barandela, F., Aumont, J., et al. 2014, A&A, 571, A30
- Poglitsch et al. (2010) Poglitsch, A., Waelkens, C., Geis, N., Feuchtgruber, H., Vandenbussche, B., Rodriguez, L., Krause, O., Renotte, E., et al. 2010, A&A, 518, L2
- Puget et al. (1996) Puget, J.-L., Abergel, A., Bernard, J.-P., Boulanger, F., Burton, W. B., Desert, F.-X., & Hartmann, D. 1996, A&A, 308, L5+
- Riechers et al. (2013) Riechers, D. A., Bradford, C. M., Clements, D. L., Dowell, C. D., Pérez-Fournon, I., Ivison, R. J., Bridge, C., Conley, A., et al. 2013, Nature, 496, 329
- Scoville et al. (2007) Scoville, N., Aussel, H., Brusa, M., Capak, P., Carollo, C. M., Elvis, M., Giavalisco, M., Guzzo, L., et al. 2007, ApJS, 172, 1
- Sebring et al. (2006) Sebring, T. A., Giovanelli, R., Radford, S., & Zmuidzinas, J. 2006, in Society of Photo-Optical Instrumentation Engineers (SPIE) Conference Series, Vol. 6267, Society of Photo-Optical Instrumentation Engineers (SPIE) Conference Series, 2
- Serjeant et al. (2008) Serjeant, S., Dye, S., Mortier, A., Peacock, J., Egami, E., Cirasuolo, M., Rieke, G., Borys, C., et al. 2008, MNRAS, 386, 1907
- Soifer et al. (1984) Soifer, B. T., Rowan-Robinson, M., Houck, J. R., de Jong, T., Neugebauer, G., Aumann, H. H., Beichman, C. A., Boggess, N., et al. 1984, ApJ, 278, L71
- Spitler et al. (2014) Spitler, L. R., Straatman, C. M. S., Labbé, I., Glazebrook, K., Tran, K.-V. H., Kacprzak, G. G., Quadri, R. F., Papovich, C., et al. 2014, ApJ, 787, L36
- Swinbank et al. (2014) Swinbank, A. M., Simpson, J. M., Smail, I., Harrison, C. M., Hodge, J. A., Karim, A., Walter, F., Alexander, D. M., et al. 2014, MNRAS, 438, 1267
- Tal & van Dokkum (2011) Tal, T. & van Dokkum, P. G. 2011, ApJ, 731, 89
- Tomczak et al. (2014) Tomczak, A. R., Quadri, R. F., Tran, K.-V. H., Labbé, I., Straatman, C. M. S., Papovich, C., Glazebrook, K., Allen, R., et al. 2014, ApJ, 783, 85
- Vieira et al. (2013) Vieira, J. D., Marrone, D. P., Chapman, S. C., De Breuck, C., Hezaveh, Y. D., Wei, A., Aguirre, J. E., Aird, K. A., et al. 2013, Nature, 495, 344
- Viero et al. (2013a) Viero, M. P., Moncelsi, L., Quadri, R. F., Arumugam, V., Assef, R. J., Béthermin, M., Bock, J., Bridge, C., et al. 2013a, ApJ, 779, 32
- Viero et al. (2013b) Viero, M. P., Wang, L., Zemcov, M., Addison, G., Amblard, A., Arumugam, V., Aussel, H., Béthermin, M., et al. 2013b, ApJ, 772, 77
- Williams et al. (2009) Williams, R. J., Quadri, R. F., Franx, M., van Dokkum, P., & Labbé, I. 2009, ApJ, 691, 1879
- Zemcov et al. (2014) Zemcov, M., Smidt, J., Arai, T., Bock, J., Cooray, A., Gong, Y., Kim, M. G., Korngut, P., et al. 2014, Science, 346, 732