IS DUST CLOUD AROUND ORIONIS A RING OR A SHELL, OR BOTH?
Abstract
The dust cloud around Orionis is observed to be circularly symmetric with a large angular extent ( 8°). However, whether the three-dimensional (3D) structure of the cloud is shell- or ring-like has not yet been fully resolved. We study the 3D structure using a new approach that combines a 3D Monte Carlo radiative transfer model for ultraviolet (UV) scattered light and an inverse Abel transform, which gives a detailed 3D radial density profile from a two-dimensional column density map of a spherically symmetric cloud. By comparing the radiative transfer models for a spherical shell cloud and that for a ring cloud, we find that only the shell model can reproduce the radial profile of the scattered UV light, observed using the S2/68 UV observation, suggesting a dust shell structure. However, the inverse Abel transform applied to the column density data from the Pan-STARRS1 dust reddening map results in negative values at a certain radius range of the density profile, indicating the existence of additional, non-spherical clouds near the nebular boundary. The additional cloud component is assumed to be of toroidal ring shape; we subtracted from the column density to obtain a positive, radial density profile using the inverse Abel transform. The resulting density structure, composed of a toroidal ring and a spherical shell, is also found to give a good fit to the UV scattered light profile. We therefore conclude that the cloud around Ori is composed of both ring and shell structures.
Subject headings:
ISM: structure — ISM: bubbles — stars: individual (-Ori)1. INTRODUCTION
It has been reported that the O8 III star Orionis, a member of the Orion OB1 association (Murdin & Penston 1977), excites a fairly symmetric H II region Sh2-264 surrounding it (Sharpless & Osterbrock 1952; Sharpless 1959). The H II region is thought to be a good example of a classical Str mgren sphere, which is spherically symmetric and centered on Ori (Coulson et al. 1978; Maddalena & Morris 1987). Many observational studies have found dark clouds external to this H II region; the clouds appear to be circularly symmetric, with a large angular extent of about 8° (Wade, 1957, 1958; Court s 1972; Coulson et al. 1978; Maddalena & Morris 1987; Malone et al. 1987; Zhang et al. 1989; Lang et al. 2000) However, there has been a debate as to whether the symmetric appearance of the cloud is a projection effect of a “spherical” shell or is due to a “toroidal” ring.
Wade (1957) found an expanding, dense shell of neutral hydrogen surrounding the H II region. Using the star counts technique, Coulson et al. (1978) proposed that the dark clouds consist of two spherical shells: one outside of the H II region (an “outer” shell) and the other within the region (an “inner” shell). Their results, however, were obtained from only northeast quadrant observation and thus cannot represent the entire structure of the dark cloud system. Morgan (1980) obtained the optical properties (albedo and asymmetric scattering phase function ) of the dust clouds by comparing ultraviolet (UV) observations with results from a multiple scattering model based on the Monte Carlo radiative transfer method. They assumed a simple spherical dust shell, a central core, and a diffuse dust layer filling the space between the shell and the core, and found plausible results to support the idea that the cloud had a shell structure. Infrared Astronomical Satellite (IRAS) data on the dust clouds surrounding Ori was presented by Malone et al. (1987). The authors interpreted the dust clouds as a large expanding shell, which is fragmented into clumps. For the same IRAS data, Zhang et al. (1989) not only applied a more refined reduction technique, but also conducted a much more detailed analysis than was done in the previous study. Despite the cloud’s clear ring-like appearance, they concluded that a shell structure of the cloud provides a more consistent explanation for the infrared (IR) emission, especially the diffuse infrared (IR) features observed within the nebula.
Unlike the above interpretations, the CO survey revealed that the dust cloud surrounding Ori coincides well with a toroidal ring of molecular clouds (Maddalena & Morris 1987). The CO data showed a detailed structure of expanding molecular clouds: a ring-like structure composed of discrete cloud patches, having little molecular medium within the ring. In addition to the clear ring molecular cloud, Maddalena & Morris (1987) predicted the existence of an H I shell swept up by the expanding H II region, though this idea was mostly based on their theoretical models, which had certain assumptions. Over a decade later, Lang et al. (2000) provided a new CO map that had a significantly higher sensitivity and much larger area coverage than those of the previous map. The new survey not only confirmed the presence of the dense dark globules previously found by Maddalena & Morris (1987), but also revealed diffuse, low mass clouds, some of which extend to the inside of the ring. In spite of the diffuse medium and, consequently, the possibility of the existence of a shell, Lang et al. (2000) concluded that both the IRAS and CO data indicate that the H II region is surrounded by a remarkably complete ring.
The purpose of this paper is to understand the 3D structure of the dust clouds in the Ori system. Using a new approach that combines a 3D Monte Carlo radiative transfer model and the inverse Abel transform, we investigate whether the Ori nebula has a ring or a shell structure, or even both. In Section 2, we describe the data of the ultraviolet (UV) measurements and the dust reddening. Section 3 presents the results of a dust radiative transfer simulation for the shell and the ring models, and the calculation of the inverse Abel transform. The best-fit model for the structure of the Ori nebula is given in Section 4. We discuss, in Section 5, an integrated view of the nebula structure and the applicability of our new methodological approach to bubbles in the interstellar medium (ISM). A summary is presented in Section 6.
2. DATA
We use measurements of the Orion region obtained with the S2/68 ultraviolet sky-survey telescope (Boksenberg et al. 1973) in four wavebands (2740, 2350, 1950, and 1550 ) and compare the data with that obtained using the dust scattering models. More specifically, ratios of the observed UV surface brightness to the incident stellar flux, averaged over 0°.5 intervals of radius from Ori, are utilized (see Table 2 in Morgan 1980). The UV surface brightness, mainly attributed to light scattered by the dust cloud, was measured after subtracting terrestrial contributions and signals of geocoronal radiation and bright stars. Unfortunately, both the All-sky Imaging Survey (AIS) and the Medium Imaging Survey (MID) of the GALEX data (Morrissey et al. 2007), as well as the SPEAR/FIMS data (Seon et al. 2011), do not cover the entire target field. Although the S2/68 measurements were made several decades ago, these measurements were found to be adequate to investigate the 3D structure of the cloud.
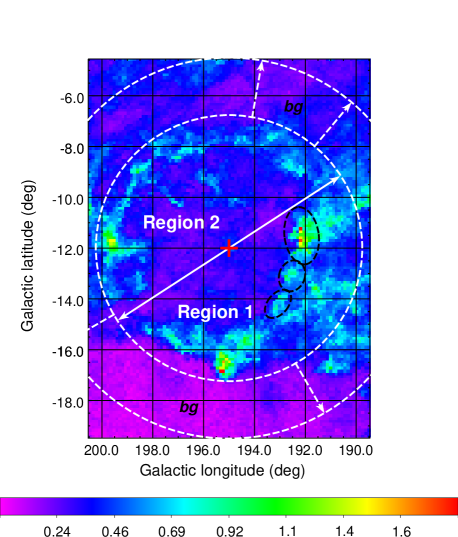
An extinction map of the Ori region was obtained from the Pan-STARRS1 data (Schlafly et al. 2014a). This survey map has an unprecedented resolution compared to that of earlier direct measurements of dust reddening and covers over three-quarters of the sky including our target field. The map for the Ori nebula region (Figure 1), assuming a ratio of total to selective extinction of (Fitzpatrick 1999), is used to derive a map of optical depth at visible wavelength. A column density map estimated from the optical depth is converted to a radial density profile using the inverse Abel transform method (Binney & Tremaine 2008). The technique is useful when the cloud is spherically symmetric and the dust density depends only on the radial distance from the cloud center.
3. TEST MODELS FOR SHELL OR RING STRUCTURE
A Monte Carlo radiative transfer code (MoCafe111http://kiseon.kasi.re.kr/MoCafe.html, Seon 2009; Seon & Witt 2012, 2013) is used to perform the dust scattering simulation of the UV scattered light. MoCafe is a fully 3D radiative transfer model, which takes into account multiple scattering. For the multiple dust scattering model, the Henyey–Greenstein scattering phase function, (Henyey & Greenstein 1941), is adopted:
| (1) |
The albedo and the scattering asymmetric factor define the scattering characteristics of the dust grains, where is the scattering angle of the incident photon. We also use the peeling-off technique (Yusef-Zadeh et al. 1984) to improve the quality of the resulting images. The code has been recently improved by adopting a fast ray traversal algorithm (Seon 2015; Amanatides & Woo 1987). Dust scattering is more efficient in UV light than in optical wavelengths. Even a region of the Ori nebula that is optically thin in visible produces an optical depth in UV light of approximately 1, and thus the scattered UV radiation, originating from the central O-type star Ori, can be easily detected in the nebula region (Morgan 1980).
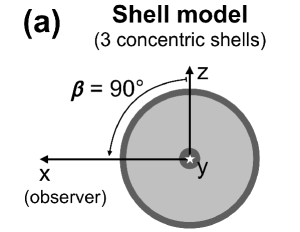
The advantage of using scattered light to study the 3D structure of clouds is that the dust scattering is strongly forward throwing at UV wavelengths (e.g., Witt et al. 1997; Draine 2003) and the scattered intensity is very sensitive to the dust structure in front of the light source. We conduct radiative transfer simulations for the shell and the ring models; we compare the results with those from UV observation in order to clearly demonstrate the presence of a shell structure. We assume three types of cloud geometry, shown in Figure 2. The details of the models and the results are described in the following subsections.
| Properties | Wavelength ( ) | |||
|---|---|---|---|---|
| 2740 | 2350 | 1950 | 1550 | |
| (shell1) | ||||
| (shell+ring1) | ||||
| (Morgan2) | ||||
| (shell1) | ||||
| (shel+ring1) | ||||
| (Morgan2) | 0.50 | 0.50 | 0.50 | 0.50 |
Notes. Albedo () and scattering asymmetry factor () of the dust grains in Ori nebula. References 1 and 2 refer to the present models and the Morgan (1980)’s shell model, respectively.
3.1. Shell Structure Model
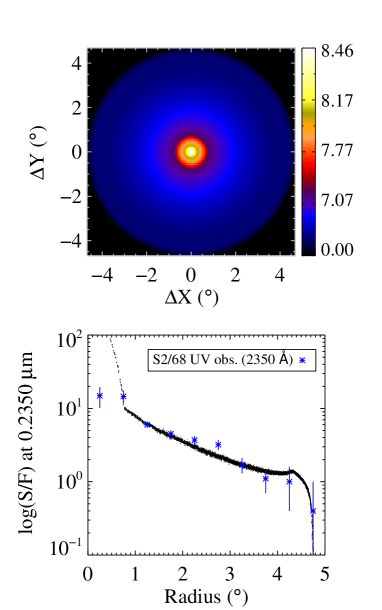
The structure of the shell model and the luminosity of the central source, located at a distance of 400 pc from the Earth (Murdin & Penston 1977), are defined following Morgan (1980). Morgan divided the nebula structure into three concentric spherical shells in accordance with the observed morphology: a central core cloud whose radius is 5 pc, an outer shell that has a thickness of 3 pc (radius 30 to 33 pc), and a diffuse medium located between the central core and the outer shell (Figure 2(a)). To calculate the density distribution of this simple model, the total extinction per unit length, determined by means of star counts at the band, is set at 0.086 mag/pc for the core, at 0.0028 mag/pc for the diffuse medium, and at 0.05 mag/pc for the outer shell (Coulson et al. 1978; Morgan 1980). In our simulation, these values per unit length are converted into values at four UV wavebands by using dust extinction cross-sections (Weingartner & Draine 2001; Draine 2003) for Milky Way dust. The results of the shell model at 2350 , using photons for the central source, are shown in Figure 3. Although the adopted model structure is simple, having only three intervals of density profile, the results accord fairly well with the observations and with Morgan’s results (1980). Model results at the other three UV bands show agreement within the observational errors as well.
The main difference between the Morgan’s results and ours for the shell model is that we obtained slightly higher albedos, as shown in Table 1. Morgan used the values from Allen (1973), in which the extinction cross-section is = cm2, independent of wavelength, and dust grain mass is g (see also Coulson et al., 1978). These values give a relatively higher dust density than that derived by the Milky Way dust model from Weingartner & Draine (2001); consequently, our model requires higher albedo to reproduce a level of scattered light close to that found in the observations.
3.2. Ring Structure Model
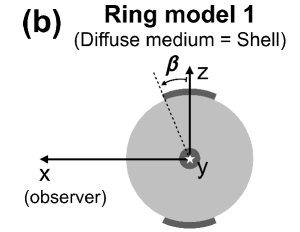
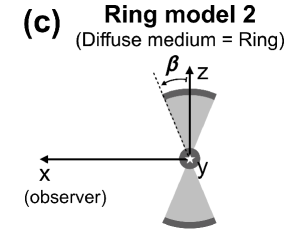
We define two additional ring models as shown in Figures 3(b) and (c). In these models, we introduced an opening angle of the ring structure. Both models are circularly symmetric about the -axis and have a ring structure with opening angle at the edge of the nebula. Ring model 1 (Figure 2(b)) has the same diffuse medium as the shell model (Figure 2(a)), while ring model 2 (Figure 2(c)) has that of ring type with the same opening angle as that of the outer ring structure. The diffuse medium is colored a brighter grey in each figure. Note that the shell model has of 90°. The same total optical depth is applied to both the shell and ring models and thus the dust densities of the diffuse medium and core in the ring models are slightly higher than those of the shell model.
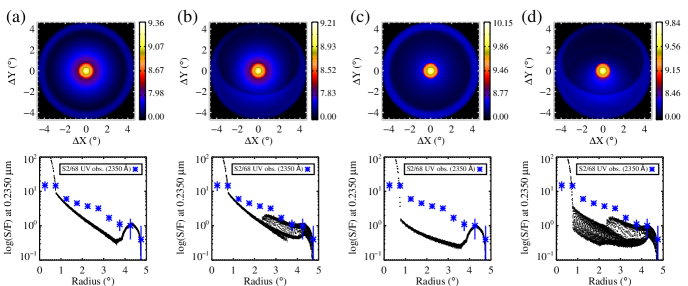
The ring model results for = 30° at 2350 are shown in Figure 4. Figures 4(a) and (b) show results of ring model 1; Figures 4(c) and (d) show those of ring model 2. As can be clearly seen in the figures, compared to the observational data denoted by blue asterisks, the ring model results (black dots) underpredict the intensity in a certain radial range between the core and the outer boundary (1° < < 4°). Ring model 2 results in a much weaker intensity than that of ring model 1. The same phenomenon was found in the ring models with different values of , such as 10°, 20°, 40°, and 50°. This implies that the diffuse medium alone, without the outer shell structure, is not enough to explain the observed UV scattered light, and that a geometrically thin but dense shell of dust with a radius of about 30 pc is required. This is mainly due to the fact that UV photons are strongly forward scattered and thus the scattered light in the radial range of < 4° predominantly originates from a dust cloud located in front of the light source.
Lang et al. (2000) reported on the inclination of the ring cloud with respect to the plane of the sky, suggesting an upper limit of 30°. The inclination of the ring cloud was incorporated by rotating the observer location anti-clockwise about the -axis in Figure 2, equivalent to a clockwise rotation of the cloud system. Simulation results, assuming this inclination angle of about 30°, are shown in Figures 4(b) and (d). The southern part of the inclined ring, which is nearer to the observer, covers about half of the southern region of the nebula and consequently plays the role of dense shell, as one would expect in the shell model, producing UV scattered light up to the level seen in the observation. In the figures, the intensity appears to be split into two branches: one corresponding to the northern part, with lower intensity, and the other corresponding to the southern part, with higher intensity. The lower intensity in the northern part is due to the fact that dust on the far side of the ring scatters fewer photons to the observer. Moreover, the inclined ring models still show a significant deficit in scattered light, between 1° to 2°.5, where the inclined ring cannot cover and scatter photons from the central source. In conclusion, both the ring and the inclined ring models fail to fit the UV observation data, while the shell model succeeds. Accordingly, these model results strongly suggest that it is necessary to adopt a shell structure in order to explain the UV scattering data.
4. SHELL WITH RING STRUCTURE
According to the Monte Carlo radiative transfer models in the previous section, it is now clear that there should exist a dust shell cloud around Ori. In this case, the inverse Abel transform (Binney & Tremaine 2008) can be used to estimate the 3D radial density profile of the dust cloud using the spherical symmetry of the shell cloud. The Abel integral equation relates a 3D density profile to its 2D column density for a spherically symmetric structure:
| (2) |
where is the observed column density (hereafter denoted as column density or ), is the radial volumetric density profile of a spherical cloud (hereafter density or ), is the projected radius, is the radial distance from the center, and is the outer radius of the shell, as shown in Figure 5. Assuming that is continuously differentiable, the inversion of the Abel transform is given by
| (3) |
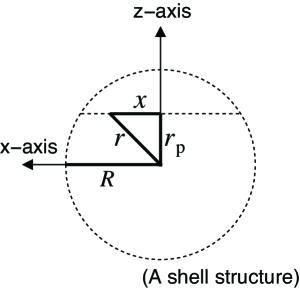
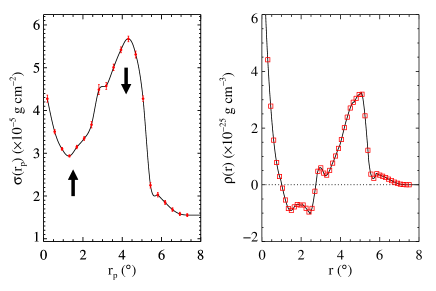
Figure 6 shows the azimuthally averaged column density derived from the map, and the radial density profile calculated by applying the inverse Abel transform to the column density . However, we obtain negative density values in a certain radial range, which is not physically possible. The absolute value is too great to be numerical error ( 30% of the peak density at 5°). Generally, the inverse Abel transform can produce negative values in areas around the center if the input column density is insufficient at the central region or excessive at the outer region. Therefore, there can be two mathematical ways to solve this problem: one is to enhance the input column density at 1°2°; the other is to reduce the input column density at 4°5° (marked by arrows in the left panel of Figure 6). Both processes will make the negative values rise; however, it is practically impossible to “increase” the column density as we cannot add new materials to the present cloud system. Accordingly, the only feasible way is to reduce the peak column density. This reduction is physically possible when there is a certain amount of dust along the outer part, which is not spherically symmetric but coexistent with the shell structure. In other words, the negative density problem can be resolved by assuming an additional non-spherical dust cloud component that overlaps with the spherical shell. The non-spherical cloud can be regarded as a toroidal ring-like dust cloud; then, the ring component can be subtracted from the column density profile.
Nielbock et al. (2012) modeled the column density of the dark globule Barnard 68 using the equation
| (4) |
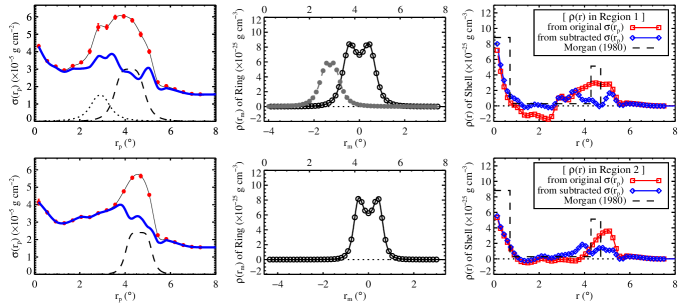
where is the radial distance from the center of the globule, is the central column density, is a certain radius that determines the range of an inner flat density core at < , and controls the power-law steepness of the profile. We describe the value of of the ring structure around Ori, assuming this equation can plausibly fit not only the surface density profile of a single globule but an averaged profile of overlapped clumps along the ring. The profile was originally proposed to model the spherically symmetric globule, but we will apply it to this case for convenience. The radial distance in the equation can now be applied as the radius of a cross-section of the ring (minor radius), while the projected radial distance can be used as the distance from the center of the torus tube (major radius), which is located at a distance 4°.2 or 4°.6 from the nebula center. For better fitting, Equation (4) is separately applied to Region 1 and 2 (Figure 1), since these two regions have different features of clumps in terms of apparent size and brightness. In addition to these rings, we especially consider constructing an additional ring cloud that includes a cloud complex known as B30, which has very bright emissions in both CO and IR (Lang et al. 2000). It should be noted that the radial distance to the center of this complex is about 1° shorter than that of the other clumps of the ring in Region 1. This consequently creates a bump in the column density profile at 2°.75, which needs to be subtracted in order not to produce a greater negative density profile. It is likely that the bump in the UV observation data at the same radius would be due to this complex. Here in the present study, an arc-shaped ring cloud whose angular size is about 90° is newly defined. This partial ring structure, which we term the “B30 arc complex,” includes the B30 and other clumps that are located at about 2°.75 from Ori (indicated by the black dashed ellipses in Figure 1).
Using the column density of the ring structure and the B30 arc complex (dashed and dotted lines, respectively, in the left panels of Figure 7), we obtained the column density (blue solid lines in the same panels) and of the “pure”, spherically symmetric structure (blue diamonds in right panels of Figure 7) using the inverse Abel transform. The negative shell density has been remarkably reduced and is now close to zero due to the ring-subtracted column density. There are no perfect, spherically symmetric clouds; such imperfection would cause the errors in the profile. In practice, however, it may be possible to find a density profile that is reasonable within a certain limit. Therefore, we define a limit of tolerance, 5 percent of the maximum density, and permit some negative values of within this tolerance limit. These small negative values were set to zero density in the dust radiative transfer code. We also derive of the ring cloud (the middle panels of Figure 7) using the truncated off-center Gaussian function (Ciotti 2000). The parameters of Equation (4), describing the ring structures, are tabulated in Table 2. The simulation result for the scattered light obtained by using the shell and ring densities, averaged over the azimuth angles, is shown in Figure 8. This result shows much better agreement with the UV observation than was found in previous studies. Only the central region, where the azimuthally averaged column density may not be reliable due to the small quantity of the pixel data, still shows an inconsistency, as was found in previous works (Morgan 1980). The best-fit optical properties of the dust grains in the Ori nebula are listed in Table 1. Interestingly, the albedos obtained from our final (shell+ring) model are consistent with those of the shell model of Morgan (1980) whereas our shell model in the previous section yielded higher values. One thing we should note is that the final radial density at the outer boundary of the spherically symmetric dust cloud is rather low compared to that of the ring cloud. However, as noted in the discussion, the total dust mass included in the outer shell region is higher than that in the ring dust cloud.

| Ring structures | Major radius (°) | (g cm-2) | (°) | ||
|---|---|---|---|---|---|
| Ring in Region 1 | 4.2 | 0.7 | 4.0 | ||
| Ring in Region 2 | 4.6 | 0.5 | 5.0 | ||
| B30 arc complex | 2.9 | 0.5 | 2.5 |
Notes. Input parameters describing the azimuthally averaged column density of the ring and the B30 ring complex. , , and are defined in Equation (4).
5. DISCUSSION
5.1. Ori Nebula as a Ring with a Shell Structure
The present study was designed to study the 3D structure of the Ori nebula; more specifically, to examine the existence of a shell and/or a ring structure in the nebula. The previous radiative transfer models (i.e., Morgan 1980), based on star counts, assumed a simple density structure, divided into three concentric shells. We, however, directly used a recently observed dust reddening map (Schlafly et al. 2014a), along with the inverse Abel transform technique, which enables us to envision a spherically symmetric radial density profile of the shell cloud. Negative density profiles are found when no ring structure is considered, indicating that the dust clouds are composed of two structures, a spherical shell and a toroidal ring. The scattered light, calculated using the Monte Carlo radiative transfer model, for both shell and ring structures, nicely reproduced the UV observations, including even the bump profile seen at 2°.75 (Figure 8), which has not been reproduced in any previous analyses. These results, in turn, strongly suggest that the Ori nebula consists of both ring- and shell-like dust clouds.
The optical properties of the dust associated with the Ori nebula at four UV bands were derived (Table 1). As discussed in Section 3.1, compared to the data used by Morgan, we have used more refined dust extinction properties from relatively more recent works in the literature. We have obtained similar albedo but stronger forward scattering in all four UV bands than were found by Morgan (1980). While Morgan’s (1980) simulation, with an asymmetry factor of , could not reproduce the steep slope (see Figure 3 in Morgan 1980), our simulation, with a stronger forward scattering () accords well with the radial profile shown in Figure 8.
Seon & Witt (2013) showed that dust scattering in turbulent ISM can yield substantial scatter in the correlation plots between the scattered flux and the optical depth. This effect is shown to be more severe as the sonic Mach number increases (turbulent ISM) and the scattering asymmetry factor of the dust grains decreases (isotropic scattering ISM). This may alter the results of the radiative transfer models using a relatively smoothly varying density. The effect is essential in near-infrared wavelengths, in which dust scattering is very close to isotropic, given normal submicron-size dust grains in the diffuse ISM (Draine 2003). As listed in Table 1, the scattering asymmetry factors of the Ori dust cloud are between 0.61 and 0.65, meaning strong forward scattering in the UV wavelengths. Therefore, the “weak correlation effect” is negligible in our scattering model, though the expanding Ori system may be turbulent due to a shock wave.
Mathis et al. (2002) demonstrated that observations of a hierarchically clumped reflection nebula can be fitted by a wide range of albedos when a smooth density structure is assumed. In our paper, we compared a radially averaged 1D intensity map with the radiative transfer models adopting a smooth density structure. Therefore, further investigation with spatially resolved 2D images may be needed to better constrain the optical properties.
The distance from the Sun to the target is an essential parameter used to estimate the mass and size of the nebula. We have adopted the distance of pc, proposed by Murdin & Penston (1977). Since their study, several measurements for the distance to Ori have been carried out. The distance derived from the parallax of the Hipparcos catalog (ESA 1997) is pc; the distance suggested by Dolan & Mathieu (2001) was pc, determined in a photometric study. More recently, the distance to the Ori nebula was estimated to be pc using a large catalog of distances to the Galactic molecular clouds (Schlafly et al. 2014b). The distance pc that we assumed is within these uncertainty ranges. In fact, the distance to Ori is not critical for the determination of the three-dimensional structure of this nebula. It will become possible to derive accurate distance and relevant physical properties through data from the Gaia mission, launched at the end of 2013.
5.2. The Parent Cloud and Mass Estimation
It is generally noted that interstellar gas and dust in bubble structures, including those of the Ori nebula, are swept up by a shock wave. For the case of the Ori system, a stellar wind (Maddalena & Morris 1987) or a supernova (Cunha & Smith 1996; Dolan & Mathieu 2002), although which one actually powered this shock wave is still unclear, presumably has swept up the central materials and resulted in the current morphology. Therefore, the current morphology of the nebula might be able to give a clue to the original structure of the parent cloud. Coulson et al. (1978) and Morgan (1980) proposed that the current morphology is a simple dust shell, suggesting that its original structure was spherical. Meanwhile, Maddalena & Morris (1987) suggested an oblate molecular cloud as the birthplace of Ori. In order to explain the CO observations, which show a clear ring feature, they assumed a preexisting natal cloud, which was not initially spherical but flat. The expanding H II region could explain the ring of CO clumps torn from the parent cloud. With photometry of over 320,000 stars, Dolan & Mathieu (2002) studied the spatial distribution of the pre-main-sequence stars around Ori; they concluded that the progenitor cloud may have been elongated. Hence, our simulation results, which clearly reveal the presence of a ring structure, support the elongated or the oblate progenitor model rather than the spherical one.
The dust mass of the Ori nebula can be derived by using the volumes of the shell and the ring structures, and the density profiles, shown in Figure 7. We numerically integrated the density profile and obtained the masses of the dust clouds: for the spherical dust cloud, for the dust rings including the B30 arc complex, and in total. If we use a gas-to-dust ratio of 100, then the total mass of the neutral gas in the shell is and that in the ring is . This ring mass is comparable to previous mass estimates: a dust ring mass of (Zhang et al. 1989), and a molecular ring mass of (Maddalena & Morris 1987) and that of (Lang et al. 2000). The mass estimated in this study also points out that the shell structure is significant in terms of mass compared to the ring, even though the radial density of the shell at the boundary appears to be lower than that of the ring, as can be seen in Figure 7.
If we adopt a dust reddening of toward Ori and the extinction cross-section from Weingartner & Draine (2001), the density of the diffuse background medium near the Ori system is estimated to be g cm-3. If there was no massive progenitor cloud around Ori, but diffuse dust medium with this density, and the H II region had swept up the diffuse medium to the shell’s inner radius of 30 pc, then the mass of the swept dust shell would be approximately 15 . Such a mass is more than an order of magnitude smaller than the dust shell mass estimated in this study. Therefore, our results support the hypothesis of a parent cloud around Ori.
5.3. A New Methodological Approach to the Study of the Morphology of Bubbles
With CO observations, Beaumont & Williams (2010) studied 43 bubbles and found a ring of cold gas, not a shell, around them, suggesting that the parent molecular clouds had been flattened. A comparison was made between the radial intensity profiles for the shell model and for the CO data; comparison results strikingly show the rarity of emission toward the center of the bubbles. They found weak correlation between the shell model and the CO data and no convincing evidence of front or back faces of the expanding shells. As a result, they concluded that shock waves from massive stars tend to create ring clouds instead of spherical shells. However, it should be noted that this ring morphology indicates a structure of “molecular gas clouds,” not of “entire cloud systems” including dust and neutral gas. According to our results, the Ori system has not only dust ring but also dust shell structures. This interpretation stresses that one should not overlook investigating dust morphology in order to determine the structure of an “entire cloud system,” and that our approach can be a useful one to understand the 3D structure of bubbles.
It is normally assumed that the morphology of well-defined ring-like bubbles can be described by one of two structures: a ring or a shell (or both). A relatively dilute shell cloud surrounding a nebula may not be detectable with CO and/or H I observations. It should be noted that two previous H I studies of the Ori nebula reported controversial interpretations: Wade (1957) proposed a nearly spherical H I shell, while Zhang & Green (1991) concluded that the H I shell that corresponds to the ring is far from complete. In this controversial case, the 3D radiative transfer model for scattered light can provide a solution because dust scattering is forward-directed in the optical and UV wavelengths, and thus this method is sensitive to the existence of shell dust in front of the central source. However, this method is not good at probing the ring dust cloud, as demonstrated in the present study. It should be noted that even a simple shell model without ring structures gave rather good agreement with their observational data, as can be seen in Figure 3. The existence of the ring dust cloud could be found by negative density values estimated using the inverse Abel transform. In the end, we obtained an integrated view on the structure of the Ori nebula: a cloud with both shell and ring structures.
Our model results and the method are not perfect for several reasons. First, the inverse Abel transform deals with an ill-posed problem. In fact, clumpy ring clouds cannot be represented by a simple ring model (Equation (4)). The small bumps remaining after subtracting the ring column density can distort the output density profile. However, this effect can be reduced by using a priori information and a smooth input function (Craig 1979). To increase stability we have divided the nebula into a proper number of azimuthal intervals and used the averaged column densities in each of the sub-regions. In addition, a priori information on spherical and circular symmetries and, above all, the constraint of positive definiteness, were used. Although the detailed shape of the output density profile was changed in attempting to determine the various ring dust clouds profiles, the presence of both shell and ring structures could be clearly seen. Second, the UV observation data we used were not 2D images, but a 1D radial profile. If, therefore, the UV image for the target field can be provided in the future, a more accurate density structure of the Ori system will be derived.
The new approach described in this paper, using both the radiative transfer model and the inverse Abel transform, has allowed us to detect the presence of both dust shell and ring clouds. Given a full map of dust reddening and UV data, it is likely that this approach can be applied to other relatively symmetrical bubbles centered on ionizing sources. There have been many studies of bubble-like structures over various scales (Castor et al. 1975; Heiles 1979; Reynolds & Ogden 1979; Mac Low & McCray 1988; Kendrew et al. 2012; Simpson et al. 2012), suggesting rounded bubbles are common morphology in the ISM. Accordingly, we may apply our method to many bubbles to examine whether their dust structures are of shell or ring type, or both, if they have massive or hot young stars and are not overlapped with unwanted massive clouds along the line of sight.
6. SUMMRARY
We successfully applied a new methodological approach, using a 3D Monte Carlo radiative transfer model and the inverse Abel transform, to study the structure of the Ori nebula, which structure has been controversial for decades. Our results show that a ring cloud coexists with a dust shell structure, suggesting there was a flat or elongated progenitor cloud. Although the morphology of the neutral and molecular hydrogen cloud in the target field could not be revealed through the present study, we suggest that our technique may be applicable to studies of bubble structure. Together with the results of previous studies based on CO and IR measurements, our technique may enable us to develop an integrated interpretation of the morphology of the Ori system.
References
- Allen (1973) Allen, C. W. 1973, Astrophysical Quantities, (Athlone Press, Univ. London)
- Amanatides & Woo (1987) Amanatides, J., & Woo, A. 1987, Proc. of Eurographics, 87, 3
- Beaumont & Williams (2010) Beaumont, C. N., & Williams, J. P. 2010, ApJ, 709, 791
- Binney & Tremaine (2008) Binney, J., & Tremaine, S. 2008, Galactic Dynamics (2nd ed.; Princeton University Press)
- Boksenberg et al. (1973) Boksenberg, A., et al. 1973, MNRAS, 163, 291
- Castor et al. (1975) Castor, J., McCray, R., & Weaver, R. 1975, ApJ, 200, L107
- Ciotti (2000) Ciotti, L. 2000, ApL&C, 40, 85
- Coulson et al. (1978) Coulson, I. M., Murdin, P. G., MacGillivray, H. T., & Zealey, W. J 1978, MNRAS, 184, 171
- Court s (1972) Court s, G. 1972, Vistas Astron., 14, 81
- Craig (1979) Craig, I. J. D. 1979 A&A, 79, 121
- Cunha & Smith (1996) Cunha, K., & Smith, V. V. 1996, A&A, 309, 892
- Dolan & Mathieu (2001) Dolan, C. J., & Mathieu, R. D. 2001, AJ, 121, 2124
- Dolan & Mathieu (2002) Dolan, C. J., & Mathieu, R. D. 2002, AJ, 123, 387
- Draine (2003) Draine, B. T. 2003, ApJ, 598, 1017
- Fitzpatrick (1999) Fitzpatrick, E. L. 1999, PASP, 111, 63
- Heiles (1979) Heiles, C. 1979, ApJ, 229, 533
- Henyey & Greenstein (1941) Henyey, L. G., & Greenstein, J. L. 1941, ApJ, 93, 70
- Kendrew et al. (2012) Kendrew, S., Simpson, R., Bressert, E., et al. 2012, ApJ, 755, 71
- Lang et al. (2000) Lang, W. J., Masheder, M. R. W., Dame, T. M., & Thaddeus, P. 2000, A&A, 357, 1001
- Mac Low & McCray (1988) Mac Low, M.-M., & McCray, R. 1988, ApJ, 324, 776
- Maddalena & Morris (1987) Maddalena, R. J., & Morris, M. 1987, ApJ, 323, 179
- Malone et al. (1987) Malone, D., McBreen, B. & Fazio, G. G. 1987, IrAJ, 18, 91
- Mathis et al. (2002) Mathis, J. S., Whitney, B. A., & Wood, K. 2002, ApJ, 574, 812
- Morrissey et al. (2007) Morrissey, P., Conrow, T., Barlow, T. A., et al. 2007, ApJS, 173, 682
- Morgan (1980) Morgan, D. H. 1980, MNRAS, 190, 825
- Murdin & Penston (1977) Murdin, P., & Penston, M. V. 1977, MNRAS, 181, 657
- Nielbock et al. (2012) Nielbock, M., Launhardt, R., Steinacker, J., et al. 2012, A&A, 547, A11
- Reynolds & Ogden (1979) Reynolds, R. J., & Ogden, P. M. 1979, ApJ, 229, 942
- Seon (2009) Seon, K.-I. 2009, ApJ, 703, 1159
- Seon (2015) Seon, K.-I. 2015, JKAS 48, 57
- Seon et al. (2011) Seon, K.-I., Edelstein, J., Korpela, E. J., et al. 2011, ApJS, 196, 15
- Seon & Witt (2012) Seon, K.-I., & Witt, A. N. 2012, ApJ, 758, 109
- Seon & Witt (2013) Seon, K.-I., & Witt, A. N. 2013, ApJ, 778, L40
- Sharpless (1959) Sharpless, S. 1959, ApJS, 4, 257
- Sharpless & Osterbrock (1952) Sharpless, S., & Osterbrock, D. 1952, ApJ, 115, 89
- Schlafly et al. (2014a) Schlafly, E. F., Green, G., Finkbeiner, D. P., et al. 2014a, ApJ, 789, 15
- Schlafly et al. (2014b) Schlafly, E. F., Green, G., Finkbeiner, D. P., et al. 2014b, ApJ, 786, 29
- Simpson et al. (2012) Simpson, R. J., Povich, M. S., Kendrew, S., et al. 2012, MNRAS, 424, 2442
- Wade (1957) Wade, C. M. 1957, AJ62, 148
- Wade (1958) Wade, C. M. 1958, Australian J. Phys., 11, 388
- Weingartner & Draine (2001) Weingartner, J. C., & Draine, B. T. 2001, ApJ, 548, 296
- Witt et al. (1997) Witt, A. N., Friedmann, B. C., & Sasseen, T. P. 1997, ApJ, 481, 809
- Yusef-Zadeh et al. (1984) Yusef-Zadeh, F., Morris, M., & White, R. L. 1984, ApJ, 278, 186
- Zhang & Green (1991) Zhang, C. Y., & Green, D. A. 1991, AJ, 101, 1006
- Zhang et al. (1989) Zhang, C. Y., Laureijs, R. J., Chlewicki, G., Wesselius, P. R., & Clark, F. O. 1989, A&A, 218, 231