Anomalous Compliance and Early Yielding of Nanoporous Gold
Abstract
We present a study of the elastic and plastic behavior of nanoporous gold in compression, focusing on molecular dynamics simulation and inspecting experimental data for verification. Both approaches agree on an anomalously high elastic compliance in the early stages of deformation, along with a quasi immediate onset of plastic yielding even at the smallest load. Already before the first loading, the material undergoes spontaneous plastic deformation under the action of the capillary forces, requiring no external load. Plastic deformation under compressive load is accompanied by dislocation storage and dislocation interaction, along with strong strain hardening. Dislocation-starvation scenarios are not supported by our results. The stiffness increases during deformation, but never approaches the prediction by the relevant Gibson-Ashby scaling law. Microstructural disorder affects the plastic deformation behavior and surface excess elasticity might modify elastic response, yet we relate the anomalous compliance and the immediate yield onset to an atomistic origin: the large surface-induced prestress induces elastic shear that brings some regions in the material close to the shear instability of the generalized stacking fault energy curve. These regions are elastically highly compliant and plastically weak.
keywords:
nanoporous , molecular dynamics , small-scale plasticity , elasticity of nanomaterials1 Introduction
Nanoporous gold (NPG) made by dealloying has attracted much attention due to its prospective applications in, e.g., actuation [1, 2, 3, 4, 5, 6], catalysis [7, 8], sensing [9, 10], and microfluidics [11]. The material represents a network of short fibers or ‘ligaments’ with dimensions that can be controlled between 5 nm and several micrometers [12, 13, 14]. Significantly, dealloying conserves the crystal lattice of the parent alloy (in the order of ), so that ligaments are crystallographically coherent over large distances [15, 16]. Representing an ensemble of interconnected ligaments, NPG offers an implementation of the mechanical properties of nanowires, including specifically their high strength, into a macroscopic material. The material is thus a model system for study of the mechanical properties and the mechanisms of plastic deformation at the nanoscale.
Experiments, and specifically the tests of macroscopic samples to large compressive strain of Refs. [16, 17, 14], have established characteristic features of NPG deformation which are now briefly summarized and compared to recent simulation studies using molecular dynamics (MD) [18, 19] and finite element modeling (FEM) [20].
NPG, while brittle in tension [12, 21, 16, 22], can be highly deformable in compression. Early experiments demonstrated this for focused-ion-beam (FIB) cut micropillars [23, 24], but improved synthesis protocols now allow deformation to large compressive strain for mm-sized samples [16, 17, 14] that are free of artifacts from FIB cutting. Gibson–Ashby scaling equations [25, 26] have been used for estimating the local yield stress of ligaments based on the effective materials behavior of NPG [27, 23]. However, the results of different measurements disagree. Micro and nanoscale tests suggest that the yield stress of ligaments increases with decreasing size, approaching the theoretical shear strength at sizes of a few nanometers [27, 23, 24, 28, 29, 30]. The results for mm-sized samples confirm the trend, yet they reveal systematically lesser strength [16, 22]. This discrepancy partly reflects inconsistencies in converting nanoindentation hardness to yield stress [16, 22]. More importantly, however, the compression experiments testify to an extended elastic-plastic transition, with early yielding and with a strong initial increase of the flow stress [20]. The yield strength is therefore poorly defined. MD studies have so far not reproduced this finding, indicating instead a pronounced linear elastic regime [18] and compressive yield strength in agreement with the scaling equations [19].
Most studies find NPG more compliant than predicted by the relevant Gibson–Ashby law [31, 32, 20]. There are, however, two reports of unusually high stiffness at small ligament size [33, 34]. The recent tests on mm-sized samples show an unusually high initial compliance and a significant stiffening during the early stages of plastic deformation [20, 35]. This evolution in elastic response cannot be explained by Gibson-Ashby type scaling of the effective stiffness with density [20]. While microstructural disorder in the network of ligaments was found to favor high compliance [20], the mechanisms behind the unusually high initial compliance and the strong stiffening during early-stage deformation of NPG remain yet to be identified. In fact, large discrepancies between the reported experimental stiffness data call for an independent verification.
Experiments show practically no transverse strain during compressive plastic deformation under uniaxial load [16]. This observation is reproduced by MD simulations and FEM [19, 20], with FEM linking the observation to microstructural disorder [20]. As a consequence of the absence of transverse strain, uniaxial compression densifies the network. Consistent with this densification and with the scaling laws, compression brings an unusually strong strain hardening [16]. It has been suggested that this implies a compression-tension asymmetry, with strain hardening in compression and strain softening in tension [14]. The tensile brittleness of NPG might thus reflect the plastic instability that ensues from strain softening. Indeed, constraining the volume change by infiltrating the pores of NPG with a polymer, while strengthening the material, suppresses the strain hardening and establishes ductility in tension [14]. Tensile deformation of NPG has been probed by atomistic computer simulation, with one study confirming the tensile strain softening [18] while another finds strain hardening [19]. The origin of this different behavior has not been addressed.
Dislocations are accumulated during plastic deformation of NPG and eventually even form cell walls. Electron backscatter diffraction detects the ensuing mosaic structure at length scales larger than the ligament size [16], while high-resolution transmission electron microscopy shows stacking faults and twins generated upon compression [30]. Strain hardening, besides partly reflecting densification, is also affected by interactions between the stored dislocations. This is revealed by the comparison of experiment to results from finite element modeling [20] and is also supported by the emergence of strain-rate sensitivity as the defect density increases during deformation [16].
In this study, we present a study of NPG compression deformation by MD simulations, addressing specifically the immediate plasticity and subsequent strain hardening, as well as the unexpectedly high initial compliance and subsequent stiffening. For verification, experimental data are shown alongside the simulations.
2 Methods
2.1 Simulation
A porous microstructure on a rigid crystal lattice was generated by spinodal decomposition of a binary mixture, using the Metropolis Monte Carlo algorithm with an Ising type Hamiltonian and periodic boundary conditions in all directions. A cubic box of lattice spacings () and -oriented edges was randomly filled with atom types and at atomic fraction . Interaction energy for nearest neighbor atoms was zero for pairs of the same type, and for pairs of different types. After the phase separation, all -type atoms were removed. All isolated -type atoms were also removed to assure a connected structure. As a result, the solid (volume- and mass-) fraction, , was . The same procedure was applied to -type atoms to ensure open porosity.
For the molecular dynamics simulations we used the open-source code LAMMPS [36] with an EAM potential for gold [37]. In most simulations the temperature was maintained at , while selected runs explored low temperature conditions () to assess the conceivable role of thermally activated processes.
In each run, the energy of initial structure was first minimized by the conjugate gradient method. To ensure a force-free structure after energy relaxation, the minimization was performed until the specified force tolerance is less than , while the energy criterion was set to zero. At the point where the minimization converged, the relative change in energy was less than . Then, the structure was thermally relaxed for at zero load. Uni-axial compression was attained by scaling the whole simulation box in one dimension at each time step at the engineering strain rate of , while keeping other dimensions at zero stress. Temperature and pressure were maintained by a Nosé-Hoover thermostat and barostat [38, 39] with Martyna-Klein-Tuckerman modifications [40, 41]. The time step for all simulations was . All strains in this work are specified as compressive engineering strain, .
The evolution of Young’s modulus of NPG was obtained by carrying out another simulation, using similar conditions but with intermediate unload/reload cycles. The effective Young’s modulus was determined as a tangent modulus [42] from the unload stress-strain segments.
The open-source software Ovito [43] was used for visualization. Dislocation defects in the material were detected and identified with the dislocation extraction algorithm (DXA) [44, 45]. This computational tool allows us to measure dislocation densities (broken down by Burgers vector) during the simulation. A surface reconstruction algorithm [46] was used to generate a geometric representation of the evolving crystal surfaces from the atomic positions and measure surface area and solid volume. Planar defects such as stacking faults and twin boundaries were detected and classified by means of an atomic pattern matching algorithm [46] that is based on the adaptive common neighbor analysis (a-CNA) method [47].
2.2 Experiment
NPG specimens for the experimental study were synthesized by electrochemical dealloying as described in Ref. [17]. The processing of the alloy precursor for the dealloying included arc melting, homogenization at for 120 h in vacuum, wire drawing, and cutting to form cylindrical samples of mm in diameter and mm in length. These samples were then annealed in inert atmosphere (, 2 h) and used for dissolution at 0.75 V in 1 M electrolyte at room temperature. Following this, a polarization at 1.1 V until the current decayed to 10 and potential cycling at a scan rate of 5 mV/s between V and V for 20 cycles was performed on as-dealloyed NPG in fresh 1 M solution. This served to remove residual Ag as well as strongly bound oxygen from the surface. Finally, the NPG samples were immersed in deionized ultra-pure water for at least 12 h and left for drying in Ar flow for more than two days. Scanning electron microscopy (SEM) yielded a ligament size of nm in the as-prepared specimens. The initial solid fraction was estimated at , based on the sample dimensions and mass. Similar to previous study [16], the experimental sample is polycrystalline with no apparent crystallographic texture. With grain sizes in the order of m, the individual crystallites are three orders of magnitude larger than the ligaments.
Compression testing used a mechanical testing rig (Zwick Z010 TN) at constant engineering strain rate and under ambient conditions. A stress-strain curve was accompanied by unload/reload cycles to obtain the effective stiffness. The minimal stress for each unloading step was MPa. A detailed description of the stiffness evaluation can be found in Ref. [20].
The removal of oxygen species from the surface of NPG concurs with coarsening. As adsorbed oxygen has a strong influence on the mechanical behavior of NPG [17, 35], we here compare mechanical response of the virtual sample with that of samples which, albeit having much bigger ligament size, exhibit clean surfaces.
3 Results
3.1 Morphology and initial relaxation
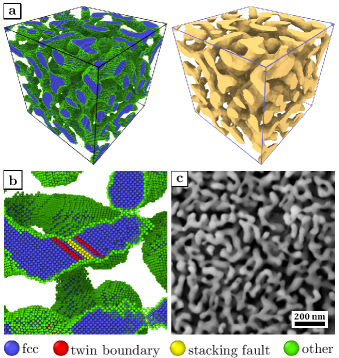
Figure 1a shows a snapshot of the virtual sample as generated by the Monte Carlo simulation (left), as well as its surface reconstruction (right). Similar to previous MD studies, where a phase-field spinodal decomposition approach was used for generating the boundaries of the ligaments [19, 18], we find that our sample reproduces the interconnected nanoscale network structure of nanoporous gold well (see the SEM image in Fig. 1c).
The specific surface area (area per volume of solid) of our virtual sample is . In order to relate and to a characteristic structural length-scale, , we used the conversion rule:
| (1) |
which yields . This rule results from modeling NPG as a periodic diamond-like structure with cylindrical ligaments of diameter , connected in spherical nodes which are just large enough to just cover the overlapping cylinder segments [20]. For the experiment, electrochemical capacity measurements [48] yield the volume-specific surface area of the tested sample, . The conversion rule given in Eq. (1) thus puts the ligament diameter of the respective diamond-like structure at , which is well compatible with the value estimated from the SEM image.
At nm edge length, our simulation box dimensions are one order of magnitude larger than the ligament size of nm. This suggests that the box size is sufficient to rule out finite-size effects in the MD simulation. For verifying that the simulation box contains a statistically representative volume of the virtual nanoporous structure generated by spinodal decomposition, we created several virtual samples of same density and structure size by independent runs of spinodal decomposition under identical conditions. All virtual samples were found to exhibit consistent mechanical behavior, supporting the adequate size of the box.
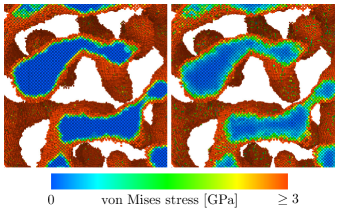
Relaxing the initially rigid and defect-free porous crystal at simulation and with no external load led to decrease in the total volume, increasing the effective solid fraction to . Not a single dislocation could be found in the relaxed structure, but the relaxation generated a very small number of stacking faults and twin boundaries. The fault density was , corresponding to only atoms in faulted configurations, a negligible fraction of the million atoms in the entire structure. This suggests that the volume contraction after relaxation at low temperature is almost entirely elastic and can be understood as a natural consequence of the action of the surface stress. While the average surface-induced prestress can be calculated by using generalized capillarity equation (Section 4.1 below), the influence of surface stress is readily observable by monitoring the stress distribution. As an example, Fig. 2 shows a slice cutting through NPG sample before (left) and after (right) the initial energy minimization, with atoms color-coded according to the local von Mises stress (assuming equilibrium atom volume for all atoms). It is evident that although lattice defects have not shown up yet, the bulk atoms already experience changes in local stress, with accentuating changes near the surface or at the smaller segments of ligaments, implying that, before the onset of straining, the relaxed structure already suffers large stress (with non-uniform distribution) induced by the surface stress. We note that Fig. 2 agrees with previous MD study of NPG [19] where relaxation of initially unstrained NPG samples leads to changes in the corresponding histogram of local stresses.
As compared to the relaxation at , equilibrating the starting structure at K brings more pronounced structural changes. Figure 1b illustrates that many lattice defects are generated; the densities of dislocations, stacking faults and twins are , and , respectively. The creation of lattice defects even in the absence of an external load is also observed in experiments. Transmission electron microscopy (TEM) reveals this process for NPG when ligaments yield to the surface-induced stress during fast dealloying [15].
The 300 K equilibration increases the solid fraction to . The corresponding specific surface area and ligament diameter are and , respectively. The equilibration creates a stable structure, and in particular - apart form the generation of lattice defects - the initial long-range coherent crystal lattice is maintained. Bearing in mind the periodic boundary conditions, one can consider the virtual NPG structure as an infinitely extended single crystal with pores and dislocations.
3.2 Stress-strain behavior under compression
Next we studied stress-strain behavior in compression. As a background for inspecting the simulation results, Fig. 3a shows the experimental stress-strain curve for a mm-sized NPG sample with described above. The simulated stress-strain curves of the virtual sample at 300 K are shown in Fig. 3b, with the continuous loading in red and the load/unload sequence in blue. For the purpose of clarity, data at strains are magnified in the insets.
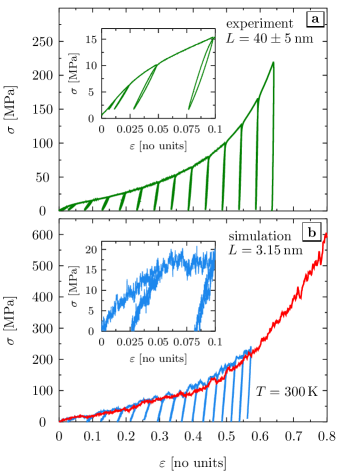
The experimental data in Fig. 3a are well compatible with data for a sample of similar reported earlier in Ref. [16] (cf. Fig. 1d there). Remarkably, despite the deviation in ligament size between experiment and simulation, the respective stress-strain curves show excellent agreement. The small-strain deformation is nonlinear with a quasi immediate onset of plastic deformation already at the smallest load. This immediate yielding is suggested by the residual strain which is found upon unloading even after small deformation.
Experiment and simulation also agree in relation to the unusually pronounced strain hardening at larger strain. For example of the virtual sample, the flow stress under continuous loading is as low as at strain , rising to at strain and finally attaining at the end of compression.
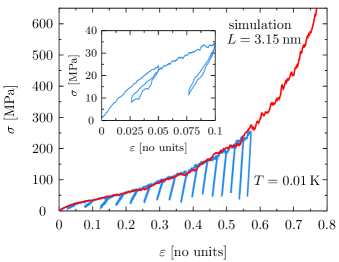
The stress-strain curves of the virtual sample at are shown in Fig. 4, with graphs color-coded as in Fig. 3b. The stress-strain curves of virtual NPG are found for all practical purposes independent of the temperature.
We emphasize the deformability of NPG, real and virtual, in compression, along with low yield strength and high strain hardening. To elucidate the underlying mechanisms, we now inspect the deformation-induced structural changes, concentrating on the deformation in continuous compression.
3.3 Transverse strain and surface area
Figure 5a shows the evolution of transverse strain during compression in our uniaxial load simulation. It is seen that the lateral dimensions remain essentially invariant for up to , which is in agreement with experimental data measured during plastic flow [16, 14]. Consequently, the change in axial dimension translates directly into volume reduction. In other words, compression entails densification. By the end of straining (at ) the solid fraction of the virtual sample attains the value of .
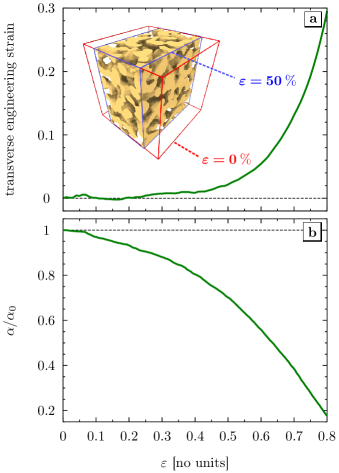
One of the signatures of microstructural evolution is the variation of the specific surface area. The graph of - scaled to the initial value, , of the structure before straining - is shown in Fig. 5b (entire evolution of reconstructed surface during deformation is shown in Movie-1 in Supplementary data). The data set reveals a continuous loss of surface area during compression.
3.4 Evolution of effective Young’s modulus
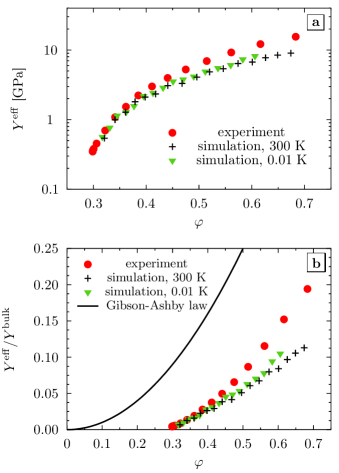
The load/unload segments of the experimental and simulated test yield data for the effective Young’s modulus, , which we computed as an unloading tangent modulus [42]. We verified that secant moduli, which average over the unload/reload process, provide consistent results. As the virtual samples densify during compression, we found it of interest to plot versus the solid fraction. Figure 6a shows and in log-linear plots, revealing that the virtual sample starts out exceedingly compliant at both temperatures of the MD simulations. The stiffness then increases substantially as the compression proceeds. For example, at room temperature, while the first value of at strain is , the last value of at strain is , nearly 20-fold stiffer.
The experimental effective stiffness is shown along with the simulation data for comparison (see Fig. 6, circles). In view of the unusual compliance found by MD we emphasize the remarkable precision with which the simulation matches the experimental data, particularly at low strain where the compliance is highest.
The relation between effective modulus and relative density of macroscopic metal foams is the subject of one of the Gibson-Ashby scaling laws [25]:
| (2) |
where denotes Young’s modulus of the bulk metal. We emphasize that this equation describes the variation in stiffness with the initial density of the foam structure. It is well established that the stiffness variation with density during compression follows quite different trends, see for example Ref. [49]. Nonetheless, it is of interest to compare our data to Eq. (2) as a reference for the behavior of porous metals. As a basis we calculated the Young’s modulus of nontextured massive polycrystalline Au for the interatomic potential of our simulation at via Kröner’s formulation [50]. The result, , agrees well with the experimental value of massive polycrystalline Au at room temperature, [51]. Therefore, we take and as the references for at and room temperature, respectively.
As an illustration for the first value of at , we substitute the corresponding solid fraction, , into Eq. (2). The result is for , fifteen times higher than the value indicated by our simulation at that density. Consistently, at the first experimental value of the density, , the scaling law overestimates the experimental stiffness, for which we find , by more than the factor twenty.
Figure 6b shows the evolution of normalized to , including the graph of Eq. 2 superimposed to the simulation results. The figure illustrates that the effective stiffness of NPG is consistently very much lower than that of the scaling law. It is not unusual for metal foams to be more compliant than the prediction by the scaling law, see for instance Ref. [52], which reports a deviation by the factor three, and references therein. Yet, the magnitude of the deviation, which is apparent in our data (Fig. 6b) is extraordinarily high.
In relation to the trends in Fig. 6b we also find it remarkable that the stiffness values of our real and virtual samples appear to extrapolate to zero at a finite solid fraction, slightly less than 0.3. This trend is clearly distinguished from the power-law scaling embodied in Gibson-Ashby type laws, and it illustrates the extraordinary compliance of NPG.
3.5 Evolution of defect density
Figure 7a shows the evolution of dislocation density during compression. As is illustrated in the inset, Shockley partial dislocations – generated during relaxation as stated earlier in this work – are present already before the onset of loading. Compression then brings a continuous accumulation of dislocations. As the deformation proceeds the fraction of full dislocations increases, yet the Shockley partials remain predominant throughout at all strains.
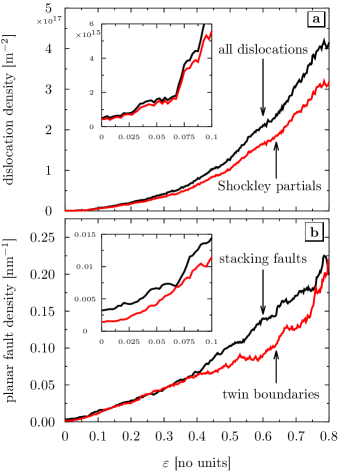
The largest dislocation density, at the end of the deformation, is or . Taking the characteristic volume of ligaments in the order of , we infer few (in the order of 4) dislocations per ligament. This number is well compatible with the snapshot of defect configuration on a cross-section through a virtual sample at engineering strain, Fig. 8.
The inset in Fig. 7a shows that the dislocation density increases immediately as the deformation sets in, even in the initial stages of compression. This observation represents another manifestation of the immediate yielding, confirming the conjectures obtained from the absence of linear elastic stress-strain relation and from the lasting plastic deformation after unloading from few percent net elastic-plastic deformation.
Figure 7b is analogous to Fig. 7a, except that the densities of twin boundaries and stacking faults are plotted. The analogous observations apply, with both densities increasing right from the start of loading and throughout the deformation.
A typical defect structure under compression is shown in Fig. 8 (entire evolution of defect structures during deformation is illustrated in Movie-2 and Movie-3 in Supplementary data). In line with previous MD studies [18, 19], many twin boundaries (red) and stacking faults (yellow) are observed. Lomer-Cottrell locks are also found, as illustrated in the lower magnification in Fig. 8.

Figure 8 also reveals that, in contrast to some experimental observations [53, 30], planar defects were found not only in the “nodes” which connect the ligaments, but also in the middle of the ligaments.
At larger strains, grain boundaries form during densification, as exemplified by the upper magnification in Fig. 8. These boundaries result from cold-welding of neighboring ligaments. While this process contributes to densifying the structure, it is remarkable that the pore network, and with it the nanoporous structure, remains well-defined up to very large compressive strain, in spite of the largely increased solid fraction.
4 Discussion
Let us start out the discussion of the stress-strain behavior of NPG by a comparison to the behavior of macroscopic metal foams. Experiment, for instance Ref.s [49, 54, 52], on these materials suggests stress-strain curves in compression quite similar to NPG. Specifically, foams with higher initial density show the same type of progressive hardening with ongoing deformation as NPG. However, closer inspection reveals significant differences. Firstly, conventional metal foams deform elastically at small stress, contrary to NPG. Secondly, load-unload tests on conventional foams show the effective stiffness to remain roughly constant during compression or to even slightly decrease in its initial stages [49]. This contrasts with the pronounced stiffening of NPG upon compression that is observed in our study. Thirdly, compression tests of conventional metal foams of low initial density, comparable to our samples, exhibit a plateau in flow stress while the deformation is carried by localized crush bands [55, 26, 52]. NPG lacks the plateau, and in fact an experimental investigation of its microstructure evolution during compression testifies to uniform deformation as opposed to crush bands [16].
Our discussion of the distinctive behavior of NPG emphasizes the role of its nanoscale microstructure. As one related aspect, it is well established that the strength of nanoscale objects typically increases with decreasing size [56, 57, 58] and high strength comes along with low strain hardening [59]. As a network of nanoscale ligaments, NPG is expected to exhibit a similar trend in response to external load. Yet, in line with previous experimental study [16], our results show that both real and virtual NPG samples are highly deformable, with ill-defined yield strength, extremely high compliance and pronounced strain hardening. Here, we address the most relevant issues.
4.1 Surface-induced stress and initial dislocation content
The microstructure of our virtual sample was generated by simulating spinodal decomposition on a rigid crystal lattice. By construction, the initial structure was therefore free of strain and of lattice defects. Prior to the MD studies of deformation behavior, the virtual sample was subjected to a relaxation free of load. The ensuing densification by plastic deformation, accompanied by the creation of various lattice defects, may be understood as the consequence of surface stress. The surface of a solid exerts forces in the underlying bulk (see below) that need to be compensated by bulk stress. For elongated structures, such as the ligaments of NPG, the surface-induced bulk stress has a shear component [60] that may prompt dislocation nucleation and spontaneous plasticity. Experiments on NPG detect the associated volume shrinkage and the generation of dislocations [15], and atomistic simulation has previously confirmed the mechanism [61].
While Fig. 2 documents the formation of these surface-induced stresses during the energy relaxation of the initially unstrained NPG sample, the magnitude of the surface-induced stress, , in the bulk of the nanoporous material is governed by the generalized capillary equation for solids [60],
| (3) |
where , and denote volume, surface area and surface stress tensor, respectively. This equation embodies a trend for even isotropic surface stress to create anisotropic stress in bulk, whenever the surface orientation distribution function is anisotropic. Approximating the surface stress as isotropic with magnitude , so that with the surface projection tensor [62], and considering a cylindrical nanowire as a cartoon of the ligament geometry, one obtains the principal values of surface-induced bulk stress in axial and radial directions, respectively, as and [60]. The maximum projected shear stress, of magnitude , is found on planes inclined by to the wire axis. For the EAM potential used in this study [63]. With a ligament diameter of , the surface-induced shear stress is thus estimated at . While this value is well below the theoretical shear strength of our potential, the disordered nature of the nanoporous network entails variations in ligament diameter and a fraction of local cross-sections that are well below nm in diameter and that, therefore, may experience local surface-induced stresses of sufficient magnitude to induce spontaneous plastic shear.
4.2 Early stages of plasticity under load
The surface-induced plastic deformation during the equilibration has important ramifications for the yield strength of the material. Most obviously, at room temperature, the virtual samples start out with a significant initial dislocation density. It has been well documented that the mechanical behavior of nanoscale objects depends crucially on this parameter. While practically ideal strength may be achieved in dislocation-free whiskers, irrespective of their size, nanoscale pillars with an initial dislocation content are found considerably weaker [64, 65, 66]. The immediate yield onset of NPG may thus be promoted by its high initial dislocation density. However, the very same behavior observed at nearly zero temperature where no dislocation was stored in the virtual samples indicates that the pre-existing dislocations are not the only reason for the immediate yielding.
Equally relevant is the observation that not all ligaments yield under the action of the surface stress during the initial equilibration. This is naturally understood as the consequence of a distribution of resolved surface-induced shear stresses. Only some ligaments will yield, thereby thicken and so reduce their local surface-induced prestress. Other ligaments may retain their prestress. It is then natural to assume that some ligaments are prestressed close to yielding, with only small external load required to locally reach the theoretical shear stress. In other words, the heterogeneous nature of the surface-induced prestress contributes to early yielding and, when considering the entire porous network, to an extended elastic-plastic transition as the external load increases.
The above conjecture is perfectly born out by the observations on the mechanical behavior of our virtual sample and by the experimental data in Fig. 3. The lasting plastic deformation after unload even from strain as small as testifies to the quasi instantaneous onset of yielding as load is applied, in agreement with the presence of very large surface-induced prestress in some ligaments. The same picture may also explain the initial increase in flow stress, which may reflect the exhaustion of local configurations with a low yield stress. In other words, as the deformation proceeds, the external load needs to increase in order to overcome those configurations in which the prestress is less active in assisting the deformation. Similar behavior has been discussed in massive nanocrystalline metal when deformation events are confined to individual grains with a distribution of crystal orientation and hence a distribution of local Schmid factor [67]. Stress-strain curves of such nanocrystalline metal samples exhibit an extended elastic plastic transition, yet with a preceding, well expressed elastic regime. The complete lack of a regime of purely elastic deformation is characteristic of nanoporous gold.
The disordered nature of the porous network is another reason for stress heterogeneity in nanoporous gold. Depending on its orientation relative to the macroscopic load, and depending on the load-bearing capacity of its neighboring ligaments, each ligament will suffer compressive load or bending moments which are related to the macroscopic load by a local stress concentration factor. The wide distribution of stress concentration factors contributes to the gradual yield onset. This distribution should be well approximated by the FEM simulation of NPG in Ref. [20]. Yet, the simulated stress strain curves of that study do not reproduce the immediate yielding of the present work. The existence of an extended regime of purely elastic deformation in the FEM simulation thus argues against distributed stress concentration factors as the origin of early yielding. These considerations again emphasize the importance of the surface-induced prestress that was discussed above.
As another point of support for the above argument we advertise its implication of a compression-tension asymmetry. The surface-induced bulk stress would enhance compressive load but counteract tensile load. The strength should thus be enhanced in tension. This was pointed out by Farkas et al. [19], who indeed confirmed the asymmetry in their MD simulation. In this relation we point out that a well-expressed linear elastic regime is seen in MD tension tests of nanoporous gold, but when compression is simulated with the same potential the elastic regime is largely diminished [19]. This is again compatible with surface-induced prestress as the origin of yielding in compression but not in tension.
Surface roughness is another factor that might contribute to the deformability of NPG. For nanowires and nanopillars, MD simulations suggest that step edges and corners result in stress concentration that promotes dislocation nucleation and thus reduces the yield strength [68, 69, 70]. Recently, the local strain concentration at edges of nanostructures could be experimentally confirmed by imaging with aberration-corrected TEM [71]. In view of the impact of roughness for yielding it is significant that Fig. 1b reveals an abundance of step edges and corners in NPG; indeed at least part of these defects are geometrically necessary in order to achieve the nanoscale surface curvature of the ligament network.
4.3 Strain hardening
The comparison between the evolution of flow stress with strain in experiment and simulation (Fig. 3) reveals a remarkable agreement between both data sets. This suggests that the simulation catches the essentials of the strain hardening behavior of nanoporous gold.
The strain hardening of NPG may partly be understood as a manifestation of densification under compression. As pointed out in Section 3.3, the lack of transverse plastic strain implies that compressive axial strain entails a numerically equal volume compression and, hence, an enhanced solid volume fraction. In view of the Gibson-Ashby scaling equation for the variation of flow stress with initial density [25],
| (4) |
it is natural to also expect a qualitatively similar behavior when the material is densified during compression. In a constitutive sense, the increase in flow stress with ongoing strain represents an (effective, macroscopic) strain hardening. Of course, the link to the scaling law Eq. (4) can only be qualitative in view of the dissimilarities in structures emanating from changing density during synthesis or during compression, respectively. In this qualitative sense, the expectation is supported by the observation that suppressing the volume change by infiltrating the pore space of NPG with a polymer will indeed eliminate the strain hardening [14]. Yet, the finite element simulation in Ref. [20] demonstrates the need to account additionally for work hardening in the constitutive equation of each nanoscale ligament, on top of the mere densification effect.
Experiment points towards dislocation storage and dislocation interaction as the origin of the local work hardening within each ligament. Electron backscatter diffraction data of the microstructure evolution during deformation of nanoporous gold testify to the gradual evolution of mosaic spread at a scale larger than the ligament size [16]. This requires dislocation storage, and the very large increase in dislocation density in our simulation clearly supports this conjecture. What is more, the experimental data reveal a gradual increase of the strain rate sensitivity as the deformation proceeds, an observation that is consistent with an increasing role of dislocation interaction [16]. Our simulation supports that picture as well. The final dislocation density of several dislocations per ligament is extremely high, suggesting drastic Taylor hardening. The Lomer-Cottrell locks that are apparent in our deformed structure (as exemplified in Fig. 8) provide a direct evidence of dislocation interaction. We note that the continuous accumulation of lattice defects during compression and the impact of dislocation interaction implies that the dislocation-starvation scenario, which is often considered in models of small-scale plasticity [72, 73], does not apply for NPG.
The strain rate of MD simulation is much higher compared to that of our experiment. When there are competing deformation mechanisms with different strain-rate sensitivity, as in nanocrystalline metals [74, 75], the dominant deformation mechanism depends on the strain rate. Specifically, classical MD simulations may overestimate the contributions of dislocation slip [76]. In that respect, we emphasize that our simulation results as well as previous studies [16, 18, 19] consistently highlight dislocation slip as the only governing process in deformation of NPG. We therefore expect this mechanism to dominate independently of the strain rate, supporting a discussion of simulation and experiment within the same conceptual framework.
4.4 Initial compliance and subsequent stiffening
As is presented in Fig. 6, the evolution of is characterized by two features: exceptionally high initial compliance and a subsequent stiffening under compression. The excellent consistency between simulation and experiment indicates that the unusual behavior is indeed intrinsic for NPG.
As with the early yielding, the elastic softening must partly be related to the microstructural heterogeneity. Due to the topological disorder, different regions will exhibit different elastic response, and soft regions might contribute to high effective compliance. FEM modeling [20] confirms the strong correlation between structural disorder and compliance in NPG. Yet, the FEM model fails to reproduce the strong stiffening during the initial compression. This points towards the role of atomic-scale processes which are not reflected in the constitutive laws of the FEM.
A conceivable atomistic origin of the anomalous compliance is reversible microplasticity based on the bow-out of pre-existing dislocation segments between their anchor points. For an example of this effect, here in cold-worked iron, see [77]. Yet, the equally high compliance of the essentially defect-free virtual NPG of our low-temperature runs immediately rules out a decisive impact of preexisting dislocations on the compliant response of NPG.
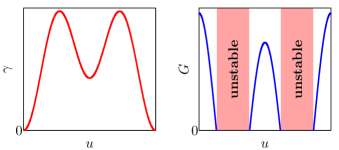
Similarly to the elasticity of nanowires, a more consistent explanation of the anomalous compliance considers surface-related phenomena. Yet, the origin of size-dependent effective stiffness values of nanowires is controversial, see e.g. Ref. [78] and references therein. Surface excess elasticity is an obvious explanation [79, 80], and is supported by the observation of large changes in the stiffness when the surface state is reversibly varied [35], yet an agreement on the sign of the surface excess elastic constants, stiffer or more compliant than bulk, has yet to emerge. The role of elastic nonlinearity of the core of wires prestressed by the capillary forces has also been advertised (e.g. see [81, 82, 83]); the issue is challenging since the nonlinear elastic response of cubic crystals is complex, see e.g. [84]. Irrespective of their details, the above considerations require the modified stiffness to depend on the specific surface area. It is therefore remarkable that our findings show substantial stiffening of NPG after small plastic strain, while the net surface area is essentially invariant. This points towards processes other than surface excess elasticity or modified elastic response of the bulk. One issue stands out in the present geometry: as discussed in Section 4.1, the surface stress induces shear stresses which exceed the theoretical shear strength in some ligaments and closely approach it in others. Since the theoretical shear strength is determined by a point of inflection in the generalized stacking fault energy curve, it entails a vanishing shear modulus. This is illustrated schematically in Fig. 9. In other words, the surface-induced stress and the concomitant shear will systematically reduce the shear stiffness of the ligaments in NPG. This is well consistent with the anomalous compliance of the material in its initial state. Furthermore one expects that, as the material is plastically compressed, more and more of these near-unstable configurations will be pushed over to stable faulted or twinned configurations, relaxing their stress and reverting back to a configuration of conventional, high shear stiffness. This agrees with the observed stiffening during the early stages of plastic deformation. Even though the shear instability in this picture seems unusual, it is well supported by all observations of our work.
4.5 Size-dependent flow stress
The discussion so far advertises a truly remarkable agreement between simulation and experiment, including the stiffness and its evolution during compression, the initial yield behavior and the strain hardening. This agreement supports the notion that the model structure is compatible with experiment in respect to its topological features and likely also in respect to the state of the surface. Yet, the agreement breaks down when it comes to the structure size, where the ligaments of the experimental sample are around tenfold larger than those of the simulation. As a consequence, and in view of the well-known trend for strength enhancement at reduced size, the numerical agreement between the flow stress values in simulation and experiment is surprising. As the agreement between the stiffness values suggests that the topology of the simulation is realistic, we suspect that the unexpectedly low flow stress of the simulation is linked to the surface geometry. Specifically, Fig. 1b illustrates that the small structure size in the simulation entails extremely high local surface curvatures and, in the consequence, extreme densities of geometrically necessary step edges and kinks. We have already mentioned in Section 4.2 above that atomistic simulation studies [68, 69, 70] point towards a strong influence of surface defects on the yield behavior. The low flow stress in the simulation supports these remarks, suggesting that surface roughness has an important impact on local stress concentrations and, hence, on the macroscopic yield behavior of the extremely small structures of our simulation.
5 Summary
We have presented a study of the mechanical behavior of nanoporous gold (NPG) in compression by means of molecular dynamics simulations. A virtual sample prepared by spinodal decomposition with ligament size of and solid fraction was uni-axially loaded and thus strained to very large deformation. Experimental data are shown for comparison.
Our study finds close agreement between experiment and simulation, advertising the following common phenomenology:
-
1.
NPG can be deformed to large strain in compression, with very high strain-hardening coefficient.
-
2.
NPG yields immediately even at the smallest applied load.
-
3.
The plastic Poisson ratio remains essentially zero throughout a large range of strain.
-
4.
As the most remarkable observation, NPG is anomalously compliant, with a stiffness much lower than predicted by the relevant Gibson-Ashby relation.
-
5.
There is a pronounced stiffening in the initial stages of compression.
It is also remarkable that both, the effective macroscopic stiffness and the flow stress, agree closely between experiment and simulation, even though the ligament size of the experimental sample is tenfold larger than that of the simulation. This difference highlights that, in spite of several remarkable similarities between the deformation phenomena in simulation and experiment, it would be inappropriate to over-emphasize the match between the results from the two approaches. Interatomic potentials in MD simulation do not simultaneously provide precise agreement with the surface tensions, surface stresses, and stacking fault energies of the experiment, nor do the accessible timescales of MD allow for a reproduction of the orders of magnitude slower processes in the experiment. Nonetheless, discussing the simulation results on their own in a self-consistent way affords insights into the microscopic processes and their interactions by which nanoporous solids with microstructure similar – though not identical – to the real world deform. Based on a critical discussion of these processes in relation to the experiment, our study arrives at the following suggestions with respect to the acting deformation mechanisms:
-
1.
Even in the absence of external load there is local yielding driven by capillary forces. As-prepared samples therefore already exhibit lattice defects.
-
2.
We propose that the surface-induced stresses create a distribution of shear stress that, in its tail, reaches the theoretical shear strength. The regions of somewhat lesser shear stress are close to an elastic instability, and are distinguished by vanishing shear stiffness. This is a key contribution to the anomalous compliance of NPG.
-
3.
Dislocation activity occurs immediately upon loading, and compressive plastic deformation leads to the continuous accumulation of lattice dislocations.
-
4.
The storage of lattice defects and our observations of locks imply that, in addition to densification, standard dislocation-based mechanisms must contribute to the strengthening of NPG under compression. The dislocation-starvation scenario, which is often considered in models for nano-object deformation, does not apply to NPG.
-
5.
Similarly, the evolution of effective Young’s modulus during compression is not a simple density-related effect. Other factors, including the relaxation of highly stressed (and, therefore, nearly shear-unstable) regions by faulting, are important.
Acknowledgments
The authors gratefully acknowledge the Gauss Centre for Supercomputing (GCS) for providing computing time through the John von Neumann Institute for Computing on the GCS share of the supercomputer JUQUEEN at Jülich Supercomputing Centre. Computing time was also made available by Lichtenberg-High Performance Computer Cluster at TU Darmstadt. JW acknowledges support by SFB 986 “Taylor-Made Multiscale Materials Systems - ”, subproject B2.
Appendix A. Supplementary data
Supplementary data associated with this article can be found in the online version. For the sake of clarity, the animation Movie-3 only shows reconstructed surface, planar defects (red), and dislocations (green).
References
References
- Kramer et al. [2004] Kramer, D., Viswanath, R.N., Weissmüller, J.. Surface-Stress Induced Macroscopic Bending of Nanoporous Gold Cantilevers. Nano Lett 2004;4(5):793–796.
- Biener et al. [2009] Biener, J., Wittstock, A., Zepeda-Ruiz, L.A., Biener, M.M., Zielasek, V., Kramer, D., et al. Surface-chemistry-driven actuation in nanoporous gold. Nat Mater 2009;8(1):47–51.
- Jin and Weissmüller [2010] Jin, H.J., Weissmüller, J.. Bulk Nanoporous Metal for Actuation. Adv Eng Mater 2010;12(8):714–723.
- Jin et al. [2010] Jin, H.J., Wang, X.L., Parida, S., Wang, K., Seo, M., Weissmüller, J.. Nanoporous Au-Pt alloys as large strain electrochemical actuators. Nano Lett 2010;10(1):187–94.
- Detsi et al. [2011] Detsi, E., Chen, Z.G., Vellinga, W.P., Onck, P.R., De Hosson, J.T.M.. Reversible strain by physisorption in nanoporous gold. Appl Phys Lett 2011;99(8):083104.
- Detsi et al. [2012] Detsi, E., Chen, Z.G., Vellinga, W.P., Onck, P.R., De Hosson, J.T.M.. Actuating and Sensing Properties of Nanoporous Gold. J Nanosci Nanotechnol 2012;12(6):4951–4955.
- Ding et al. [2004] Ding, Y., Chen, M.W., Erlebacher, J.. Metallic mesoporous nanocomposites for electrocatalysis. J Am Chem Soc 2004;126(22):6876–7.
- Xu et al. [2007] Xu, C.X., Su, J.X., Xu, X.H., Liu, P.P., Zhao, H.J., Tian, F., et al. Low temperature CO oxidation over unsupported nanoporous gold. J Am Chem Soc 2007;129(1):42–3.
- Lavrik et al. [2001] Lavrik, N.V., Tipple, C.A., Sepaniak, M.J., Datskos, P.G.. Enhanced chemi-mechanical transduction at nanostructured interfaces. Chem Phys Lett 2001;336(5-6):371–376.
- Lang et al. [2009] Lang, X.Y., Chen, L.Y., Guan, P.F., Fujita, T., Chen, M.W.. Geometric effect on surface enhanced Raman scattering of nanoporous gold: Improving Raman scattering by tailoring ligament and nanopore ratios. Appl Phys Lett 2009;94(21):213109.
- Xue et al. [2014] Xue, Y.H., Markmann, J., Duan, H., Weissmüller, J., Huber, P.. Switchable imbibition in nanoporous gold. Nat Commun 2014;5:4237.
- Li and Sieradzki [1992] Li, R., Sieradzki, K.. Ductile-brittle transition in random porous Au. Phys Rev Lett 1992;68(8):1168–1171.
- Kertis et al. [2010] Kertis, F., Snyder, J., Govada, L., Khurshid, S., Chayen, N., Erlebacher, J.. Structure/processing relationships in the fabrication of nanoporous gold. JOM 2010;62(6):50–56.
- Wang and Weissmüller [2013] Wang, K., Weissmüller, J.. Composites of nanoporous gold and polymer. Adv Mater 2013;25(9):1280–1284.
- Parida et al. [2006] Parida, S., Kramer, D., Volkert, C., Roesner, H., Erlebacher, J., Weissmüller, J.. Volume Change during the Formation of Nanoporous Gold by Dealloying. Phys Rev Lett 2006;97(3):4–7.
- Jin et al. [2009] Jin, H.J., Kurmanaeva, L., Schmauch, J., Roesner, H., Ivanisenko, Y., Weissmüller, J.. Deforming nanoporous metal: Role of lattice coherency. Acta Mater 2009;57(9):2665–2672.
- Jin and Weissmüller [2011] Jin, H.J., Weissmüller, J.. A material with electrically tunable strength and flow stress. Science 2011;332(6034):1179–1182.
- Sun et al. [2013] Sun, X.Y., Xu, G.K., Li, X.Y., Feng, X.Q., Gao, H.J.. Mechanical properties and scaling laws of nanoporous gold. J Appl Phys 2013;113(2):023505.
- Farkas et al. [2013] Farkas, D., Caro, A., Bringa, E., Crowson, D.. Mechanical response of nanoporous gold. Acta Mater 2013;61(9):3249–3256.
- Huber et al. [2014] Huber, N., Viswanath, R., Mameka, N., Markmann, J., Weissmüller, J.. Scaling laws of nanoporous metals under uniaxial compression. Acta Mater 2014;67:252–265.
- Biener et al. [2005a] Biener, J., Hodge, A.M., Hamza, A.V.. Microscopic failure behavior of nanoporous gold. Appl Phys Lett 2005a;87(12):121908.
- Balk et al. [2009] Balk, T.J., Eberl, C., Sun, Y., Hemker, K.J., Gianola, D.S.. Tensile and compressive microspecimen testing of bulk nanoporous gold. JOM 2009;61(12):26–31.
- Volkert et al. [2006] Volkert, C.A., Lilleodden, E.T., Kramer, D., Weissmüller, J.. Approaching the theoretical strength in nanoporous Au. Appl Phys Lett 2006;89(6):061920.
- Biener et al. [2006] Biener, J., Hodge, A.M., Hayes, J.R., Volkert, C.A., Zepeda-Ruiz, L.A., Hamza, A.V., et al. Size effects on the mechanical behavior of nanoporous Au. Nano Lett 2006;6(10):2379–82.
- Gibson and Ashby [1982] Gibson, L.J., Ashby, M.F.. The Mechanics of Three-Dimensional Cellular Materials. Proc R Soc A Math Phys Eng Sci 1982;382(1782):43–59.
- Gibson and Ashby [1999] Gibson, L.J., Ashby, M.F.. Cellular Solids. 2nd ed.; Pergamon Press, Oxford; 1999.
- Biener et al. [2005b] Biener, J., Hodge, A.M., Hamza, A.V., Hsiung, L.M., Satcher, J.H.. Nanoporous Au: A high yield strength material. J Appl Phys 2005b;97(2):024301.
- Hodge et al. [2007] Hodge, A.M., Biener, J., Hayes, J.R., Bythrow, P.M., Volkert, C.A., Hamza, A.V.. Scaling equation for yield strength of nanoporous open-cell foams. Acta Mater 2007;55(4):1343–1349.
- Hakamada and Mabuchi [2007] Hakamada, M., Mabuchi, M.. Mechanical strength of nanoporous gold fabricated by dealloying. Scr Mater 2007;56(11):1003–1006.
- Dou and Derby [2011] Dou, R., Derby, B.. Deformation mechanisms in gold nanowires and nanoporous gold. Philos Mag 2011;91(7-9):1070–1083.
- Biener et al. [2008] Biener, J., Hamza, A., Hodge, A.M.. Deformation behavior of nanoporous metals. In: Yang, F., Li, J.C.M., editors. Micro and Nano Mechanical Testing of Materials and Devices; chap. 6. Springer US; 2008, p. 118–135.
- Hodge et al. [2011] Hodge, A.M., Doucette, R.T., Biener, M.M., Biener, J., Cervantes, O., Hamza, A.V.. Ag effects on the elastic modulus values of nanoporous Au foams. J Mater Res 2011;24(04):1600–1606.
- Mathur and Erlebacher [2007] Mathur, A., Erlebacher, J.. Size dependence of effective Young’s modulus of nanoporous gold. Appl Phys Lett 2007;90(6):061910.
- Liu and Antoniou [2013] Liu, R., Antoniou, A.. A relationship between the geometrical structure of a nanoporous metal foam and its modulus. Acta Mater 2013;61(7):2390–2402.
- Mameka et al. [2014] Mameka, N., Markmann, J., Jin, H.J., Weissmüller, J.. Electrical stiffness modulation–confirming the impact of surface excess elasticity on the mechanics of nanomaterials. Acta Mater 2014;76:272–280.
- Plimpton [1995] Plimpton, S.. Fast Parallel Algorithms for Short-Range Molecular Dynamics. J Comput Phys 1995;117(1):1–19.
- Foiles et al. [1986] Foiles, S., Baskes, M., Daw, M.. Embedded-atom-method functions for the fcc metals Cu, Ag, Au, Ni, Pd, Pt, and their alloys. Phys Rev B 1986;33(12):7983–7991.
- Nosé [1984] Nosé, S.. A unified formulation of the constant temperature molecular dynamics methods. J Chem Phys 1984;81(1):511.
- Hoover [1985] Hoover, W.. Canonical dynamics: Equilibrium phase-space distributions. Phys Rev A 1985;31(3):1695–1697.
- Martyna et al. [1992] Martyna, G.J., Klein, M.L., Tuckerman, M.. Nosé–Hoover chains: the canonical ensemble via continuous dynamics. J Chem Phys 1992;97(4):2635–2643.
- Martyna et al. [1996] Martyna, G.J., Tuckerman, M.E., Tobias, D.J., Klein, M.L.. Explicit reversible integrators for extended systems dynamics. Mol Phys 1996;87(5):1117–1157.
- ASTM Standard E111 [2010] ASTM Standard E111, . Standard Test Method for Young’s Modulus, Tangent Modulus, and Chord Modulus. 2010.
- Stukowski [2010] Stukowski, A.. Visualization and analysis of atomistic simulation data with OVITO - the Open Visualization Tool. Model Simul Mater Sci Eng 2010;18(1):015012.
- Stukowski and Albe [2010] Stukowski, A., Albe, K.. Extracting dislocations and non-dislocation crystal defects from atomistic simulation data. Model Simul Mater Sci Eng 2010;18(8):085001.
- Stukowski et al. [2012] Stukowski, A., Bulatov, V.V., Arsenlis, A.. Automated identification and indexing of dislocations in crystal interfaces. Model Simul Mater Sci Eng 2012;20(8):085007.
- Stukowski [2013] Stukowski, A.. Computational Analysis Methods in Atomistic Modeling of Crystals. JOM 2013;66(3):399–407.
- Stukowski [2012] Stukowski, A.. Structure identification methods for atomistic simulations of crystalline materials. Model Simul Mater Sci Eng 2012;20(4):045021.
- Cattarin et al. [2009] Cattarin, S., Kramer, D., Lui, A., Musiani, M.. Formation of Nanostructured Gold Sponges by Anodic Dealloying. EIS Investigation of Product and Process. Fuel Cells 2009;9(3):209–214.
- McCullough et al. [1999] McCullough, K., Fleck, N., Ashby, M.. Uniaxial stress-strain behaviour of aluminium alloy foams. Acta Mater 1999;47(8):2323–2330.
- Kröner [1958] Kröner, E.. Berechnung der elastischen Konstanten des Vielkristalls aus den Konstanten des Einkristalls. Z Phys 1958;151(4):504–518.
- Davis [1998] Davis, J., editor. Metals Handbook. ASM International; 1998.
- Michailidis et al. [2011a] Michailidis, N., Stergioudi, F., Tsouknidas, A.. Deformation and energy absorption properties of powder-metallurgy produced al foams. Mater Sci Eng A 2011a;528(24):7222–7227.
- Sun et al. [2007] Sun, Y., Ye, J., Shan, Z.W., Minor, A.M., Balk, T.J.. The mechanical behavior of nanoporous gold thin films. JOM 2007;59(9):54–58.
- Michailidis et al. [2011b] Michailidis, N., Stergioudi, F., Tsouknidas, A., Pavlidou, E.. Compressive response of Al-foams produced via a powder sintering process based on a leachable space-holder material. Mater Sci Eng A 2011b;528(3):1662–1667.
- Simone and Gibson [1998] Simone, A.E., Gibson, L.J.. Aluminum foams produced by liquid-state processes. Acta Mater 1998;46(9):3109–3123.
- Uchic et al. [2004] Uchic, M.D., Dimiduk, D.M., Florando, J.N., Nix, W.D.. Sample dimensions influence strength and crystal plasticity. Science 2004;305(5686):986–9.
- Volkert and Lilleodden [2006] Volkert, C.A., Lilleodden, E.T.. Size effects in the deformation of sub-micron Au columns. Philos Mag 2006;86(33-35):5567–5579.
- Greer and De Hosson [2011] Greer, J.R., De Hosson, J.T.M.. Plasticity in small-sized metallic systems: Intrinsic versus extrinsic size effect. Prog Mater Sci 2011;56(6):654–724.
- Dou and Derby [2008] Dou, R., Derby, B.. The strength of gold nanowire forests. Scr Mater 2008;59(2):151–154.
- Weissmüller and Cahn [1997] Weissmüller, J., Cahn, J.W.. Mean stresses in microstructures due to interface stresses: A generalization of a capillary equation for solids. Acta Mater 1997;45(5):1899–1906.
- Crowson et al. [2009] Crowson, D.A., Farkas, D., Corcoran, S.G.. Mechanical stability of nanoporous metals with small ligament sizes. Scr Mater 2009;61(5):497–499.
- Gurtin et al. [1998] Gurtin, M.E., Weissmüller, J., Larché, F.. A general theory of curved deformable interfaces in solids at equilibrium. Philos Mag A 1998;78(5):1093–1109.
- Swaminarayan et al. [1994] Swaminarayan, S., Najafabadi, R., Srolovitz, D.. Polycrystalline surface properties from spherical crystallites: Ag, Au, Cu and Pt. Surf Sci 1994;306(3):367–380.
- Bei et al. [2008] Bei, H., Shim, S., Pharr, G., George, E.. Effects of pre-strain on the compressive stress–strain response of Mo-alloy single-crystal micropillars. Acta Mater 2008;56(17):4762–4770.
- Lee et al. [2009] Lee, S.W., Han, S.M., Nix, W.D.. Uniaxial compression of fcc Au nanopillars on an MgO substrate: The effects of prestraining and annealing. Acta Mater 2009;57(15):4404–4415.
- Jennings et al. [2010] Jennings, A.T., Burek, M.J., Greer, J.R.. Microstructure versus Size: Mechanical Properties of Electroplated Single Crystalline Cu Nanopillars. Phys Rev Lett 2010;104(13):135503.
- Li et al. [2009] Li, L., Anderson, P., Lee, M., Bitzek, E., Derlet, P., Swygenhoven, H.. The stress-strain response of nanocrystalline metals: A quantized crystal plasticity approach. Acta Mater 2009;57(3):812–822.
- Brochard et al. [2000] Brochard, S., Beauchamp, P., Grilhé, J.. Stress concentration near a surface step and shear localization. Phys Rev B 2000;61(13):8707–8713.
- Diao et al. [2004] Diao, J., Gall, K., Dunn, M.L.. Yield Strength Asymmetry in Metal Nanowires. Nano Lett 2004;4(10):1863–1867.
- Hyde et al. [2005] Hyde, B., Espinosa, H.D., Farkas, D.. An atomistic investigation of elastic and plastic properties of Au nanowires. JOM 2005;57(9):62–66.
- Roy et al. [2014] Roy, A., Kundu, S., Müller, K., Rosenauer, A., Singh, S., Pant, P., et al. Wrinkling of Atomic Planes in Ultrathin Au Nanowires. Nano Lett 2014;14(8):4859–4866.
- Greer et al. [2005] Greer, J.R., Oliver, W.C., Nix, W.D.. Size dependence of mechanical properties of gold at the micron scale in the absence of strain gradients. Acta Mater 2005;53(6):1821–1830.
- Greer and Nix [2006] Greer, J.R., Nix, W.D.. Nanoscale gold pillars strengthened through dislocation starvation. Phys Rev B 2006;73(24):245410.
- Yamakov et al. [2004] Yamakov, V., Wolf, D., Phillpot, S.R., Mukherjee, A.K., Gleiter, H.. Deformation-mechanism map for nanocrystalline metals by molecular-dynamics simulation. Nat Mater 2004;3:43–7.
- Meyers et al. [2006] Meyers, M., Mishra, A., Benson, D.. Mechanical properties of nanocrystalline materials. Prog Mater Sci 2006;51:427–556.
- Schäfer et al. [2013] Schäfer, J., Stukowski, A., Albe, K.. On the hierarchy of deformation processes in nanocrystalline alloys: Grain boundary mediated plasticity vs. dislocation slip. J Appl Phys 2013;114(14):143501.
- Benito et al. [2005] Benito, J.A., Jorba, J., Manero, J.M., Roca, A.. Change of Young’s modulus of cold-deformed pure iron in a tensile test. Metall Mater Trans A 2005;36(12):3317–3324.
- McDowell et al. [2008] McDowell, M.T., Leach, A.M., Gall, K.. On The Elastic Modulus of Metallic Nanowires. Nano Lett 2008;8(11):3613–3618.
- Miller and Shenoy [2000] Miller, R.E., Shenoy, V.B.. Size-dependent elastic properties of nanosized structural elements. Nanotechnol 2000;11(3):139–147.
- Wang and Li [2007] Wang, G., Li, X.. Size dependency of the elastic modulus of ZnO nanowires: Surface stress effect. Appl Phys Lett 2007;91(23):231912.
- Liang et al. [2005] Liang, H., Upmanyu, M., Huang, H.. Size-dependent elasticity of nanowires: Nonlinear effects. Phys Rev B 2005;71(24):241403.
- Chen et al. [2012] Chen, L.Y., Richter, G., Sullivan, J.P., Gianola, D.S.. Lattice Anharmonicity in Defect-Free Pd Nanowhiskers. Phys Rev Lett 2012;109(12):125503.
- Yun and Park [2009] Yun, G., Park, H.. Surface stress effects on the bending properties of fcc metal nanowires. Phys Rev B 2009;79(19):195421.
- Wang and Li [2009] Wang, H., Li, M.. Ab initio calculations of second-, third-, and fourth-order elastic constants for single crystals. Phys Rev B 2009;79(22):224102.