Far-ultraviolet study of the local supershell GSH 006-15+7
Abstract
We have analyzed the archival data of FUV observations for the region of GSH 006-15+7, a large shell-like structure discovered by Moss et al. (2012) from the H i velocity maps. FUV emission is seen to be enhanced in the lower supershell region. The FUV emission is considered to come mainly from the scattering of interstellar photons by dust grains. A corresponding Monte Carlo simulation indicates that the distance to the supershell is 1300 800 pc, which is similar to the previous estimation of 1500 500 pc based on kinematic considerations. The spectrum at lower Galactic latitudes of the supershell exhibits molecular hydrogen fluorescence lines; a simulation model for this candidate photodissociation region (PDR) yields an H2 column density of N(H2) = 1018.0-20.0 cm-2 with a rather high total hydrogen density of nH 30 cm-3.
Subject headings:
ISM: supershell — ISM: dust, extinction — ISM: individual (GSH 006-15+7) — ISM: structure — ultraviolet: ISM1. Introduction
Supershells are giant bubbles with a scale of hundreds of parsecs, and are believed to be created by multiple stellar winds from OB associations and supernova explosions (Heiles, 1979, 1984). Supershells play an important role in galaxy evolution since they redistribute huge amounts of energy and material from the galaxy disc to the galaxy halo. The interstellar matter swept up by supershells forms cold and dense regions in which new star formation is triggered. The typical lifetime of supershells is about 107 years (Tenorio-Tagle & Bodenheimer, 1988), much longer than those of supernova remnants (SNRs; Frail et al., 1994). Supershells have been found with observations of 21-cm H i line emission originating from the cold and dense shells (Heiles, 1979, 1984; McClure-Griffiths et al., 2002; Ehlerová & Palouš, 2005, 2013; Suad et al., 2014), in which infrared emission associated with dust is also observed. For younger supershells, X-ray emission was found from their inner hot gas (T106 K) (Heiles et al., 1999). Furthermore, far ultraviolet (FUV) emission lines such as C iv and O vi were also observed from their interface region of T105 K between hot gas and cold ambient medium (Jo et al., 2011). Optical emission lines such as H were observed from their ionized shells (Reynolds et al., 1998; Boumis et al., 2001). Hence, multi-wavelength study for supershells including FUV wavelengths may give us critical information about their environment and evolution.
GSH 006-15+7 is one of the Milky Way supershells discovered recently through a 21-cm line survey of the southern sky, which was compiled as the Galactic All Sky Survey (GASS) (Kalberla et al., 2010; Moss et al., 2012). GSH 006-15+7 spans across the sky from l = 356°to l = 16°in longitude and from b = -28°to b = 2°in latitude, which is translated into the physical size of 790 520 pc at a distance of 1500 500 pc. Moss et al. (2012) also discussed in detail the physical properties of the supershell. The structure of the supershell is most obvious in the range of vLSR5 km s-1 to vLSR11 km s-1, with a systemic velocity of 7 km s-1, whereas it is difficult to identify the shell-like structure in the maps of the lower velocity channels of vLSR 5 km s-1, probably because of the contamination by local emission. Its dynamical age has been estimated to be 15 5 Myr, which is consistent with the ages found for similar Galactic supershells with well-defined shapes. The formation energy was estimated to be 1052 ergs, with a mass of 3 2 106 M☉ and an expansion velocity of 8 km s-1. It was suggested that the energy source of the expansion of GSH 006-15+7 is likely to be associated with Sgr OB association 1 and some open clusters nearby. However, the absence of high-mass stars in these stellar groups, which are able to produce significant stellar winds, indicates the expansion was at least partially made by supernova explosions and the winds of progenitor stars. Moss et al. (2012) found some evidence for the breakout of the supershell at (l, b) = (10°, -25°) based on the infrared and H i maps, indicating mass and energy transfer from the Galactic disk to the halo.
Whereas the physical characteristics described above were obtained from multi-wavelength data, FUV observations have not been reported yet. It is well known that interstellar FUV emission is produced in the regions of a cooling hot gas (Seon et al., 2006; Kim et al., 2007), from scattering by dust grains (Jo et al., 2012; Lim et al., 2013; Choi et al., 2013), and in photo-dissociation regions (PDRs) (Ryu et al., 2006; Lee et al., 2006); of these, dust scattered FUV emission is regarded to be the dominant component (Seon et al., 2011).
We present in this paper the results of analysis based on archival data of FUV observations. Section 2 describes observational results of the FUV continuum image and spectrum for the region of the supershell. In Section 3, a distance to the supershell is estimated based on three-dimensional multi-scattering simulations of dust scattering. The results of Monte Carlo simulations for the PDR region of the supershell are also presented in Section 3. A summary of the present study is given in Section 4.
2. Observations and Data Reduction
The present study primarily used the FUV observations on the rectangular region spanning from (l, b) = (-10°, -35°) to (20°, -5°) which included part of the supershell GSH006-15+7. A study of continuum emission was conducted with the data set obtained by the Galaxy Evolution Explorer (GALEX; Morrissey et al., 2007). GALEX carried out an ultraviolet all sky survey in the FUV (1350–1750 Å) band, but it does not provide spectral information. Hence, a spectral study was proceeded with the observations from the Far-ultraviolet IMaging Spectrograph (FIMS, also known as Spectroscopy of Plasma Evolution from Astrophysical Radiation or SPEAR) on board the Korean microsatellite STSAT-1.
FIMS contains dual FUV imaging spectrographs, referred to as the S-band (900–1150 Å) and L-band (1350–1750 Å). FIMS is the main payload of STSAT-1, which was operated for a year and a half after its launch on September 27, 2003, in a 700 km sun-synchronous orbit. FIMS was designed to have a large field of view (75 4 3 in L-band) with angular resolution of 5′, which is suitable for observations of diffuse targets, while its spectral resolution is rather moderate (/ 550). More information on the FIMS mission and instruments can be found in Edelstein et al. (2006a, b). We also used the dust extinction map based on the Schlegel, Finkbeiner & Davis (SFD; Schlegel et al., 1998) for comparisons with FUV observations.

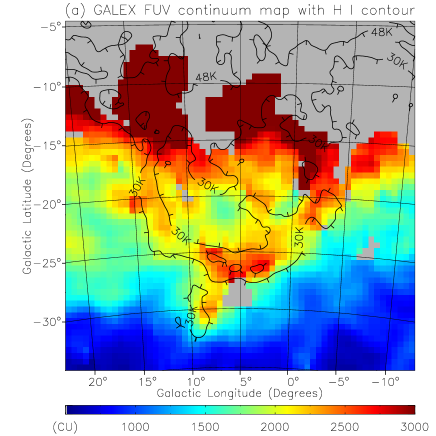
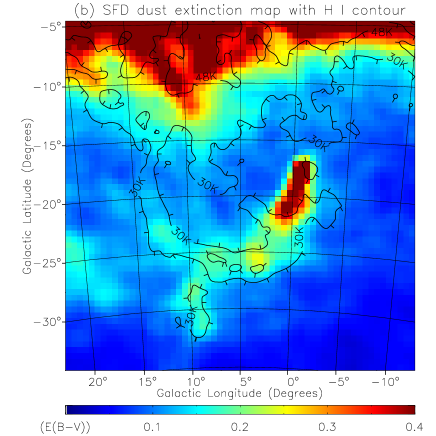
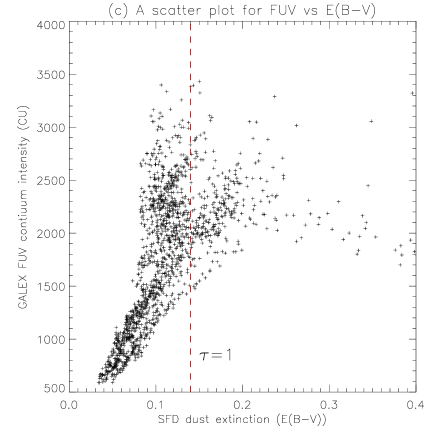
Figure 1 shows the (a) GALEX FUV continuum map, (b) SFD dust extinction map over the rectangular region spanning from (l, b) = (-10°, -35°) to (20°, -5°), and (c) a scatter plot for the FUV intensity against dust extinction for the region spanning from (l, b) = (-5°, -35°) to (15°, -15°), which is referred to as the lower supershell region henceforth. H i contours at the systemic velocity of 7 km s-1, following the result of Moss et al. (2012), are overplotted in Figures 1(a) and 1(b) (The Parkes Galactic All-Sky Survey (GASS) dataset; McClure-Griffiths et al., 2009; Kalberla et al., 2010). The Figure 1(a) and 1(b) were plotted with 05 pixel size and smoothing of the image to have 1°resolution. The GALEX observations avoided bright stars intentionally, leaving some regions unobserved. Most of these missing areas were filled for the region of b -15°, where the lower supershell region resides, with coarse-grained binning and smoothing, but some regions still remain unfilled, especially in the region of the Galactic disk, as Figure 1(a) shows. The dust extinction map of Figure 1(b) shows extremely high optical depth in the region of b -15°near the Galactic disk, probably due to the foreground dust. The shell-like feature associated with GSH 006-15+7 is not seen in this optically thick region. Hence, we focus only on the lower region of b -15°in the present analysis. The scatter plot of Figure 1(c) was constructed from a pixel-by-pixel comparison between Figure 1(a) and 1(b) for the lower supershell region.
What is notable in the FUV continuum map of Figure 1(a) is that the intensity is higher at the lower supershell region of b -15°than its surroundings. This is considered to result from dust scattering of the region since the lower supershell region has higher extinction levels than its neighbors, as shown in Figure 1(b). We note that the optical depth for the E(B-V) value of 0.14 corresponds to 1 at = 1565 Å, which is indicated by the vertical dashed line in Figure 1(c).
A strong correlation between the FUV intensity and E(B-V) is seen in Figure 1(c) for the optically thin region of 1, except the vertical branch above the FUV intensity of 1500 CU. This agrees well with the general notion that FUV continuum intensity correlates with E(B-V) in an optically thin region (Hurwitz et al., 1991; Seon et al., 2011). The vertical branch, where data points are scattered up to 3500 CU, are the bright pixels corresponding to the regions of b -18°. Being close to the Galactic plane, they represent the scattered component of the high-intensity radiation fields from the Galactic plane. We also note that FUV intensity is anti-correlated with dust extinction for E(B-V) above 0.2, which is reasonable for an optically thick region such as R CrA of the present case, as can be seen in Figure 1(b). The dense cloud at (l, b) (0°, -18°) in Figure 1(b), corresponding to the partial extinction seen in the FUV continuum map of Figure 1(a), is the R CrA molecular cloud (Rossano, 1978) which is located at a distance of 170 pc from the Sun (Knude & Hog, 1998).
Figure 2 shows the spectrum made with FIMS over the rectangular region spanning from (l, b) = (-10°, -35°) to (20°, -5°) of GSH 006-15+7. Bright point sources in the region were removed from the data set when obtaining the above spectrum. More specifically, the pixels corresponding to the bright stars in the TD-1 catalog with 1565 Å band flux of above 10-11 erg Å-1 s-1 cm-2 were removed, together with those within a radius of 2°around the stars whose intensities were more than twice as high as the median values. Among various emission peaks, the C iv emission line is readily noticeable in the spectrum, together with H2 fluorescent emission features. While the molecular hydrogen emission is associated with the shell boundaries, it will be shown that the C iv emission does not seem to be related to the shell.
3. Modeling and Discussion
3.1. Dust scattering simulation
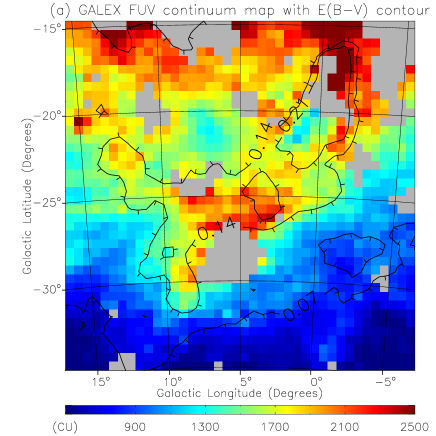
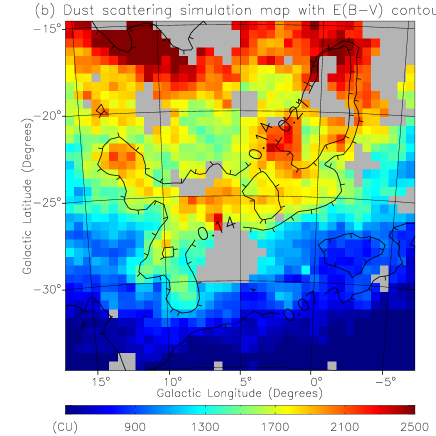
As mentioned previously, the FUV continuum emission associated with GSH 006-15+7 is mainly from dust scattering. Hence, we attempted simulations of dust scattering to obtain the distance to the supershell region, by comparing the observation with a simulation for the FUV continuum, as was done previously for many individual targets (Jo et al., 2012; Lim et al., 2013; Choi et al., 2013). This will produce an independent measurement of the distance that we will compare with the 1500 500 pc distance estimate that Moss et al. (2012) calculated from the H i gas kinematics. For comparison with the dust scattering simulation, the observed FUV map should also have only the contribution from dust scattering. We found that other sources of FUV emission have only a small effect on this region: ion line emission and H2 fluorescent emission are 18 percent of the total FUV intensity, and the two photon continuum emission ranges from 20 to 90 CU, based on the Southern H-Alpha Sky Survey Atlas (Gaustad et al., 2001). We used the conversion factor of 28.4 CU for 1 Rayleigh of H intensity to obtain the two photon continuum emission (Seon et al., 2011). These contributions were removed from the map of Figure 1(a) and the result is shown in Figure 3(a) with dust extinction contours at E(B-V) of 0.07, 0.14 and 0.21 for the lower supershell region.
The simulation code employs a Heney-Greenstein function for the scattering model: it describes light scattering off grains using the albedo and the phase function asymmetry factor, or the g-factor, as free parameters (Henyey & Greenstein, 1941). In the present simulations, however, the albedo and g-factor are fixed at 0.4 and 0.6, respectively, based on the theoretical estimations for carbonaceous-silicate grains (Draine, 2003), and Monte Carlo simulations are performed for various distributions of dust to obtain the best dust distribution model by comparing the simulated FUV intensity with the observed one. We take a rectangular box of 280 280 700 cells as the simulation domain, corresponding to 1400 pc 1400 pc 3500 pc with the longest dimension along the line of sight. The center of the map of (l, b) = (5°, -25°) corresponds to the sightline of the central axis, and the Sun is located in the center of the front face. The 1400 pc 1400 pc size at the rear face spans an angular size of 226 226 on the sky, encompassing the lower supershell region of 20° 20°.
The dust distribution of the supershell is idealized to be a single slab whose distance and thickness are to be determined in comparison with the observed FUV map. We note that the region also has a local cloud R CrA, as well as a possible contribution from the foreground, both of which must be subtracted from the SFD map to obtain the effect of dust solely associated with the supershell.
The foreground contribution is modeled as follows. We divide the SFD map of l = -5°to 15°into 500 vertical strips and fit each strip with a linear function that generally follows the minimum of E(B-V). Each linear fit, given as a function of latitude, represents the E(B-V) value integrated along the sightline of the given latitude. We distribute dust along the sightline according to the distance from the Galactic plane assuming that dust distribution has an exponential decrease outwards from the Galactic plane with a scale height of 100 pc in view of the previous studies (Parenago, 1945; Misiriotis et al., 2006). With this distribution of dust, 88 percent of the total foreground dust is located within 500 pc from the Sun, and 99 percent within 1000 pc. The amount of dust associated with the supershell is determined by subtracting these foreground values from those of the SFD map at corresponding locations. For the region of the supershell co-located with R CrA, E(B-V) = 0.1, the mean value of the nearby supershell region is assigned to the supershell. The dust layer corresponding to R CrA is placed at 170 pc from the Sun with a thickness of 5 pc. With this given distribution of dust for the foreground and R CrA, the distance to the dust clouds corresponding to the supershell is decided by comparing the simulation with the observation for the FUV continuum.
The source photons to be scattered by dust are difficult to model for distant targets such as GSH 006-15+7 since stars have not been completely surveyed to comparable distances. In fact, the number of observed stars decreases rapidly when the distance from the Sun is greater than 500 pc. Hence, we consider two types of source photons. First, the photons from the bright stars of the TD-1 catalogs are scattered by the foreground dust and the R CrA cloud. Second, for scattering from the supershell GSH 006-15+7, we adopted the interstellar radiation field (ISRF) obtained from the GALPROP code (http://galprop.stanford.edu/ and Moskalenko et al., 2006). GALPROP provides energy density at a specified wavelength, for which we adopt = 1565 Å, as a function of location. It should be noted that = 1565 Å is one of the passbands of the TD-1 catalogs and is located nearly at the center of the FUV passband of GALEX. Furthermore, we confirmed that GALPROP gives a specific energy density at = 1565 Å, which is very similar to the mean energy density averaged over the wavelength range of 1350–1750 Å. We assume the photons, corresponding to the specified energy density at a given location, originate from the Galactic plane and propagate vertically to the supershell, which we believe is reasonable as the supershell is located in the high latitude region and there are not many nearby stars. The scattered photons from the supershell are allowed to interact with the foreground dust as well as R CrA.
With these photon sources, together with the model distribution of foreground dust and R CrA, simulations were conducted for different sets of distance and thickness of the supershell. The distance is varied from 500 pc to 2500 pc with 100 pc steps, and the thickness from 20 pc to 200 pc with 20 pc steps, and the resulting images are compared with the observation for the region below b = -18°and excluding R CrA to obtain the best-fit parameters using the chi-squared minimization method. We note that the region close to the Galactic plane above b = -18°is excluded because of the contamination by the foreground local dust. Figure 3(b) shows the simulated FUV map with 05 05 pixel bins for the best-fit parameters: 1300 pc for the distance to the center of the dust slab and 60 pc for the thickness of the slab. The 1-sigma confidence range of the fit is 1300 800 pc for the distance to the center of the dust slab, which is in good agreement with the estimation of 1500 500 pc by Moss et al. (2012). We have also varied albedo and g-factor over a reasonable range, with albedo from 0.3 to 0.5 and g-factor from 0.4 to 0.7 based on Draine (2003), respectively, to check the dependence of the distance estimation on the changes of these optical parameters. We obtained the distance in the range of 800–2000 pc, which is within the 1-sigma range of the distance obtained with albedo = 0.4 and g-factor = 0.6. While the range of thickness is not well constrained in the present simulations, the best-fit value of 60 pc is similar to the 53 pc estimated from the column density of NH (2.7–7.7) 1020 cm-2 and the number density of nH (1.7–4.8) atoms cm-3 in Moss et al. (2012).
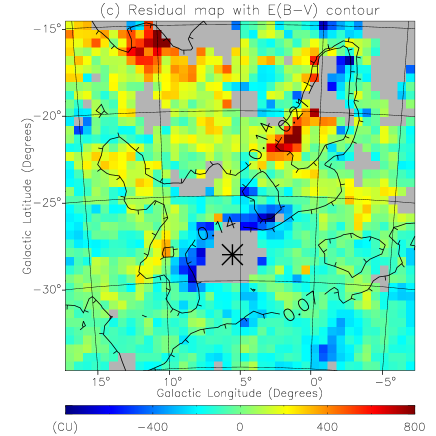
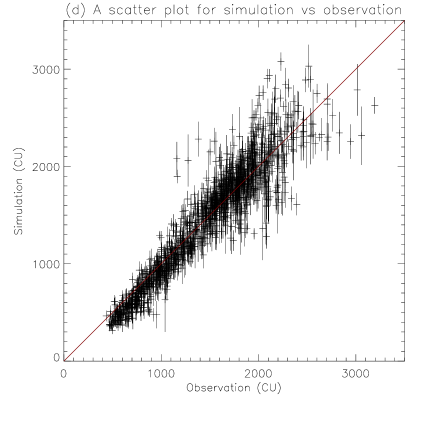
Figure 3(c) is a residual map for the best-fit parameters that shows the difference between the simulation result of Figure 3(b) and the observation of Figure 3(a). Figure 3(d) is a scatter plot obtained from a pixel-to-pixel comparison between the observation and the simulation maps. While the simulation and the observation are in general agreement over the entire region, we see that there are several local regions with marked differences. For example, the simulated intensity is much higher than the observed intensity in the region around (l, b) = (10°, -16°) in Figure 3(c), which is located close to the Galactic plane and affected by the foreground local dust. The large fluctuations above 2000 CU of the observed intensity in Figure 3(d) correspond to this region. Another excess in simulated intensity is seen near (l, b) = (2°, -21°), which is close to R CrA, implying that the discrepancy is due to the imperfect removal of the local dust effect. High simulated intensities in the interval of 1000 to 1500 CU of the observed intensity in Figure 3(d) correspond to this region. On the other hand, the simulated intensity is lower than the observed one in the region around (l, b) = (6°, -28°). Low simulated intensities in the interval of 1700 to 2400 CU of the observed intensity in Figure 3(d) correspond to this region. The region is affected by scattering from the foreground local dust of the photons of a bright star HD189103 located 190 pc from the Sun. HD189103 is the brightest UV star in the region of consideration shown in Figure 3 according to the TD-1 catalogs. With these three regions excluded, together with the region of E(B-V) less than 0.07 where dust scattering effect is expected to be small, the correlation coefficient and the reduced chi-squared value are estimated to be 0.94 and = 3.18, respectively, with 790 degrees of freedom. The rather large value of the reduced chi-square may indicate that the foreground contamination still remains, especially in the low latitude region near the Galactic plane.
3.2. Molecular hydrogen fluorescent emission
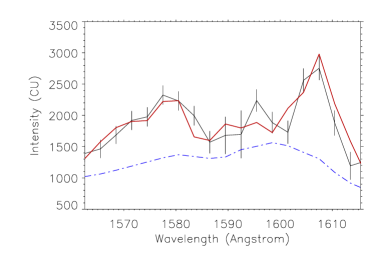
Most of the H2 fluorescent emission seen in Figure 2 originates from the lower supershell region. We modeled this region as a PDR with the radiative transfer simulation code CLOUD (van Dishoeck & Black, 1986; Black & van Dishoeck, 1987). We took the lower supershell region below b = -15°with a thickness of 3°, excluding the R CrA cloud region, whose spectrum is shown in Figure 4 as a black solid line with the spectral resolution of the instrument, which is 3 Å around 1600 Å. We fit the H2 fluorescence lines only for the spectral intervals from 1562 to 1616 Å to avoid the effects from the ion emission lines. The continuum level of FUV emission is shown as a blue dash-dotted line, which generally follows the minimum data points of the spectrum. We assume IUV, a scaling factor representing the local ISRF normalized by the model of Draine (1978), to be 2, in view of the ISRF intensity of 3.5 105 photons s-1 cm-2 Å-1 given by GALPROP at 1300 Å. The trial values and the ranges of parameters in the simulation are as follows: the density nH = [1, 3, 10, 30, 100] cm-3, the temperature T = [10, 30, 100, 300, 1000] K, and the column density of molecular hydrogen N(H2) = 10[15.0-21.0] cm-2 with 100.5 steps. All 325 possible combinations of these fitting parameters were explored in our simulations.
The best-fit model is shown in Figure 4 as a red solid line with the parameters of nH = 30 cm-3, T = 300 K, and N(H2) = 1018.5 cm-2. The reduced chi-squared value is 1.36 with 18 degrees of freedom. The 1-sigma confidence ranges are as follows: N(H2) = 1018.0-20.0 cm-2, nH 10 cm-3, while the temperature is not constrained over the range of 10–1000 K. In fact, the average flux of H2 fluorescent emission was hardly affected over the given range of other parameters when temperature was increased up to 5000 K. As we approximate the total hydrogen column density NH to be the neutral atomic hydrogen column density of 4.7 1020.0 cm-2 suggested by Moss et al. (2012) because the overall contributions by N(H+) and N(H2) are expected to be minimal, the range of the molecular hydrogen column density N(H2) = 1018.0-20.0 cm-2, when divided by the total hydrogen column density NH, yields the H2 abundance, N(H2)/NH, to be 2 10-3 – 2 10-1. This result is reasonable when compared with the model shown in Figure 31.3 of Draine (2011), in which the H2 abundance increases from below 10-6 for the warm neutral medium (WNM) to above 10-1 for the cold neutral medium (CNM), although the transition was obtained for a slightly different value of equilibrium pressure (p/k = 3000 cm-3 K while p/k = 9000 cm-3 K in the present simulation) and occurred at NH of 8 1020 cm-2.
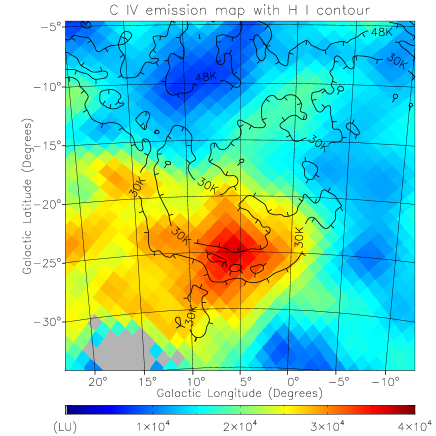
A C iv emission line is prominently seen in the FUV spectrum of Figure 2. As a C iv emission is generally observed in the interface region between hot gas and cold medium at a transition temperature of T 105 K, it should be interesting to locate the origin of this important cooling line. We have constructed a spectral map for the C iv emission line, as shown in Figure 5, with its intensities given in Line Units (photons s-1 cm-2 sr-1, henceforth LU) integrated over the wavelength range of 1540–1560 Å. The map is plotted with a 1°pixel size, but an averaged spectrum of 4°centered around each pixel was fitted to enhance the signal-to-noise ratios (S/N).
We see that, while the C iv emission peaks in the bottom region of the shell, the large angular extent of the emission region across the shell over more than ten degrees, without any resemblance to the shell-like morphology, indicates that the emission may not be related to the structure of the present supershell. Furthermore, the high intensity of 3 104 LU may not be consistent with the quite evolved (15 Myrs old) and distant nature of the shell. For example, the peak C iv intensity was estimated to be 6000 LU at the boundary of the Orion-Eridanus superbubble whose age is a few Myrs, much younger than GSH 006-15+7. Moss et al. (2012) also found that soft X-rays do not show any convincing features associated with the supershell. Hence, we believe the bright C iv emission in this region is of local origin, perhaps the Local Hot Bubble or Loop I superbubble. In this regard, we note that Sallmen et al. (2008) observed C iv intensity above 104 LU toward the interaction zone of the Local Hot Bubble and Loop I.
4. Summary
We have reported here the results of analysis based on the FUV observations of GSH 006-15+7 made with GALEX and FIMS. The main findings are as follows.
1. FUV emission is seen to be enhanced above 2000 CU in the lower supershell region (b -15°) of the supershell region, which was demonstrated to mostly come from the dust scattering of interstellar photons of the region.
2. Monte Carlo simulation for dust scattering was performed for the lower supershell region under the theoretical albedo of 0.4 and asymmetry factor of 0.6 and the distance to GSH 006-15+7 was estimated to be 1300 800 pc, corresponding well with the previous estimation of 1500 500 pc based on kinematics.
3. Molecular hydrogen fluorescence features are seen in the spectrum of the lower supershell region: a PDR simulation indicated an H2 column density of N(H2) = 1018.0-20.0 cm-2 and the total hydrogen density of nH 30 cm-3.
4. An enhanced C iv emission is seen in the region of present consideration, but it originates from a broad region across the shell, indicating its irrelevance to the shell.
References
- Black & van Dishoeck (1987) Black, J. H., & van Dishoeck, E. F. 1987, ApJ, 322, 412
- Boumis et al. (2001) Boumis, P., Dickinson, C., Meaburn, J., et al. 2001, MNRAS, 320, 61
- Choi et al. (2013) Choi, Y.-J., Min, K.-W., Seon, K.-I., et al. 2013, ApJ, 774, 34
- Draine (1978) Draine, B. T. 1978, ApJS, 36, 595
- Draine (2003) Draine, B. T. 2003, ARA&A, 41, 241
- Draine (2011) Draine, B. T. 2011, Physics of the Interstellar and Intergalactic Medium (Princeton, NJ: Princeton Univ. Press), Chapter 31
- Edelstein et al. (2006a) Edelstein, J., et al. 2006a, ApJ, 644, L153
- Edelstein et al. (2006b) Edelstein, J., et al. 2006b, ApJ, 644, L159
- Ehlerová & Palouš (2005) Ehlerová, S., & Palouš, J. 2005, A&A, 437, 101
- Ehlerová & Palouš (2013) Ehlerová, S., & Palouš, J. 2013, A&A, 550, A23
- Frail et al. (1994) Frail, D. A., Goss, W. M., & Whiteoak, J. B. Z. 1994, ApJ, 437, 781
- Gaustad et al. (2001) Gaustad, J. E., McCullough, P. R., Rosing, W., & Van Buren, D. 2001, PASP, 113, 1326
- Heiles (1979) Heiles, C. 1979, ApJ, 229, 533
- Heiles (1984) Heiles, C. 1984, ApJS, 55, 585
- Heiles et al. (1999) Heiles, C., Haffner, L. M., & Reynolds, R. J. 1999, in ASP Conf. Ser. 168, New Perspectives on the Interstellar Medium, ed. A. R. Taylor, T. L. Landecker, & G. Joncas (San Francisco, CA: ASP), 211
- Henyey & Greenstein (1941) Henyey L. G., Greenstein J. L. 1941, ApJ, 93, 70
- Hurwitz et al. (1991) Hurwitz, M., Bowyer, S., & Martin, C. 1991, ApJ, 372, 167
- Jo et al. (2011) Jo, Y.-S., Min, K.-W., Seon, K.-I., Edelstein, J., & Han, W. 2011, ApJ, 738, 91
- Jo et al. (2012) Jo, Y.-S., Min, K.-W., Lim, T.-H., & Seon, K.-I. 2012, ApJ, 756, 38
- Kalberla et al. (2010) Kalberla, P. M., McClure-Griffiths N. M., Pisano, D. J., et al. 2010, A&A, 521, 17
- Kim et al. (2007) Kim, I.-J., Min, K.-W., Seon, K.-I., et al. 2007, ApJ, 665, L139
- Knude & Hog (1998) Knude, J., & Hog, E. 1998, A&A, 338, 897
- Lee et al. (2006) Lee, D.-H., Yuk, I.-S., Jin, H., et al. 2006, ApJ, 644, L181
- Lim et al. (2013) Lim, T.-H., Min, K.-W., & Seon, K.-I. 2013, ApJ, 765, 107
- McClure-Griffiths et al. (2002) McClure-Griffiths, N. M., Dickey, J. M., Gaensler, B. M., & Green, A. J. 2002, ApJ, 578, 176
- McClure-Griffiths et al. (2009) McClure-Griffiths, N. M., Pisano, D. J., Calabretta, M. R., Ford, H. A., Lockman, F. J., et al. 2009, ApJS, 181, 398
- Misiriotis et al. (2006) Misiriotis, A., Xilouris, E. M., Papamastorakis, J., Boumis, P., & Goudis, C. D. 2006, ARA&A, 459, 113
- Morrissey et al. (2007) Morrissey, P., Conrow, T., Barlow, T. A., et al. 2007, ApJS, 173, 682
- Moskalenko et al. (2006) Moskalenko, I. V., Porter, T. A., & Strong, A. A. 2006, ApJ, 640, L155
- Moss et al. (2012) Moss, V. A.,McClure-Griffiths N. M., Braun, R., Hill, A. S., & Madsen, G. J. 2012, MNRAS, 421, 3159
- Parenago (1945) Parenago, P. P. 1945, PA, 53, 441
- Reynolds et al. (1998) Reynolds, R. J., Tufte, S. L., Haffner, L.M., Jaehnig, K., & Percival, J.W. 1998, pasa, 15, 14
- Rossano (1978) Rossano, G. 1978, AJ, 83, 234
- Ryu et al. (2006) Ryu, K., Min, K.-W., Park, J.-W., et al. 2006, ApJ, 644, L185
- Sallmen et al. (2008) Sallmen, S. M., Korpela, E. J., & Yamashita, H. 2008, ApJ, 681, 1310
- Schlegel et al. (1998) Schlegel, D. J., Finkbeiner, D. P., & Davis, M. 1998, ApJ, 500, 525
- Seon et al. (2006) Seon, K.-I., Han, W., Nam, U.-W., et al. 2006, ApJ, 644, L175
- Seon et al. (2011) Seon, K.-I., Edelstein, J., Korpela, E., et al. 2011, ApJS, 196, 15
- Suad et al. (2014) Suad, L. A., Caiafa, C. F., Arnal, E. M., & Cichowolski, S. 2014, A&A, 564, 116S
- Tenorio-Tagle & Bodenheimer (1988) Tenorio-Tagle, G. & Bodenheimer, P. 1988, ARA&A, 26, 145
- van Dishoeck & Black (1986) van Dishoeck, E. F., & Black, J. H. 1986, ApJS, 62, 109