SETUP FOR THE NUCLOTRON BEAM TIME STRUCTURE MEASUREMENTS
A.Yu. Isupov†,‡,111Corresponding author., V.P. Ladygin†, and S.G. Reznikov†
† Joint Institute for Nuclear Research, 141980 Dubna, Russia
‡ E-mail: isupov@moonhe.jinr.ru
Abstract
The setups for precise measurements of the time structure of Nuclotron internal and slowly extracted beams are described in both hardware and software aspects. The CAMAC hardware is based on the use of the standard CAMAC modules developed and manufactured at JINR. The data acquisition system software is implemented using the ngdp framework under the Unix-like operating system (OS) FreeBSD to allow the easy network distribution of the online data. It is demonstrated that the described setups are suitable for the continuous beam quality monitoring during the experiments performed at Nuclotron.
Keywords: CAMAC, data acquisition system, network distributed system, graphic user interface, beam time structure
PACS: 29.27.Fh, 07.05.Hd
Introduction
The experimental program at Nuclotron for heavy ion collisions [1, 2], few body [3] and polarization [4, 5] physics requires good quality of the internal and extracted beams. The time structure of the beam plays a crucial role in the experiments requiring high interaction rate. One of the parameters reflecting the beam time structure is the coefficient defined as
| (1) |
where is the beam current, is the time of the beam exposition. The real experiment requires that the coefficient should be about 0.85—0.95 for the efficient data taking.
Another problem of the experiment related with the beam time structure is the correct estimation of the data acquisition dead-time. This is important not only for the cross section evaluation, but also for the polarization measurements due to effect of the dead-time distortion [6]. For instance, large dead-time of the data acquisition (DAQ) due to oscillating interaction rate could significantly reduce the asymmetry values during the measurements of the analyzing powers [7, 8]. Such effect is especially important for the polarization measurements requiring the absolute normalization of the beam intensity or interaction rate in the wide range as in the TPD experiment on the measurements of the induced tensor polarization of deuteron beam travelling through matter [9, 10].
The Nuclotron internal target station (ITS) is an efficient tool to perform nuclear physics studies at energies from hundreds of MeV to several GeV per nucleon with both polarized and unpolarized beams [11]. However, in this case the useful events yield is the time dependent function of the beam and moving internal target interaction. Recently, new system of the ITS control and data acquisition has been developed [12]. In particular, the internal target mechanical vibrations were studied in details using this new system [12].
The Nuclotron extracted deuteron beam time structure has been studied previously during data taking of the TPD experiment [9, 10], on the measurements of the soft photons yield [13], and by the BM@N experiment [1]. The CAMAC and VME [14] based DAQ systems were used for the measurements performed at 4V [9, 10, 13] and 6V [1] beamlines, respectively. These measurements were performed in the trigger mode of the DAQ systems, when the information was read for each trigger. However, such mode cannot provide correct information on the beam time structure at high trigger rate due to dead-time distortion. These circumstances motivate us to organize the setup with negligible dead-time and to use it for the Nuclotron beam time structure measurements.
The goal of the paper is to report the details of the setups for the Nuclotron internal and extracted beam time structure measurements as well as first results obtained with deuteron, 7Li, and 12C beams. The paper is organized in the following way. The chapter 1 contains the details of the hardware and software of the setups for the Nuclotron beam time structure investigations. The results on the extracted beam time structure are presented in chapter 2. The results on the investigation of the internal beam-target interaction are reported in chapter 3. The conclusions are drawn in the last chapter.

| Command | Description |
|---|---|
| load |
loads and configures the
spill(4) and ng_camacsrc kernel modules,
connects latter to ng_fifos input
|
| unload | counterpart for previous |
| loadw |
loads the writer(1) module
and connects it to ng_fifos output. RUNFILE and DATADIR
variables could be defined
|
| unloadw | counterpart for previous |
| loadb2h |
loads the b2h(1) module
and connects it to ng_fifos output. RUNFILE
variable could be defined
|
| unloadb2h | counterpart for previous |
| continue | starts the handling of CAMAC interrupts |
| swstart | starts the handling of CAMAC interrupts with software BoB imitation by callout(9) mechanism |
| pause | counterpart for two previous |
| init | initializes the CAMAC hardware |
| finish | counterpart for previous |
| cleanall | resets all histograms in the b2h(1) |
| saveall |
stores all b2h(1) histograms into
ROOT TFile on hard disk (if RUNFILE variable was
supplied for loadb2h)
|
| disconn | disconnects all clients from b2h(1) |
| status | outputs status messages from present modules through syslogd(8) |
| seelog | starts the syslogd(8) output file qdpblog viewing by tail(1) |
1 Setup hardware and software
1.1 CAMAC electronics
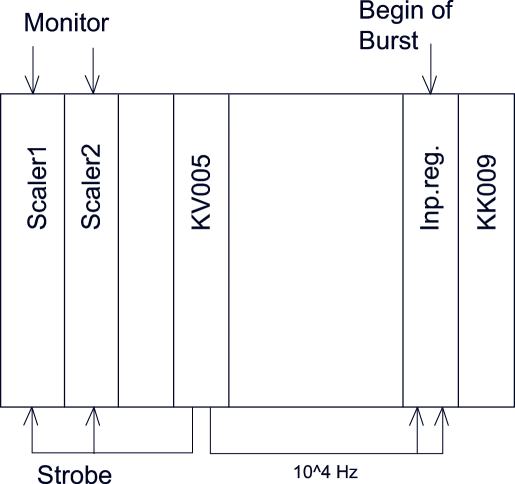
Each setup contains input register, two identical scalers, and pulse generator CAMAC modules. Their functional scheme is outlined in Fig. 1. All CAMAC units were developed and produced at JINR. Both setups have the same modules disposition in the read-out crate.
The input register collects three inputs — accelerator cycle begin
and two triggers — which lead to the LAM assertion.
The input register is the only LAM source in the read-out
crate, and the KK009 crate controller [15] is programmed to set the
interrupt request (IRQ) at each LAM occurrence. Each of this IRQ leads to the
invocation of the CAMAC interrupt handler function from the spill
loadable kernel module (see chapter 1.2).
Each of two triggers corresponds to scaler module should be read-out at current
interrupt handler invocation. The two triggers should alternate strictly, so
the Spill DAQ is able to handle unproper trigger bit combinations and
trigger sequences.
The KV005 [16] generator was used to produce the trigger signals sequence with the base frequency of Hz, which corresponds to the time slice of 100 s.
The beam-target interaction intensity is measured by monitor scintillation counter, whose signal is split to fed the 0th input of both scalers. The odd scaler counts during odd time slice and is read-out during even one, and the even scaler — vice versa. This scheme allows us to avoid undercounts, only up to 1 pulse could be erroneously dropped or added in each time slice.
Because we read from scalers the least 16 bits only at each 100 s time slice, the setups are able to consume counts with rate up to Hz. This is more than enough because scalers are able to input up to Hz.
| Beam, | (%) | ||||||||
|---|---|---|---|---|---|---|---|---|---|
| (AGeV) | (ms) | (ms) | for as .. (Hz) | ||||||
| 0..1 | 100..400 | 400..800 | 800..1200 | 1200..1600 | 1600..2000 | ||||
| d, 3.5 | 0.49 | 1000 | 2700 | 2.4 | 21.0 | 6.48 | 5.1 | 16.4 | 11.56 |
| C, 3.5 | 0.218 | 900 | 2600 | 1.3 | 16.0 | 7.56 | 4.63 | 6.3 | 5.1 |
| 7Li, 3.5 | 0.374 | 300 | 1400 | 2.0 | 15.1 | 15.86 | 10.66 | 5.82 | 4.27 |
| Beam, | Target | (%) | |||||
|---|---|---|---|---|---|---|---|
| (AGeV) | for as .. (Hz) | ||||||
| 0..1 | 49..51 | 99..101 | 149..151 | ||||
| d, 0.25 | CH2 | 0.56 | 13.0 | 3.2 | 7.9 | 4.4 | 1.5 |
| d, 0.25 | C | 0.82 | 19.5 | 1.1 | 1.0 | 0.26 | 0.08 |
| d, 3.5 | CH2 | 0.926 | 32.0 | 5.4 | 5.4 | 0.6 | 0.35 |
| d, 3.5 | C | 0.918 | 30.1 | 0.9 | 5.9 | 1.1 | 0.53 |

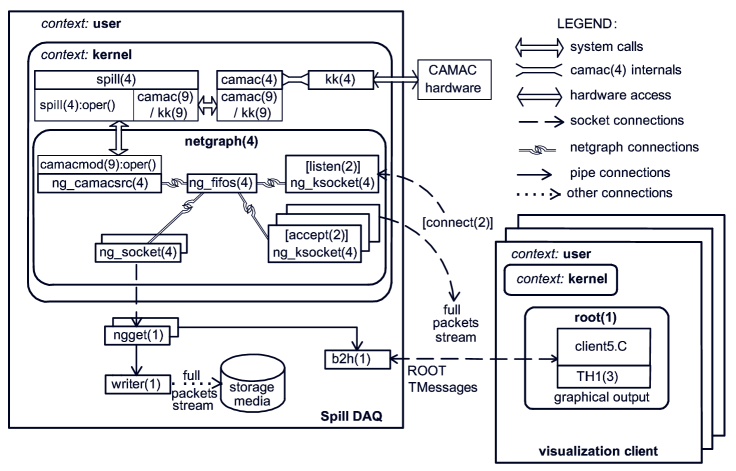
1.2 Spill DAQ system
Both setups have very similar software however each uses own hardware,
in particular the main host.
The overall Spill DAQ layout is pictured in
Fig. 2, where we can see the main host
under the FreeBSD OS as the rectangle entitled “Spill DAQ”,
and optional hosts — as the rectangles
“visualization client”.
This main host deals with the CAMAC hardware using the PK009 ISA adapter
for the KK009 CAMAC crate controller [15].
In the OS kernel context it has the
camac(4) facility [17],
spill(4) CAMAC
kernel module,
as well as the modules in the
netgraph(4) package [18] style
(Fig. 3).
Fig. 3 shows the data streams
transportation from the spill(4) CAMAC kernel module
through the nodes, which are represented as
rectangles with node name (up), type (left), and ID (right). The data streams
are propagated along the graph edges, which are formed by pairs of
connected hooks [18] (octagons in Fig. 3).
The data are
injected into graph by the camacsrc node and demultiplexed by the
fifos node into more than one identical streams, which could be transferred
both locally and remotely. In Fig. 2 we can see
two of the data stream consumers: writer(1)
and b2h(1), whose standard inputs are
fed by standard outputs of ngget(1) instances, which
reads the fifos local outputs through the
netgraph sockets provided by ng_socket(4) node
instances.
Each fifos output as well as their input could be
connected and disconnected without disturbing other one(s).
Due to fifos loading during the OS boot sequence all
load user commands (see Table 1) are independent
from each other.
The “visualization client” in
Fig. 2 executes one of the possible clients of the
b2h(1) server — the ROOT script
client5.C .
The netgraph(4) package [18]
and ngdp framework
[19, 20]
involvement reduces the DAQ system
implementation efforts essentially,
because a number of software modules
are ready to use:
ng_camacsrc(4), ng_fifos(4),
ngget(1) [20],
writer(1) [21],
ng_ksocket(4), ng_socket(4).
The produced data could be distributed
in form of both the ngdp packet stream(s) (for raw cycle-by-cycle
ones) and ROOT framework [22] TMessages (for
b2h(1) produced
histograms). Specifically for the Spill DAQ we implement only
the spill(4), spillconf(1),
spilloper(1), and b2h(1)
software modules.
The spill(4) module is intended to work with the
corresponding CAMAC hardware (see 1.1).
It
complies with requirements
of the camac(4) and ng_camacsrc(4),
so implements the CAMAC interrupt handler function. This handler
recognizes the following interrupt occurrences (events):
begin of burst (BoB),
odd and even trigger at end of 100 s time slice.
In total two data packet types are produced
to contain as follows:
CYC_BEG —
the BoB timestamp,
CYC_END — the read-out scaler data as the sequence of 50000 16-bit
little-endian values to cover up to
5 s of burst. The CYC_END packet type is produced at obtaining the
50000th end-of-slice interrupt.
The CAMAC hardware description and handling are separated from the spill(4) module’s source and grouped together in the single spill_hardware.h header file. In the current implementation it uses macro interface kk(9) specific for the KK009 crate controller [15] instead of the crate controller independent one camac(9), because the former interface allows us to perform each CAMAC cycle slightly faster [23].
The spill(4) module can be configured at startup by the
spillconf(8) utility and
controlled during operation by the spilloper(8) one.
To operate with the Spill DAQ it has the configuration file
(named by default $NGDPHOME/etc/spillsv.conf) in the
Makefile format (see also
make(1)). This file establishes the correspondence between
the user commands
(“targets” in make(1) terminology)
and actions which should be performed. This file is textual and could be
revised easily. So typical user command look like the following:
make -f spillsv.conf RUNFILE=test loadw
All the defined user commands we summarize in the Table 1.
The b2h(1) (for “binary to histograms”) module is
intended for ROOT histograms filling from the packet (binary) data
representation
obtained from ng_fifos node output. Due to simple nature of our setups
we use the compiled-in histograms configuration from hconf.h header
file. The 50000-bin histograms for at least last cycle and sum during current
run, and optionally their Fourier transforms are booked at
b2h(1) startup. At each CYC_END packet
arrival these histograms and some statistics are updated.
Namely, for 50 bins of 100 ms the mean of counts, its standard deviation,
dispersion and dispersion per mean are calculated and printed to standard
error output. The
b2h(1) listen(2)s on port 12342 for the
client registration. For each registered client the b2h(1)
sends all histograms by TMessages once per cycle. Also all configured
histograms are written optionally to ROOT TFile periodically or at
b2h(1) termination as well as at SIGHUP signal
obtaining. The SIGINT signal resets all histograms, SIGUSR1
and SIGUSR2 switches to read-and-discard
mode and vice versa. For user termination in
accuracy manner the SIGTERM signal should be used.
The ROOT script client5.C connects to b2h(1)
server, obtains TH1F histograms encoded into TMessages, and
draws each of them in separate TCanvases. To allow the full
user interaction with these histograms the script should be terminated (i.e.,
by twice <Ctrl><C> pressing), because the proper coexistence of two endless
loops (for TSocket reading and X11 [24] events handling)
could be managed only
in the executable like histGUI(1)
[20].
2 Nuclotron extracted beam results
The first setup version was implemented in 2009 and successfully used during 7 Nuclotron runs in 2011–2015 to measure the extracted deuteron, carbon, and 7Li beams time structure. The scintillation counter ( mm3) with XP2020Q PMT movable by motor was situated in the beam halo near the F4 focus of the VP1 transport beamline. The PMT pulses shaped by 4F-115 discriminator were used as the input monitor counts for the setup.
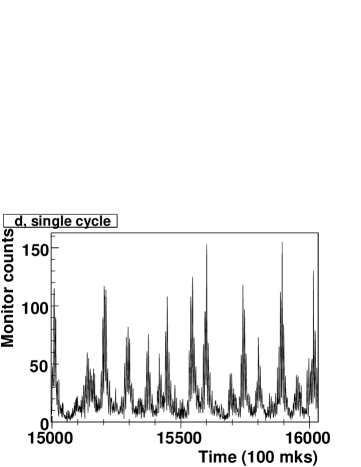
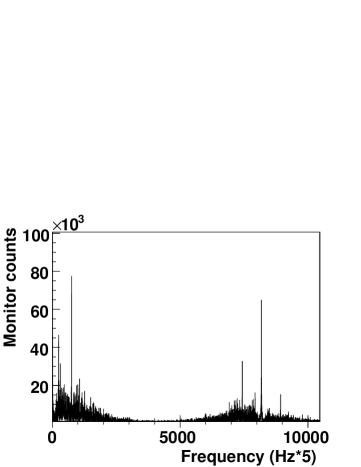
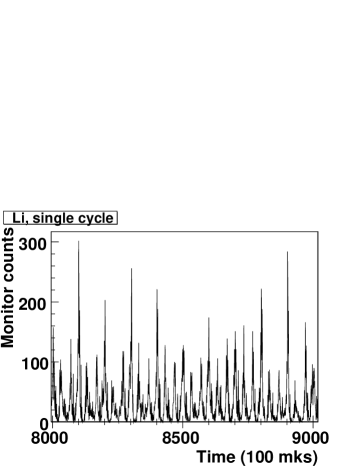
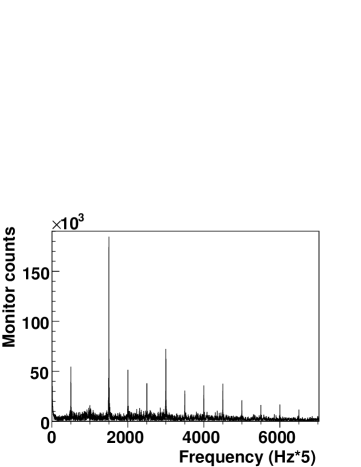
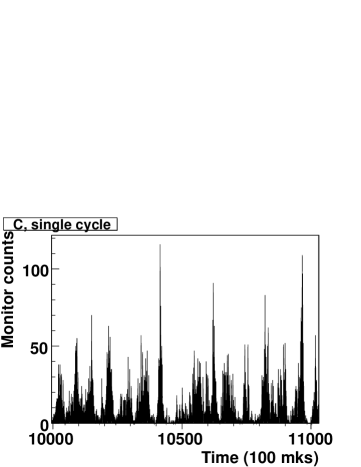
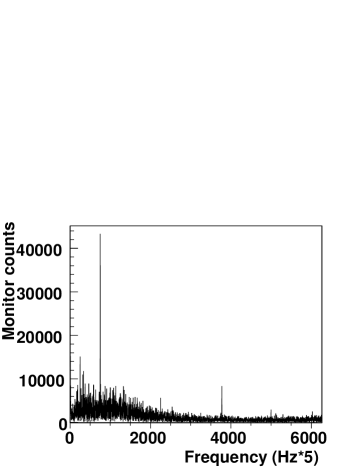
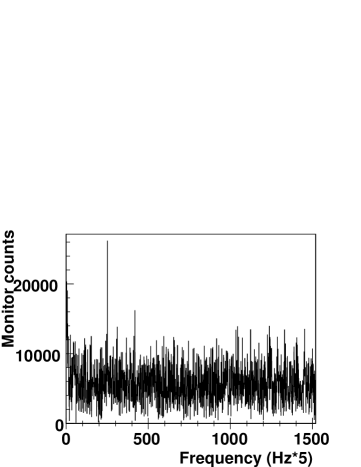
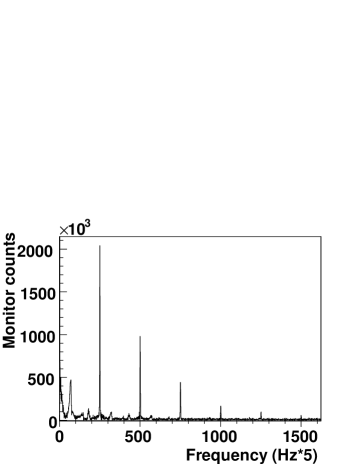
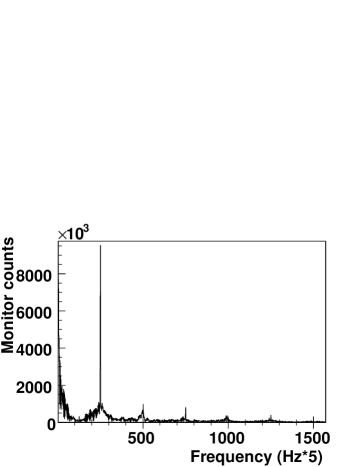
The measurements were performed during the data taking on the measurements of the soft photons yield [13]. The typical averaged number of the counts in the 100 time slice was 28, 24 and 7 per beam spill for the 7Li, deuteron and carbon beam, respectively. In Figs. 4—6 the typical monitor counts proportional to the beam-target interaction rate during a single cycle are shown for the beam of deuterons, 7Li, and carbon with 3.5 AGeV kinetic energy. The abscissa is a time bin number, the ordinate is the number of counts in the corresponding bin. The bin width is equal to the time slice, 100 s. The typical 0.1 s time windows are shown on the right panels instead of the full burst timescale. The value (see equation (1)) could be obtained easily from these data in online or offline. For the single cycles depicted in Figs. 4—6 the during the full burst time are represented in Table 2. We are not show the whole run (per-bin cumulative sum) histograms because the single cycle statistics is large enough. The Fourier transforms of the corresponding full burst statistics are shown in Figs. 4—6 on the left panels. As one can see, some frequencies (50 Hz and harmonics) are emphasized. Their origin is a time structure of the slowly extracted beam. The ratio values for some set of frequency ranges (in Hz) are represented in Table 2. The coefficient is smaller than 0.5. This reflects the large width of the frequency spectrum (see right panels in Figs. 4—6). On the other hand, the contribution of the harmonics proportional to 50 Hz is lower than 7 % in the worst case of 7Li. One can conclude, that significant improvement of the extracted beam time structure is required for the high intensity experiments, for instance, by the feedback from the monitor counter to the accelerator.
3 Nuclotron internal beam results
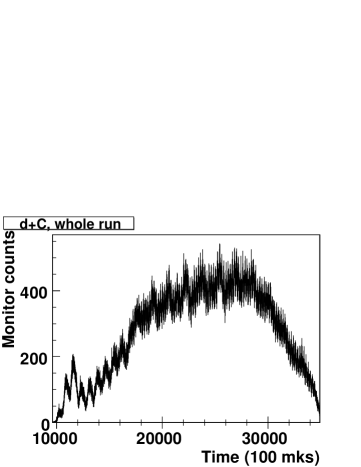
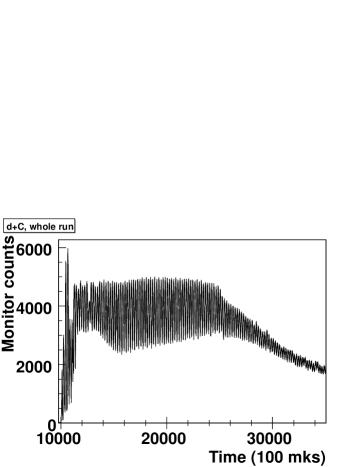
The second setup version for the Nuclotron internal beam was implemented in 2014 and successfully used during 2 Nuclotron runs (June’2014 and March’2015) to measure the time scans of the beam-target interactions in the accelerator ring. The scintillation counter ( mm3) with FEU-30 PMT observes the beam-target interaction point of the Nuclotron internal target station (ITS) [12] from 1 m distance under 60∘ angle in horizontal plane to produce the input monitor counts for both ITS and current setup DAQ systems. The analog signal from PMT with the rising time of ns and total duration of ns is shaped by the 4F-115 discriminator with mV threshold. The duration of the output pulse is ns. In the second setup version the counting is started by hardware at the same time offset for each cycle (with ns uncertainty) after the BoB event occurrence. This allows us to work with the whole run histograms because the subtle counting start variation in time can not “smudge” the time structure on such additive picture.
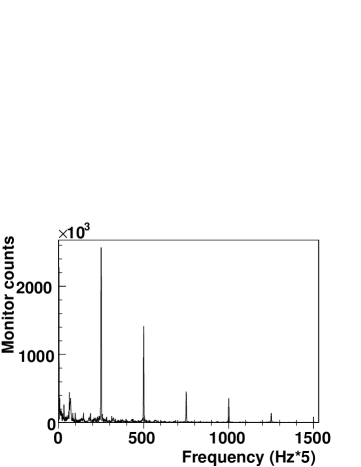
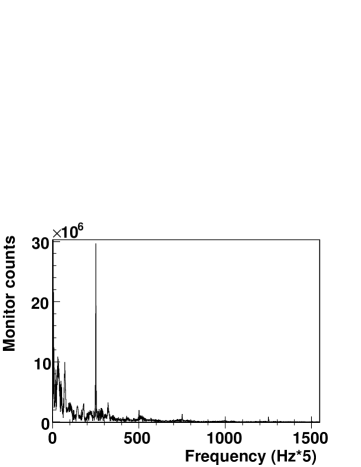
The quality of the electronic chain has been checked using 106Ru radioactive (RA) source. The Fourier transform of the monitor counts from the 106Ru RA source is shown on the left panel in Fig. 7 for the whole run. These data were obtained while the 150 AMeV deuteron beam was accelerated and circulated in the Nuclotron ring, however the internal target was not run. The averaged number of counts in the 100 s time slice is . The data demonstrate white noise picture that proofs the quality of the used electronic chain. The right panel in Fig. 7 shows the Fourier transform of the monitor counts from both the deuterons of the same energy on CH2 target and the 106Ru RA source simultaneously. The frequencies corresponding to target mechanical vibrations and to the Hz harmonics are clearly seen.
The data on the deuteron beam time structure were obtained simultaneously with the data taking for the DSS experiment [3] with 10 m CH2 foil and 8 m carbon multiwire targets with the typical intensity of deuterons per spill. The typical averaged number of the counts in the 100 s time slice was and per spill at the beam energy of 250 AMeV and 3.5 AGeV, respectively.
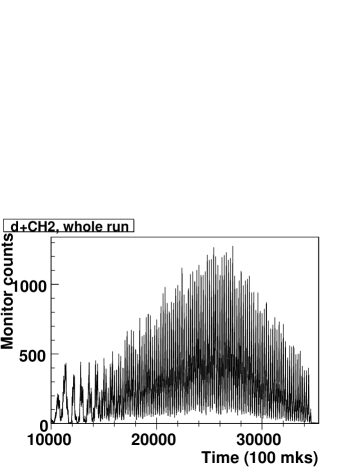
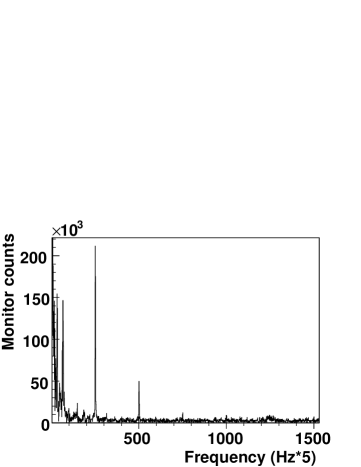
In Figs. 8 and 9 we can see the full burst timescale (left panels) of the monitor counts during the whole run (per-bin cumulative sum) from the beam of deuterons with 250 AMeV kinetic energy interacting with the CH2 and C targets, respectively. The Fourier transforms of the corresponding full burst statistics for the CH2 and C target are shown in Figs. 8 and 9 on right panels. The same for the 3.5 AGeV deuteron beam is shown in Figs. 10 and 11. One can see some frequencies (50 Hz and harmonics) other than originated from the mechanical target vibrations are enhanced, however their relative intensity is decreased with the frequency increasing. Their origin can be a space-time structure of the Nuclotron internal beam. The ratio values for some set of enhanced frequencies in narrow ranges Hz are represented in Table 3. The “” column contains this ratio for mechanical vibrations frequency of the internal target ( Hz for C and Hz for CH2 in the represented data). The results confirm the earlier observation [12] that the mechanical vibrations are larger for CH2 target. The coefficient is at 3.5 AGeV for both targets. The contribution of the Hz harmonics is only about %. However we observe the significant difference in coefficient and contribution of the Hz harmonics for CH2 and C targets at low energies. For carbon target the and the Hz harmonics contribution is only 1.5 %. Therefore, one can conclude that the time structure of the internal beam interaction with carbon target allows one to perform experiments at ITS. For CH2 target the is only 0.56 and the Hz harmonics contribution is %. The reason of this difference is the subject of further studies.
Conclusions
The results of the present work can be summarized as follows:
Two similar setups for precise measurements of the Nuclotron beam time
structure are designed using standard CAMAC modules produced at LHEP and DLNP.
They are commissioned for the experiments at internal target and at the slowly extracted beam.
Both setups are working with the
100 s time slices, so they are able to investigate
the frequency domain up to kHz.
The data on the beam time structure could be easily distributed online
through network on the cycle-by-cycle basis
due to Spill DAQ design on base of the ngdp framework
[19, 20].
Therefore, these setups are suitable to work continuously
during the whole Nuclotron run
and provide data for the beam quality estimations.
The first setup version was successfully used to measure the time
structure of the slowly extracted beam of deuterons, 7Li, and carbon at
3.5 AGeV.
The second setup version was used to measure the time structure of the
beam-target interaction inside the Nuclotron ring at ITS [11, 12].
It has been found the influence of the mechanical vibrations of the internal target
on the data taking.
The developed setups can be efficiently used as a tool for the
permanent monitoring of the Nuclotron beam quality during the experiments
performed at Nuclotron.
Acknowledgments
The authors have the pleasure to thank Prof. L.S.Zolin for initiation of this work, cooperation during measurements, and permanent interest to results, the Nuclotron team and in particular Dr. A.V.Butenko — for fruitful cooperation. The authors are grateful to A.N. Livanov, S.M. Piyadin, and A.N. Khrenov for the technical support during the measurements at internal target. The present work was supported in part by the RFBR Grant no.13-02-00101a.
References
- [1] Ablyazimov T.O. et al. (BM@N Collaboration). Conceptual Design Report of BM@N. Dubna: JINR, 2012.
- [2] Ladygin V. P. , Ablyazimov T. O.,Aichelin J., et al. Study of strange matter production in the heavy ion collisions at Nuclotron. // Proceedings of XXI Intern. Seminar on High Energy Physics Problems (ISHEPP’2012), Dubna, Russia, 2012. PoS 038, 2012. P. 1–8.
- [3] Ladygin V.P., Gurchin Yu.V., Piyadin S.M., Terekhin A.A., Isupov A. Yu., et al. Few-body Studies at Nuclotron-JINR. // Few Body Systems. 2014. V. 55. P. 709–712.
- [4] Ladygin V.P. et al. Spin physics in few body systems at Nuclotron. // Particles and Nuclei. 2014. V. 45. P. 327.
- [5] Ladygin V.P. Polarization effects in hadronic reactions in a GeV region. // Proceedings of XXII Intern. Seminar on High Energy Physics Problems (ISHEPP’2014), Dubna, Russia, 2014. PoS 098, 2012. P. 1.
- [6] Ladygin V.P. Dead-time distortion in polarization measurements. // Nucl.Instr.and Meth.in Phys.Res.A. 1999. V. 437. P. 98.
- [7] Kurilkin P.K. et al. Measurement of the vector and tensor analyzing powers for - elastic scattering at 880 MeV. // Phys.Lett.B. 2012. V. 715. P. 61.
- [8] Kurilkin P.K. et al. Investigation of the angular dependence of the analyzing powers in the deuteron-proton elastic scattering at the nuclotron. // Particles and Nuclei, Letters. 2011. V. 8. P. 1081.
- [9] Azhgirey L.S. et al. Observation of tensor polarization of deuteron beam traveling through matter. // Particles and Nuclei, Letters. 2008. V. 5. P. 728–735.
- [10] Azhgirey L.S. et al. Measurement of tensor polarization of a deuteron beam passing through matter. // Particles and Nuclei, Letters. 2010. V. 7. P. 27.
- [11] Malakhov A.I. et al. Potentialities of the internal target station at the Nuclotron. // Nucl.Instr.and Meth.in Phys.Res.A. 2000. V. 440. P. 320–329.
- [12] Isupov A. Yu., Krasnov V. A., Ladygin V. P., Piyadin S. M., and Reznikov S. G. The Nuclotron Internal Target Control and Data Acquisition System. // Nucl. Instr. and Meth. in Phys. Res. A. 2013. V. 698. P. 127–134.
- [13] Aleev A. et al. (SVD Collaboration). Study of pp Interactions at U-70. // Nonlin. Phenom. Complex Syst. 2014. V. 17. P. 448–450.
- [14] http://afi.jinr.ru/VMEDAQ , 2012.
- [15] Churin I. and Georgiev A. // Microprocessing and Microprogramming. 1988. V. 23. P. 153.
- [16] Antyukhov V.A. et al. The digital CAMAC modules. Issue V (in Russian). JINR Commun. 10–10576. Dubna, 1977. P. 14.
- [17] Gritsaj K. I. and Olshevsky V. G. Software package for work with CAMAC in Operating system FreeBSD (in Russian). // JINR Commun. P10–98–163. Dubna, 1998. 16 p.
- [18] http://www.freebsd.org/cgi/man.cgi?query=netgraph&sektion=4 , 2008.
- [19] Isupov A. Yu. The ngdp framework for data acquisition systems. arXiv:1004.4474 [physics.ins-det], 2010. 20 p.
- [20] Isupov A. Yu. CAMAC subsystem and user context utilities in ngdp framework. arXiv:1004.4482 [physics.ins-det], 2010. 20 p.
- [21] Gritsaj K. I. and Isupov A. Yu. A Trial of Distributed Portable Data Acquisition and Processing System Implementation: the qdpb – Data Processing with Branchpoints. // JINR Commun. E10–2001–116. Dubna, 2001. 19 p.
- [22] Brun R. and Rademakers F. ROOT – An Object Oriented Data Analysis Framework. // Proc. of the AIHENP’96 Workshop, Lausanne, Switzerland, 1996. Nucl.Instr.and Meth.in Phys.Res.A. 1997. V. 389. P. 81–86.
- [23] Isupov A. Yu. SPHERE DAQ and off–line systems: implementation based on the qdpb system. // JINR Commun. E10–2003–187. Dubna, 2003. 17 p.
- [24] Volume 0: X Protocol Reference Manual. / Ed.: Adrian Nye. 3rd ed. N.-Y.: O’Reilly & Associates, 1992.