HOROLOGIUM II: A SECOND ULTRA-FAINT MILKY WAY SATELLITE IN THE HOROLOGIUM CONSTELLATION
Abstract
We report the discovery of a new ultra-faint Milky Way satellite candidate, Horologium II, detected in the Dark Energy Survey Y1A1 public data. Horologium II features a half light radius of pc and a total luminosity of that place it in the realm of ultra-faint dwarf galaxies on the size-luminosity plane. The stellar population of the new satellite is consistent with an old ( Gyr) and metal-poor ([Fe/H]) isochrone at a distance modulus of , or a heliocentric distance of kpc, in the color-magnitude diagram. Horologium II has a distance similar to the Sculptor dwarf spheroidal galaxy ( kpc) and the recently reported ultra-faint satellites Eridanus III ( kpc) and Horologium I ( kpc). All four satellites are well aligned on the sky, which suggests a possible common origin. As Sculptor is moving on a retrograde orbit within the Vast Polar Structure when compared to the other classical MW satellite galaxies including the Magellanic Clouds, this hypothesis can be tested once proper motion measurements become available.
Subject headings:
Local Group - Galaxy: halo - galaxies: dwarf - galaxies: individual (Horologium II) - galaxies: stellar content1. Introduction
Over the last decades wide-field imaging surveys have systematically revealed new satellite companions to the Milky Way (MW). Especially, the Sloan Digital Sky Survey (SDSS; York et al., 2000) was instrumental in establishing a new class of stellar systems, the ultra-faint dwarf (UFD) galaxies (e.g. Willman et al., 2005; Zucker et al., 2006; Belokurov et al., 2006; Irwin et al., 2007; Walsh et al., 2007; Grillmair, 2009), thereby more than doubling the number of known MW satellite galaxies over half the northern hemisphere. Deep imaging follow-ups and spectroscopic studies suggest that the UFDs hold typically old (e.g. Muñoz et al., 2010; Sand et al., 2012; Brown et al., 2014) and metal poor (e.g. Kirby et al., 2008; Frebel et al., 2010; Norris et al., 2010) stellar populations. The high mass-to-light ratios of the UFDs () inferred from internal kinematics (e.g. Martin et al., 2007; Simon & Geha, 2007; Simon et al., 2011) is one of properties that differentiate them from star clusters (Willman & Strader, 2012). The efforts to find new MW satellites over a larger area of sky continued with the VST ATLAS (Shanks et al., 2015) and Pan-STARRS (K. Chambers et al., in preparation) surveys, both of which have delivered a couple of discoveries to date (Belokurov et al., 2014; Laevens et al., 2014, 2015). Most recently, systematic searches based on the first data release (Y1A1) of the Dark Energy Survey (DES; The Dark Energy Survey Collaboration, 2005), have continued the success of its predecessor the SDSS, unveiling nine new objects over square degrees in the southern sky (Koposov et al., 2015a; Bechtol et al., 2015)111We note that the satellite reported as Indus I by Koposov et al. (2015a) and as DES J2108.8-5109 by Bechtol et al. (2015) is identical to Kim 2 that was discovered earlier by Kim et al. (2015a)., some of which have been already confirmed as UFDs by spectroscopic investigations (Simon et al., 2015; Walker et al., 2015; Koposov et al., 2015b). Other independent surveys, such as the Stromlo Missing Satellite Survey (Jerjen, 2010) and the Survey of the Magellanic Stellar History (SMASH; D. Nidever et al., in preparation), also took advantage of the power of the Dark Energy Camera (DECam) to boost the census of MW companions in the southern sky (Kim et al., 2015a; Martin et al., 2015).
The use of different detection algorithms also contributed significantly to the increase in the number of known MW satellites (Koposov et al., 2008; Walsh et al., 2009). Due to their extremely low surface brightness (Martin et al., 2008), UFDs would be difficult to characterised without the help of such specialised data mining techniques. Further improvements to the detection sensitivity even led to new discoveries of stellar systems hiding in the pre-existing SDSS data (e.g. Kim & Jerjen, 2015; Kim et al., 2015b).
Here we announce the discovery of a new ultra-faint MW satellite galaxy candidate found in the DES Y1A1 data. We note that this object Horologium II (Hor II) does not correspond to any object in the previous studies by Koposov et al. (2015a) and Bechtol et al. (2015) or in catalogs including the NASA/IPAC Extragalactic Database and SIMBAD.
2. Data Reduction and Discovery
DES is a deep photometric survey using the wide-field ( square degree) Dark Energy Camera (DECam) imager that consists of 62 2k 4k CCD chips installed at the 4-m Blanco Telescope located at Cerro Tololo Inter-American Observatory (CTIO). DES started operation in August 2013 and will cover square degrees of the Southern Sky in the vicinity of the Magellanic Clouds in five photometric bands () over five years. The data used in this paper is its first year public data set, DESDM Y1A1, collected between August 2013 and February 2014 over approximately 1800 square degrees and released to the public by the NOAO Science archive after a one year proprietary period. This data set includes individual images and corresponding weight-maps processed by the DES data management (DESDM) pipeline. Each image is a 90s single exposure. The instCal images we used for our analysis are bias, dark and flat-field corrected and contain the world coordinate system provided by the DESDM image processing pipeline (see Desai et al., 2012; Mohr et al., 2012, for more details).
We downloaded all the Y1A1 instCal images and corresponding weight-maps for the and bands from the NOAO Science archive using its SQL interface. Crossmatching the central coordinates of the images within radius yielded 1980 image pairs between the two photometric bands. To produce photometric catalogs, we performed PSF photometry over the images using SExtractor/PSFEx (Bertin & Arnouts, 1996; Bertin, 2011) on a local 16 nodes/128 core computer cluster. We carried out star/galaxy separation based on the threshold as described in Koposov et al. (2015a). The catalogs, which contained the instrumental magnitudes of the star-like objects, were crossmatched between and bands by employing STILTS (Taylor, 2005) with a tolerance. We then calibrated the instrumental magnitudes of the star-like point sources with respect to the APASS DR 8 stars by means of 500 bootstrap samples with 3-sigma clipping. On average, we found crossmatches between the instrumental and APASS catalogs on each frame, which yielded photometric zero points with uncertainties magnitudes in both and bands. The calibrated magnitudes were finally corrected for Galactic extinction using the reddening map by Schlegel et al. (1998) and the correction coefficients from Schlafly & Finkbeiner (2011).
We then applied our overdensity detection algorithm to the star catalogs to search for MW satellites. Briefly, this algorithm, following the approach by Walsh et al. (2009), involves a photometric filtering process in which an isochrone mask is applied to select a single age/metallicity stellar population at a fixed distance modulus. The density map generated from the selected stars is then convolved with a Gaussian kernel. The significance of local stellar overdensities is measured by comparing their signal-to-noise ratios to the smoothed density map. These steps are repeated shifting the isochrone mask over a range of distance moduli. The detection process is described in more details in Kim & Jerjen (2015). As part of this photometric analysis of the entire 1800 sqr deg of images of the Y1A1 data set, we successfully recovered all the UFD candidates reported by Koposov et al. (2015a) and Bechtol et al. (2015); e.g. Phoenix II (), Pictoris I (), Tucana II (), Eridanus III (), and Grus I (). We also found one additional MW satellite candidate in the constellation of Horologium. This new object, Horologium II, was initially detected at the 7-8 significance levels in two separate, but overlapping DECam images. To fill the CCD chip gaps, we combined the photometric catalogs of the two frames and removed duplicates with tolerance. Hor II was then recovered with a significance of .
| Parameter | Value | Unit |
|---|---|---|
| 3 16 32.15.0 | h m s | |
| 50 01 055 | ∘ | |
| 262.472 | deg | |
| 54.137 | deg | |
| mag | ||
| kpc | ||
| ′ | ||
| aa Adopting a distance of 78 kpc | pc | |
| deg | ||
| mag |
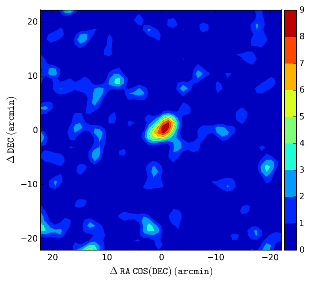
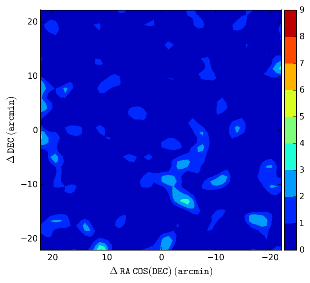
The upper panel of Figure 1 presents the density contour map of Hor II, made from stars passing the isochrone filter. Hor II appears elongated but well defined by high level density contours (). The lower panel shows the corresponding contour map of non-stellar objects in the same field of view.
3. Candidate Properties
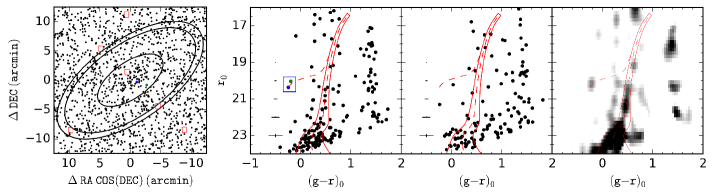
The left panel of Figure 2 shows the distribution of all stellar objects in our photometric catalogs within a window centred on Hor II. The small red rectangles indicate the six locations of residual CCD chip gaps where the two DES images provided no data. In the middle panel, we present the color-magnitude diagram (CMD) for the stars in the inner circle shown in the left panel, equal to the dashed circle in the upper panel of Figure 1. Overplotted is the PARSEC isochrone (Bressan et al., 2012) of 13.5 Gyr and [Fe/H]=-2.1 shifted to the distance modulus of or a heliocentric distance of kpc. Compared to the control CMD established in the same manner as in Belokurov et al. (2006) shown in the right panel, the stars in the vicinity of Hor II consistently trace the old and metal-poor stellar population from the red-giant branch (RGB) down to the main-sequence turn off. Hor II also hosts two potential blue horizontal branch (BHB) stars.
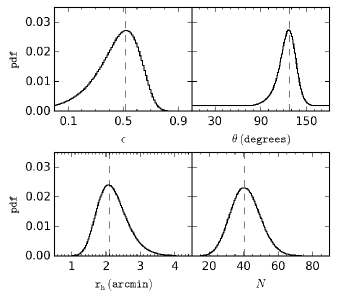
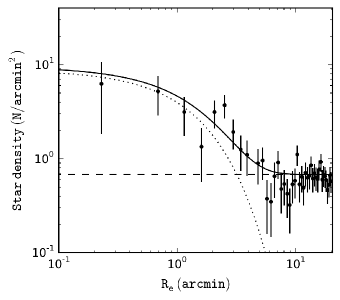
We derived the structural parameters of Hor II using a Maximum Likelihood (ML) algorithm similar to the one described in Martin et al. (2008). The resulting marginalized pdfs for the structural parameters are presented in the left panels of Figure 3. The right panel shows the radial density profile with the best-fit exponential profile based on the best parameters; an ellipticity of , a position angle of and a half-light radius of . Adopting the heliocentric distance of 78 kpc, the ML-estimated physical size of Hor II is pc.
The total luminosity of Hor II is estimated as follows. Briefly, we use the total number of member stars above the photometric threshold ( mag) and its associated uncertainty derived from the ML algorithm run. We then integrate a normalised theoretical luminosity function as a probability density function of magnitude, by the same magnitude limit and use the ratio of the number to the probability density to scale the luminosity function up to the observed level. Integrating the scaled luminosity function inclusive of missing flux below the threshold gives the absolute luminosity of Hor II. Using the PARSEC isochrone of 13.5 Gyr and [Fe/H]=-2.1 based on the initial mass function by Kroupa (2001), we obtain or by the luminosity weighted mean color of the isochrone. We adopt a total luminosity of as our final estimate where its uncertainty is derived from the star counts . All the resulting parameters are summarised in Table 1. We note that a heliocentric distance of 78 kpc was adopted in the calculations of the physical size and total luminosity, to which the distance uncertainty was not propagated.
4. Discussion and Conclusion
We analysed the first instalment (Y1A1) of the Dark Energy Survey imaging data to search for MW satellites, where we recovered all the previously reported systems and also found a new satellite candidate in the constellation of Horologium. The new MW satellite candidate Hor II appears faint (), elongated () and rather extended ( pc). On the size luminosity plane, Hor II is placed in the realm of UFDs close to Boötes II. It also features a typically old (Gyr) and metal-poor ([Fe/H]) stellar population. The best isochrone fit yields a heliocentric distance of kpc, which is the same as that of a recently discovered neighbour in the DES Y1A1 coverage, Hor I. Compared to the new satellite candidate, Hor I is about twice as luminous (), smaller ( pc) and more circular (), consequently being placed in the somewhat ambiguous region on the size-luminosity plane where UFDs and extended globular clusters overlap (Koposov et al., 2015a). A recent spectroscopic study by Koposov et al. (2015b) has revealed that the dynamical mass-to-light ratio of Hor I reaches and confirmed that that system is indeed an UFD, possibly (once) associated with the LMC. The pair of UFDs, Hor I and II, are only degrees away from each other on the sky, have identical distances and are well aligned with the Vast Polar Structure (Pawlowski et al., 2015). Such UFD pairs have been reported for quite some time e.g. Boötes I - II (Walsh et al., 2007), Leo IV - V (Belokurov et al., 2008) and Pisces II - Pegasus III (Kim et al., 2015b). The tentative link between Hor I and II can be extended further to the Sculptor dwarf spheroidal ( kpc, Weisz et al., 2014) and the UFD Eridanus III ( kpc). As Sculptor is moving on a retrograde orbit within the Vast Polar Structure when compared to the other classical MW satellite galaxies in the vicinity, including the Magellanic coulds, the hypothesis of a common origin can be tested once proper motion measurements become available. Nevertheless, this alignment is already suggestive of a “layer” of outer halo UFDs parallel to the Magellanic Clouds, possibly associated to the most luminous Sculptor dwarf. Indeed, there is one more object nearby, namely Phe II, that also shares the same distance.
References
- Astropy Collaboration et al. (2013) Astropy Collaboration, Robitaille, T. P., Tollerud, E. J., et al. 2013, A&A, 558, A33
- Bechtol et al. (2015) Bechtol, K., Drlica-Wagner, A., et al. 2015, arXiv:1503.02584
- Belokurov et al. (2006) Belokurov, V., Zucker, D. B., Evans, N. W., et al. 2006, ApJ, 647, L111
- Belokurov et al. (2008) Belokurov, V., Walker, M. G., Evans, N. W., et al. 2008, ApJ, 686, L83
- Belokurov et al. (2014) Belokurov, V., Irwin, M. J., Koposov, S. E., et al. 2014, MNRAS, 441, 2124
- Bertin & Arnouts (1996) Bertin, E., & Arnouts, S. 1996, A&AS, 117, 393
- Bertin (2011) Bertin, E. 2011, Astronomical Data Analysis Software and Systems XX, 442, 435
- Bressan et al. (2012) Bressan, A., Marigo, P., Girardi, L., et al. 2012, MNRAS, 427, 127
- Brown et al. (2014) Brown, T. M., Tumlinson, J., Geha, M., et al. 2014, ApJ, 796, 91
- Desai et al. (2012) Desai, S., Armstrong, R., Mohr, J. J., et al. 2012, ApJ, 757, 83
- Frebel et al. (2010) Frebel, A., Simon, J. D., Geha, M., & Willman, B. 2010, ApJ, 708, 560
- Grillmair (2009) Grillmair, C. J. 2009, ApJ, 693, 1118
- Hunter (2007) Hunter, J. D. 2007, Computing in Science and Engineering, 9, 90
- Irwin et al. (2007) Irwin, M. J., Belokurov, V., Evans, N. W., et al. 2007, ApJ, 656, L13
- Jerjen (2010) Jerjen, H. 2010, Advances in Astronomy, 2010, 434390
- Kim & Jerjen (2015) Kim, D., & Jerjen, H. 2015, ApJ, 799, 73
- Kim et al. (2015a) Kim, D., Jerjen, H., Milone, A. P., Mackey, D., & Da Costa, G. S. 2015, ApJ, 803, 63
- Kim et al. (2015b) Kim, D., Jerjen, H., Mackey, D., Da Costa, G. S., & Milone, A. P. 2015, arXiv:1503.08268
- Kirby et al. (2008) Kirby, E. N., Simon, J. D., Geha, M., Guhathakurta, P., & Frebel, A. 2008, ApJ, 685, L43
- Kroupa (2001) Kroupa, P. 2001, MNRAS, 322, 231
- Koposov et al. (2008) Koposov, S., Belokurov, V., Evans, N. W., et al. 2008, ApJ, 686, 279
- Koposov et al. (2015a) Koposov, S. E., Belokurov, V., Torrealba, G., & Wyn Evans, N. 2015, arXiv:1503.02079
- Koposov et al. (2015b) Koposov, S. E., Casey, A. R., Belokurov, V., et al. 2015, arXiv:1504.07916
- Laevens et al. (2014) Laevens, B. P. M., Martin, N. F., Sesar, B., et al. 2014, ApJ, 786, L3
- Laevens et al. (2015) Laevens, B. P. M., Martin, N. F., Ibata, R. A., et al. 2015, arXiv:1503.05554
- Martin et al. (2007) Martin, N. F., Ibata, R. A., Chapman, S. C., Irwin, M., & Lewis, G. F. 2007, MNRAS, 380, 281
- Martin et al. (2008) Martin, N. F., de Jong, J. T. A., & Rix, H.-W. 2008, ApJ, 684, 1075
- Martin et al. (2015) Martin, N. F., Nidever, D. L., Besla, G., et al. 2015, ApJ, 804, L5
- Mohr et al. (2012) Mohr, J. J., Armstrong, R., Bertin, E., et al. 2012, Proc. SPIE, 8451, 84510D
- Muñoz et al. (2010) Muñoz, R. R., Geha, M., & Willman, B. 2010, AJ, 140, 138
- Norris et al. (2010) Norris, J. E., Yong, D., Gilmore, G., & Wyse, R. F. G. 2010, ApJ, 711, 350
- Pawlowski et al. (2015) Pawlowski, M. S., McGaugh, S. S., & Jerjen, H. 2015, arXiv:1505.07465
- Sand et al. (2012) Sand, D. J., Strader, J., Willman, B., et al. 2012, ApJ, 756, 79
- Shanks et al. (2015) Shanks, T., Metcalfe, N., Chehade, B., et al. 2015, arXiv:1502.05432
- Schlafly & Finkbeiner (2011) Schlafly, E. F., & Finkbeiner, D. P. 2011, ApJ, 737, 103
- Schlegel et al. (1998) Schlegel, D. J., Finkbeiner, D. P., & Davis, M. 1998, ApJ, 500, 525
- Simon & Geha (2007) Simon, J. D., & Geha, M. 2007, ApJ, 670, 313
- Simon et al. (2011) Simon, J. D., Geha, M., Minor, Q. E., et al. 2011, ApJ, 733, 46
- Simon et al. (2015) Simon, J. D., Drlica-Wagner, A., Li, T. S., et al. 2015, arXiv:1504.02889
- Taylor (2005) Taylor, M. B. 2005, Astronomical Data Analysis Software and Systems XIV, 347, 29
- The Dark Energy Survey Collaboration (2005) The Dark Energy Survey Collaboration 2005, arXiv:astro-ph/0510346
- Walker et al. (2015) Walker, M. G., Mateo, M., Olszewski, E. W., et al. 2015, arXiv:1504.03060
- Walsh et al. (2007) Walsh, S. M., Jerjen, H., & Willman, B. 2007, ApJ, 662, L83
- Walsh et al. (2009) Walsh, S. M., Willman, B., & Jerjen, H. 2009, AJ, 137, 450
- Weisz et al. (2014) Weisz, D. R., Dolphin, A. E., Skillman, E. D., et al. 2014, ApJ, 789, 147
- Willman et al. (2005) Willman, B., Blanton, M. R., West, A. A., et al. 2005, AJ, 129, 2692
- Willman & Strader (2012) Willman, B., & Strader, J. 2012, AJ, 144, 76
- York et al. (2000) York, D. G., Adelman, J., Anderson, J. E., Jr., et al. 2000, AJ, 120, 1579
- Zucker et al. (2006) Zucker, D. B., Belokurov, V., Evans, N. W., et al. 2006, ApJ, 643, L103