Momose et al.Disk around HD169142 in H-band
stars: individual (HD 169142) — stars: pre-main-sequence — planetary systems: protoplanetary disks — planetary systems: planet-disk interactions — infrared: planetary systems — infrared: stars
Detailed structure of the outer disk around HD 169142 with polarized light in -band
Abstract
Coronagraphic imagery of the circumstellar disk around HD 169142 in -band polarized intensity (PI) with Subaru/HiCIAO is presented. The emission scattered by dust particles at the disk surface in , or AU, is successfully detected. The azimuthally-averaged radial profile of the PI shows a double power-law distribution, in which the PIs in AU and AU respectively show -dependence. These two power-law regions are connected smoothly with a transition zone (TZ), exhibiting an apparent gap in AU. The PI in the inner power-law region shows a deep minimum whose location seems to coincide with the point source at mm. This can be regarded as another sign of a protoplanet in TZ. The observed radial profile of the PI is reproduced by a minimally flaring disk with an irregular surface density distribution or with an irregular temperature distribution or with the combination of both. The depletion factor of surface density in the inner power-law region ( AU) is derived to be from a simple model calculation. The obtained PI image also shows small scale asymmetries in the outer power-law region. Possible origins for these asymmetries include corrugation of the scattering surface in the outer region, and shadowing effect by a puffed up structure in the inner power-law region.
1 Introduction
Circumstellar disks around young stars are the key targets to obtain a better understanding of the formation of planetary systems (Dullemond & Monnier, 2010; Williams & Cieza, 2011). During ongoing formation of a planet, the disk is expected to manifest observable signatures inside, such as an inner hole, a gap, spirals and other asymmetric patterns. Recent progress in the technique of differential imaging at near infrared wavelengths finally allows us to detect small-scale complex features in the disks (e.g., Hashimoto et al. (2011, 2012); Muto et al. (2012); Mayama et al. (2012); Grady et al. (2013); Follette et al. (2013)). Most of these objects are classified as transitional disks, which show significant amount of excess emission at wavelengths m but little excess at shorter wavelengths, suggesting that dust in the inner regions has already been depleted (Strom et al., 1989; Skrutskie et al., 1990). Imaging surveys of transitional disks in dust thermal emission at submillimeter wavelengths clearly show that these disks do commonly possess inner holes (Brown et al., 2009; Andrews et al., 2011). Recently, even more complex distributions of dust emission on a smaller size scale are also revealed in some of these objects (e.g., Casassus et al. (2013); van der Marel et al. (2013); Fukagawa et al. (2013); Pèrez et al. (2014)). These asymmetric features may be caused by trapping of dust particles in a vortex with a higher pressure, which can lead to efficient formation of rocky planetesimals (Regály et al., 2012; Birnstiel, Dullemond & Pinilla, 2013).
HD 169142 is a Herbig Ae star located at 145 pc from the Sun (Sylvester et al., 1996), and the spectral type of the star is classified as A5Ve (Dunkin, Barlow & Ryan 1997) or A8Ve (Grady et al., 2007). The age is estimated to be Myr from the ages of two pre-main sequence stars located to the southwest and are comoving with HD 169142 (Grady et al., 2007). The luminosity of is used by Meeus et al. (2012), while Manoj et al. (2006) derive with (see also Osorio et al. (2014)). Judging from the observed color 0.26, however, was the case only if the stellar spectral type was as early as B8. Wagner et al. (2015), in fact, find a good fit to the SED, including the UV data, for the spectral type of A7, the effective temperature of 7500K and the stellar radius of (resulting in ) with no foreground extinction. It exhibits significant amount of excess emission at longer wavelengths and its spectral energy distribution (SED) is categorized as group I (Meeus et al., 2001). Interferometric observations of CO lines at millimeter wavelengths revealed a gas disk with the radius of , and their velocity fields are consistent with Keplerian rotation of the central stellar mass and its inclination angle (Raman et al., 2006; Panić et al., 2008). Scattered light at near infrared wavelengths from the disk outer regions was also imaged with coronagraph instruments (Grady et al., 2007; Fukagawa et al., 2010).
More recently, the inner regions of the disk have been investigated by both the analysis on its broadband SED and higher resolution imagery. It was claimed that there should be an inner cavity around HD 169142 to reproduce its SED, but its size was rather unclear solely from the SED analysis (Grady et al., 2007; Meeus et al., 2010). Honda et al. (2012) carried out imaging of the disk at and 24.5 m with Subaru/COMICS, and by combining these data with a two-dimensional radiative transfer model for the SED, they determined the location of the inner wall of the disk to be AU from the star. They also speculate that the SED classification as group I may correspond to the object accompanied by a (pre)transitional disk in which there is a large inner hole and the inner wall of the disk just outside the hole can account for its characteristic large amount of excess emission at mid-infrared wavelengths (see also Maaskant et al. (2013)). Quanz et al. (2013) made observations of polarization intensity (PI) in -band (m) with VLT/NACO . They found a bright ring of AU that agreed with the estimate from the SED analyses (Meeus et al., 2010; Honda et al., 2012), as well as an annular gap extending AU. Furthermore, imaging of dust thermal radiation at mm with J-VLA also shows asymmetric ring-like emission at AU and a hint of an outer gap at AU, suggesting that the structure seen in the scattered light at near infrared wavelengths may correspond to real variations in surface density (Osorio et al., 2014). Although these are not the decisive evidence for the existence of protoplanet(s), such a gap is reminiscent of that induced by a planet in the disk (e.g., Lin & Papaloizou (1993); Crida, Morbidelli & Masset 2006). The latest observations in -band (m) with an annular groove phase mask (AGPM) vector-vortex coronagraph mounted on VLT detect a companion candidate inside the inner cavity (, or 23 AU from the star), which might be the direct detection of radiation from a protoplanet (Biller et al., 2014; Reggiani et al., 2014).
This paper presents coronagraphic imagery of the circumstellar disk around HD 169142 in -band polarized intensity (PI) with Subaru/HiCIAO. We describe the details of the observations in §2 and present the results in §3. Based on our results as well as those obtained by previous studies, we discuss in §4 the disk structure and estimate the nature of a possible protoplanet embedded in the disk from our results.
2 Observations and Data Reduction
2.1 Observations with Subaru/HiCIAO
HD 169142 was observed in -band (m) with the high-contrast imaging instrument HiCIAO (Tamura et al., 2006; Hodapp et al., 2008; Suzuki et al., 2010) on the Subaru Telescope on 2011 May 23 UT as part of Strategic Explorations of Exoplanets and Disks with Subaru (SEEDS; Tamura (2009)). The data were taken in a combined angular differential imaging (ADI) and polarization differential imaging (PDI) mode with a field of view of and a pixel scale of 9.5 milli-arcsecond (mas). A circular occulting mask in radius was used to suppress the bright stellar halo. The half-wave plates were periodically placed at four angular positions from and in sequence with 30s exposure per wave plate position. The total integration time of the PI image was 1080s after removing low quality frames with large FWHMs by careful inspection of the stellar point-spread function (PSF). Data of the reference star HD 166903, whose apparent magnitude in -band is 5.837 mag (SIMBAD), were also taken in the same observing mode. It was proved that a stable stellar PSF of FWHM = was achieved for the selected images of HD 169142 by the adaptive optics system AO188 (Hayano et al., 2004; Minowa et al., 2010).
2.2 Data reduction
The data reduction procedure was the same as that described by Muto et al. (2012). The raw images were first corrected with IRAF111IRAF is distributed by the National Optical Astronomy Observatory, which is operated by the Association of Universities for Research in Astronomy, Inc., under cooperative agreement with the National Science Foundation. for bias and dark current, and flat-fielding was performed after sky subtraction. We applied a distortion correction using globular cluster M5 data taken within a few days, by IRAF packages GEOMAP and GEOTRAN. The images of Stokes () parameters were obtained in the standard way (e.g., Hinkley et al. (2009)); By subtracting two images of extraordinary and ordinary rays at each wave plate position, we got , and images, from which and images were made by another subtraction to eliminate remaining aberration. Instrumental polarization of HiCIAO was corrected by the way described by Joos et al. (2008).
We needed to fix the rotation center of the field of view by ADI in de-rotating the and images. It was determined in the following way. A pair of -frames that were taken more than 300s apart from each other was picked up, and then the rotation center and rotation angle for the pair were derived so that the two background stars in the differential image between the two frames were best cancelled out. These values were collected for all the possible -frame pairs, and their average position was regarded as the image rotation center in our observations. There were four background stars in each frame, but two of them were not used because their positions were so far from the image center that the distortion correction might be imperfect. It proved that the mask center position was shifted from the image rotation center by () pixels in (), or ( mas, mas). On the other hand, the stellar position was estimated from elliptical fitting to an iso-intensity contour of the periphery of stellar halo in -frames. The stellar location measured in this way was proved to be the same as the image rotation center. The and images were de-rotated at this center, then averaged to increase the signal-to-noise. PI was then obtained by PI = . The misalignment between the mask center and image rotation center made the resultant working angle from the star, which is slightly larger than the actual mask size.
3 Results
Figure 1 shows the PI image of HD 169142 in -band with Subaru/HiCIAO. The infrared emission scattered by dust particles at the disk surface is successfully detected. The typical PI value is mJy arcsec-2 in , well beyond the disk outer radius derived from the CO observations (Raman et al., 2006; Panić et al., 2008) and the scattered light of the disk should be negligible. This corresponds to the level of 0.168 mJy arcsec-2 if the values in the region of no polarized emission follow the Rayleigh distribution. In the following quantitative analyses, we will regard the PI emission of mJy arcsec-2 ( level) as a significant detection. The region of significant detection extends up to from the star, as presented in figure 1c. Figure 1d shows the polarization vectors derived from Stokes and images. The polarization vectors align azimuthally, as expected for the stellar light scattered at the disk surface.
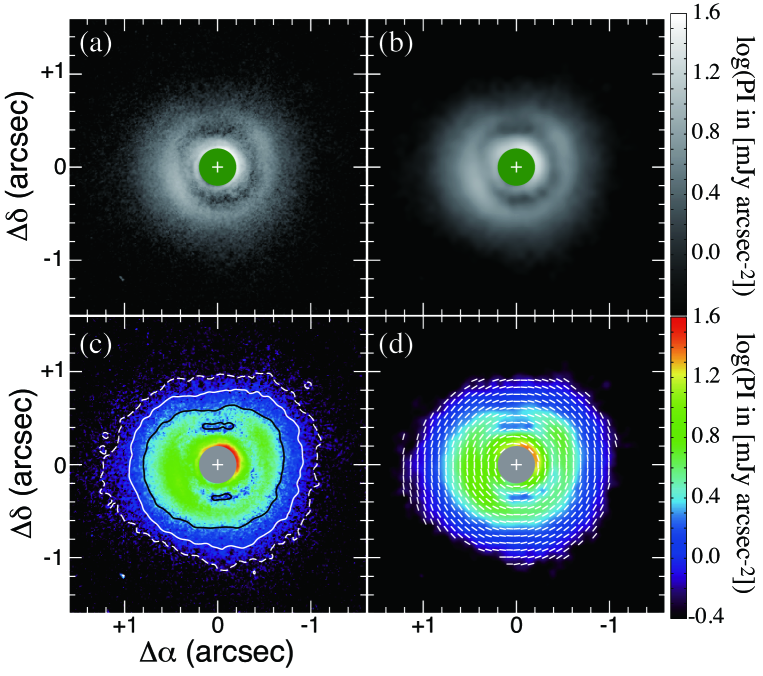
The overall structure of the PI is roughly consistent with that obtained by Quanz et al. (2013) with VLT/NACO . The obtained PI in figure 1a shows an axisymmetric distribution as follows: (i) the bright ring just outside the mask, (ii) a ring-like feature at , or 80 AU from the star, (iii) the apparent gap between these two ring-like features, and (iv) the outermost part in which the PI gets gradually weaker at a larger radius. Note that the PI is significantly detected in the gap (iii) with at least . These axisymmetric features can be seen even more clearly in the smoothed image convolved with a Gaussian function (figure 1b). The inner bright rim at (Quanz et al., 2013) is only marginally confirmed because the inner working angle of our observation is slightly larger than that of VLT/NACO.
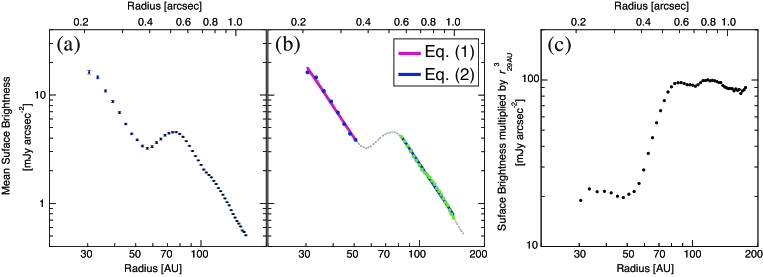
To describe the axisymmetric distribution of the PI more quantitatively, its azimuthally-averaged radial profile is presented in figure 2; the projection on the sky is corrected under the assumptions that the disk inclination angle is and the disk major axis is in PA (Raman et al., 2006). The radial profile shows a double power-law distribution, as expressed by
| (1) |
in and
| (2) |
in , respectively. The formal statistical uncertainties in the amplitudes are estimated to be % for (1) and % for (2), and those in the exponents are dex. These two power-law regions are connected smoothly with a “transition zone” (hereafter denoted by TZ) extending AU. The apparent gap located in AU (Quanz et al., 2013; Osorio et al., 2014) consists of the outer part of the inner power-law region and TZ, while the bright ring at in the PI image (figures 1a and 1b) corresponds to the inner boundary of the outer power-law region. It should be noted, however, that the surface brightness normalized by the power-law (figure 2c) changes smoothly even in TZ. There is no break of the exponent at AU claimed by Quanz et al. (2013), though a subtle irregularity may be identified at AU. The -dependence was also found in the total intensity distribution at 1.1 m in AU with the coronagraphic imaging by HST/NICMOS (Grady et al., 2007). It is also consistent with the radial exponent in AU derived from the imagery in -band with Subaru/CIAO (; Fukagawa et al. (2010)), suggesting that there is no significant radial variation of polarization degree in these regions. The polarization degree estimated from the comparisons between the PI in figure 1 and the total intensity by Fukagawa et al. (2010) is % in . This is higher than that obtained in the -band PI imaging of the disk around HD 142527 (Avenhaus et al., 2014). It may be due to the nearly pole-on configuration of HD 169142; the scattering angle at the disk surface should be at which the polarization degree is % when the particle size is much smaller than the wavelength (Bohren & Huffman, 1983). Alternatively, it might be due to an underestimate of total scattered-light intensity caused by a systematic error during PSF subtraction by Fukagawa et al. (2010). The rest of the discussion in this paper will not be affected by any uncertainties in polarization degree.
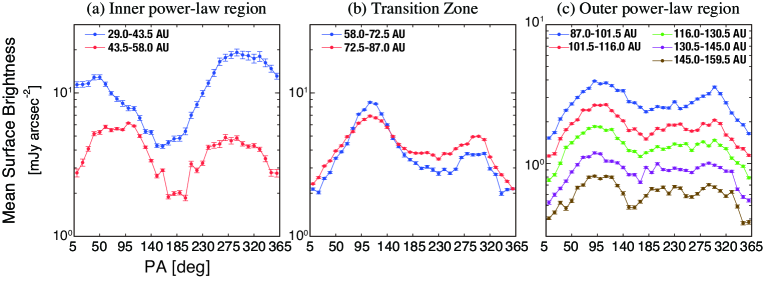
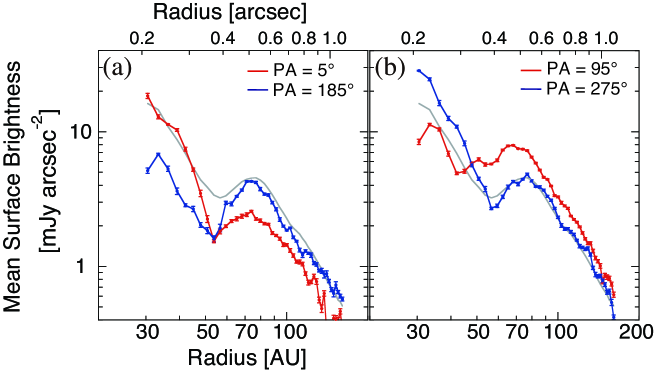
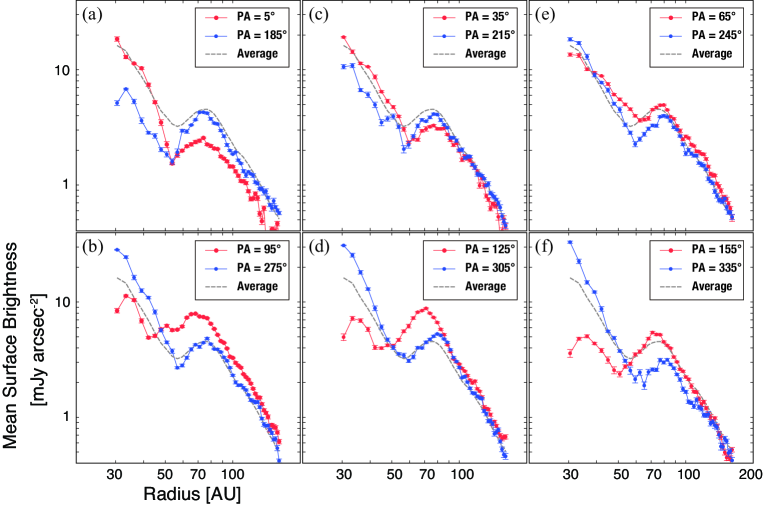
The PI image also manifests asymmetric features, which are easily identified in figure 1c. To see the asymmetry at each radius, azimuthal distributions of the PI in annuli of 14.5 AU width are presented in figure 3. In the innermost annulus (29.0 43.5 AU), the northwestern part () is quite bright. This may be a part of the inner rim distorted outwardly (Quanz et al., 2013). Except for this innermost annulus, all the azimuthal distributions have their maxima at PA, close to the disk minor axis east to the star. This may imply that the eastern part is the near side of the disk and is brighter than the western side because of the forward scattering. In the outer power-law region, the PI near the major axis ( and ) is dimmer than those near the minor axis ( and ), which is also found in figure 4. As a consequence, the lowest contour of the significant detection in figure 1c is slightly elongated in east-west direction. This situation is completely different from other disks in scattered light detected with Subaru/HiCIAO, in which the PI is brighter along the major axis (e.g., Muto et al. (2012); Kusakabe et al. (2012)). The variation in each annulus is systematically larger at inner radii; In the inner power-law region and TZ, the amount of variation in each annulus is , but those of annuli in the outer power-law region is less than .
To clearly identify these asymmetric features in the image, figure 5 shows the map of “modulated PI”, the PI normalized by , where is a dimensionless radius normalized by 29 AU. Two distinct power-law regions, divided by TZ where the contours are crowded, can be recognized. As indicated by the normalized intensities in equations (1) and (2), the average of modulated PI in the inner and outer power-law regions should be mJy arcsec-2 and mJy arcsec-2 (see also figure 2c). However, the variation of modulated PI in the inner power-law region is quite remarkable, ranging from 10 to 40 mJy arcsec-2. This is significant compared to the uncertainties estimated from the original PI map (3 = 0.5 mJy arcsec-2 in the original PI corresponds to mJy arcsec-2 in modulated PI at ). These asymmetries in the inner power-law region could be related to the perturbation by a protoplanet inside the inner ring (Biller et al., 2014; Reggiani et al., 2014). Another intriguing feature is that the location of deep minimum in the southern part of the inner power-law region seems to coincide with the point source at mm revealed with J-VLA, as indicated in figure 5b′. Osorio et al. (2014) speculate that it might originate from the circumplanetary disk associated with a protoplanet inside the gap, which is also identified in thermal emission at mm. The relation between these features and the possible protoplanet in TZ will be discussed further in §4.2.
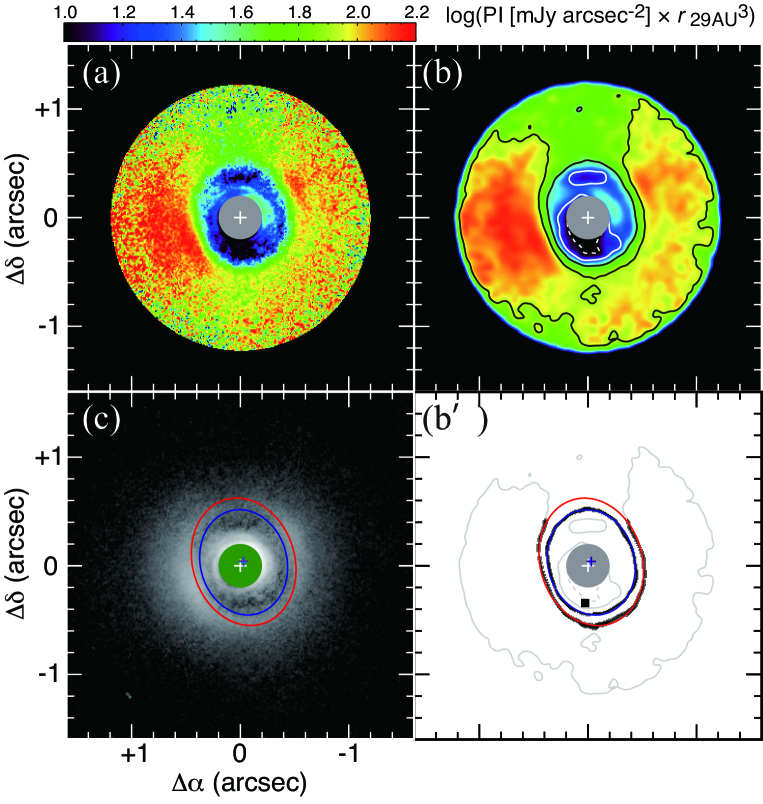
To quantitatively describe the shape of TZ, elliptical fitting is made to the contours of 40 and 80 mJy arcsec-2 in modulated PI; the results are presented in table 1. These ellipses well delineate the edges of TZ in the original PI map, as shown in figure 5c. The major axes of the ellipses nearly agree with the disk major axis (PA), and the ratio of minor to major axes is , which is smaller than the case when an infinitesimally thin disk is observed from the inclination angle of . These are consequences of the asymmetry that the PI near the minor axis of the disk is brighter than near the major axis (see also figures 1 and 3). The centers of the ellipses agree with each other but are shifted northwest from the stellar position, caused by the east-west asymmetry along the minor axis in the outer power-law region.
| contour | major | minor | aaaOffset from the stellar position | aaaOffset from the stellar position | PA |
|---|---|---|---|---|---|
| (mJy arcsec-2) | axis () | axis () | () | () | (∘) |
| 40 | 0.490 | 0.399 | 0.030 | 14.2 | |
| 80bbbOnly in . | 0.596 | 0.471 | 0.031 | 16.8 |
4 Discussion
In the following subsections, we discuss observed features of the disk from larger to smaller size scales in order; a double power-law distribution seen in the radial profile of PI is discussed in §4.1, possible presence of a protoplanet in the transition zone (TZ) is examined in §4.2, and asymmetries on smaller azimuthal scales are mentioned in §4.3. It is impossible to derive the realistic internal structure of the disk solely from the PI image in -band. Existence of gap between AU in radius has been inferred by recent J-VLA observations (Osorio et al., 2014), which provided us another important information about the disk internal structure. The emission at mm, however, is mainly arising from dust grain with a larger size, and we cannot make any combined analysis of these two images unless we put further assumptions on dust size distribution as well as on size-dependence of dust spatial distribution. We therefore decide in this paper to interpret -band image with a simple disk model whose surface density and temperature distributions ( and ) have a power-law and the vertical density distribution is determined by hydrostatic equilibrium (Appendix A). Although our disk model is simple, it is useful for analyzing the location of scattering surface, the key to interpret the PI image in -band. As explained in the Appendix A, essentially parameterizes the volume emissivity of disk material while parameterizes the vertical distribution of disk material. Further analysis on disk structure based on a more realistic model should be made after sensitive observations of dust emission at millimeter/sub-millimeter wavelengths are made with ALMA in angular resolution similar to this study.
4.1 Disk structure that reproduces a double power-law distribution of PI’s radial profile
An azimuthally-averaged radial profile of the PI in -band shows a double power-law distribution, and the exponents in the both power-law regions are (figure 2). The same exponent was also obtained in total intensity at m and m (Grady et al., 2007; Fukagawa et al., 2010). A geometrically thin but optically thick disk model (e.g., Whitney & Hartmann (1992)) has been frequently referred to as an analytical explanation for an -distribution (e.g., Wisniewski et al. (2008)), but this is not the only explanation for such radial dependence. Grady et al. (2007) showed that a model disk with a pressure scale height of can reproduce the -distribution of surface brightness at m by using 3D Monte Carlo radiative transfer code (Whitney et al., 2003a, b, 2004). It was also reported that such a minimally flaring disk (i.e., the aspect ratio is independent of )222Such a case has been referred to as a “flat disk” in some studies (e.g., Chiang & Goldreich (1997)). with surface density can explain not only the radial distribution of scattered light but also the visibility amplitudes at mm (Panić et al., 2008) and the SED at longer wavelengths (Meeus et al., 2010; Honda et al., 2012).
In fact, -dependence of the disk emission may be a natural consequence by the combination of and . The scattering surface of a disk corresponds to the positions where the optical depth measured radially from the star is , while the energy flux of incident stellar radiation can be scaled by , where is the grazing angle at the scattering surface. It can be derived analytically that is nearly proportional to for an axisymmetric disk when and , accounting for the -brightness distribution (Appendix B). This means that the double power-law distribution (figures 2 and 5) is realized if is proportional to in each power-law region but its value in the inner region is significantly smaller than that in the outer region. It can happen when the height of the scattering surface normalized by the radius in the inner region is smaller than that in the outer region.
A simple example for such a case is that the surface density distribution of dust particles responsible for the scattering in near infrared, , is not a smooth power-law but has an irregularity. To roughly estimate the amount of irregularity in , we compare the observed PI distribution with a simple model calculation whose details are described in Appendix A. As discussed later, Wagner et al. (2015) also carry out more elaborate modeling, but our simple model is helpful for analyzing the location of scattering surface. of the model disk is expressed by
| (3) |
where
| (4) |
Here, is a depletion factor for the surface density in the inner power-law region, are the inner and outer boundaries of TZ and are set to be (50 AU, 85 AU) based on the fitting results expressed by equations (1) and (2), and is the surface density at . The surface brightness distribution normalized by does not show any gap but smooth rise in TZ (figure 2c), and this cannot be reproduce by a model disk with a dust devoid zone. To smoothly connect in TZ as well as at its boundaries, in equation (4) is defined as a third order polynomial that simultaneously satisfies the following equations:
| (5) |
We also assume that to set the pressure scale height (Appendix A; see also Chiang & Goldreich (1997)), and the disk is isothermal and in hydrostatic equilibrium along the vertical axis. The multiple scattering effect is ignored in the radiative transfer calculation for simplicity. Figure 6a shows the results of the model calculations. The -dependence is reproduced in both AU and AU regions, but a larger proportionality constant for in the outer region makes the location of the scattering surface higher from the mid-plane, resulting in larger and brighter PI. Judging from figure 6a, seems to give the best fit to the observed contrast between the two power-law regions. given by equations (4) and (5) with is presented in figure 6b. There seems a gap in AU with the minimum at AU as suggested by previous studies (Quanz et al., 2013; Osorio et al., 2014), though the profile shape is qualitatively different from a planetary gap having a characteristic size scale of the width (e.g., Zhu et al. (2011)). Despite many simplifications, the estimate by our model is roughly consistent with the results obtained by Wagner et al. (2015); in the model disk with .
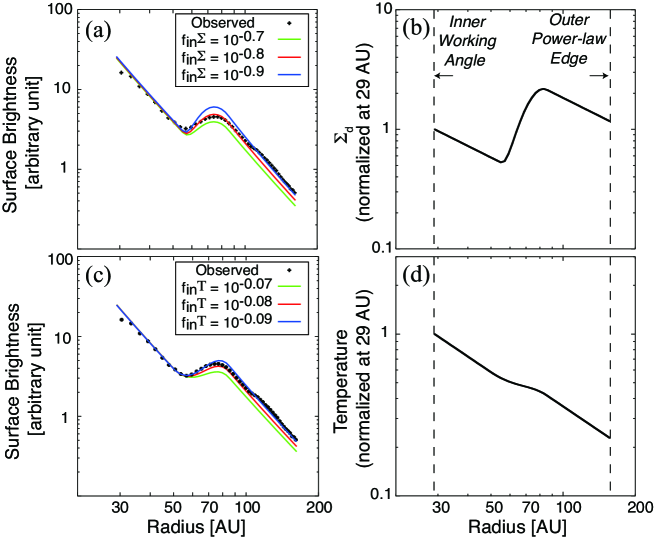
However, the above depletion factor for the inner power-law region should be regarded as the lower limit, i.e., should be . This is because irregularity in radial temperature distribution can also produce the observed double power-law distribution of PI, even without any irregularity in like equations (4) and (5); if the temperature proportionality constant is slightly higher in the outer power-law region, it makes the disk aspect ratio and in this region also larger. Our simple model similar to the above one but each in equations (3) - (5) is replaced by reproduces the observed PI profile when , corresponding to the change in by a factor of (see Appendix B for further details). This is again consistent with the model calculations by Wagner et al. (2015) who show that a scale height change of 0.86 in the inner power-law region can reproduce the observed PI image in -band333Another important conclusion obtained by Wagner et al. (2015) is that the apparent gap in PI at AU cannot be reproduced solely by changing the scale height of the inner wall at AU.. There is a degeneracy between and in models that reproduce the PI image, as pointed out by Wagner et al. (2015). The radial intensity profile at mm is reproduced by a disk model in which there is no significant discrepancy in dust surface density between AU and AU (Osorio et al., 2014), which might favor a larger . Further imaging studies, especially at millimeter and submillimeter wavelengths, will still be necessary to clearly disentangle this degeneracy.
4.2 Possible presence of a protoplanet in the transition zone (TZ)
The change of described in §4.1 may be caused by interaction between a protoplanet and the disk. Jang-Condell & Turner (2012), for example, examine the detail disk structure under the influence of a forming planet and simulate the images at various wavelengths. They obtain a radial distribution of near infrared scattered light qualitatively similar to our observed results. Such a double power-law distribution is produced because the protoplanet creates a gap in the disk initially having flared surface, resulting in larger on the scattering surface at outer radii. Furthermore, cooling within the trough and heating on the far wall alter the vertical density profile of the gap region in such a way that the difference of is enhanced even more. In their simulations, the brightness contrast between the inside and outside of the gap is much larger (a factor of in normalized intensity even in the lowest contrast case) than our observational results, suggesting that the mass of a protoplanet in TZ is so low that it only creates a shallower gap than the cases of Jang-Condell & Turner (2012); they deal with the cases of planet masses much higher than the critical mass for a gap opening proposed by Crida et al. (2006).
More recently, Osorio et al. (2014) obtain the image of dust thermal emission at mm with J-VLA. They detect ring-like emission delineating the bright rim at revealed by the -band PI image with VLT/NACO (Quanz et al., 2013). The azimuthally-averaged radial intensity profile at mm gives a hint that there is an annular gap in AU from the star that coincides with the gap seen in the -band PI images. Based on these results, Osorio et al. (2014) carry out disk modeling in which there is a dust devoid zone in AU, and they successfully reproduce the radial intensity profile at mm. Meanwhile, the scattered light in -band is detected even in the gap (figures 1 & 2), indicating that there is some amount of small dust particles in this zone. These two observational results are compatible if larger dust particles responsible for thermal emission at millimeter wavelengths are more deficient in the gap region. In fact, previous studies on the motion of dust particles in a gas disk under the influence of a planet show that particles with a modest size (i.e., millimeter and centimeter in size) tend to be removed more quickly compared to the smaller particles during the formation of a planetary gap near the orbit (Paardekooper & Mellema, 2006; Lyra et al., 2009; Muto & Inutsuka, 2009).
The J-VLA image at mm also reveals a faint point source, at PA= from the central star. Osorio et al. (2014) discuss the possibility that it arises from thermal dust radiation of a circumplanetary disk associated with the protoplanet sculpting the gap. In the image of modulated PI in -band, on the other hand, there is a deep minimum in the inner power-law region whose location seems to coincide with the point source at mm (figure 5b′; see also figure 3a). This can be regarded as another sign of the protoplanet, because the disk scattering surface can be lowered by the protoplanet’s gravity, making an observable dip in near infrared scattered light (Jang-Condell, 2009).
To constrain the planet mass, it is important to precisely measure the depth and width of the gap and to compare them with a latest theoretical model of gap structure (e.g., Duffell & MacFadyen (2013); Kanagawa et al. (2015a)). An analytic formula among the gap depth, planet mass, disk aspect ratio and viscosity is presented in a separate paper (Kanagawa et al., 2015b), in which the formula is applied to the gap depth inferred from J-VLA observations of HD 169142 by Osorio et al. (2014). Imaging studies of both dust and gas emission with the ALMA will also be important in near future.
4.3 Asymmetric features in the outer power-law regions
As mentioned above, there are remarkable asymmetries both in the inner and outer power-law regions. Significant asymmetric variation in the inner power-law region (figures 3 and 5) could be due to the perturbation by a protoplanet inside the inner ring (Biller et al., 2014; Reggiani et al., 2014). The deep minimum of PI in -band in the inner power-law region coincides with the point source at mm, which can be regarded as another sign of a protoplanet surrounding the circumplanetary disk. The azimuthal distributions at the outer radii tend to have the maxima at PA, along the disk minor axis east to the star.
Besides these features, there are small-scale asymmetries in the outer power-law region (see figure 5), though the amount of variation is smaller than in the inner power-law region. There are two possibilities for the origin of these small-scale asymmetries. One is corrugation of the scattering surface in the outer region, causing a small-scale variation in grazing angle (). Such corrugation may be due to local fluctuations in disk surface density that may affect the self-gravity of the disk and hydrostatic balance in its vertical direction (Muto, 2011). The other possibility is a shadowing effect of the structure in the inner power-law regions. As described in §4.1, the radial intensity profile of near infrared scattered light as well as the broadband SED are basically explained by a minimally flaring disk (see also Grady et al. (2007); Panić et al. (2008); Meeus et al. (2010); Honda et al. (2012); Wagner et al. (2015)). If a part of the inner structure of such a disk is slightly puffed up, it may cast a shadow on the outer region observable in the near infrared image. Radial profiles along the major and minor axes (figure 4) actually show that the surface brightness in the inner ( AU) and the outer ( AU) regions are anti-correlated with each other. Similar tendency is also seen in all the pairs of radial profile apart in PA from each other (figure 7). These two possibilities may be disentangled by search for time variation on a shorter timescale in scattered-light images; if the asymmetries in the outer disk are caused by shadowing of the inner region, asymmetric patterns in the outer disk may vary on a short timescale that synchronizes with the change of disk structure in the inner power-law region (see also Wagner et al. (2015) for discussion on the relationship between the time variation seen in SED and structural change at much inner radii as small as ).
The PI in the outer region tends to be higher along the minor axis than the major axis (figure 4). This is completely opposite to other disks showing brighter PI along the minor axis (Muto et al., 2012; Kusakabe et al., 2012), which is naturally explained by the highest polarization degree in scattering. The observed features of the disk around HD 169142 are rather difficult to interpret in terms of simple Rayleigh scattering by an axisymmetric disk in nearly face-on geometry. It is more likely that the most of these asymmetric features reflect real disk structure on smaller scales, as discussed above.
5 Conclusions
We carry out coronagraphic observations of the circumstellar disk around HD 169142 in -band polarized intensity (PI) with Subaru/HiCIAO. The emission scattered by dust particles at the disk surface in , corresponding to AU at the distance to HD 169142, is successfully detected. Our conclusions are summarized as follows:
-
1.
The overall structure of the PI is nearly axisymmetric. The azimuthally-averaged radial profile of the PI shows a double power-law distribution, in which the PIs in AU and AU respectively show -dependence. These two power-law regions are connected smoothly with a transition zone (TZ). The apparent gap in AU, previously reported by Quanz et al. (2013) and Osorio et al. (2014), corresponds to the outer part of the inner power-law region and TZ.
-
2.
The PI image also contains asymmetric features. The variation along azimuthal direction in each annulus is systematically larger at inner radii, and the amount of variation in the inner power-law region is greater than 4. This could be due to the perturbation by a protoplanet inside the inner ring (Biller et al., 2014; Reggiani et al., 2014). The azimuthal distributions at the outer radii tend to have the maxima at PA, implying that the eastern part is the near side of the disk and is brighter than the western part because of the forward scattering.
-
3.
The radial profile of -dependence is realized by the combination of surface density and the pressure scale height . The observed double power-law distribution of the PI can be reproduced when the proportionality constant of surface density in the inner power-law region is smaller than that in the outer power-law region. Simple model calculation shows that the observed PI profile matches the case of , where is the depletion factor for the proportionality constant of surface density in the inner power-law region. However, this should be regarded as a lower limit because irregularity in temperature can also produce a double power-law distribution. Even with no irregularity in surface density, the observed PI profile is reproduced when , where is the proportionality constant of temperature in the inner power-law region relative to the outer region. These results are consistent with more elaborate modeling by Wagner et al. (2015). The degeneracy between and in models that reproduce the PI image should be disentangled by further imaging studies, especially at millimeter and submillimeter wavelengths.
-
4.
The modeling based on the image at mm (Osorio et al., 2014) requires a dust devoid zone between AU, while the scattered light in -band is significantly detected even in this gap. These observations suggest that larger dust particles responsible for thermal emission at millimeter wavelengths may be more deficient in the gap, as predicted by previous theoretical studies.
-
5.
The PI in the inner power-law region shows a deep minimum whose location seems to coincide with the point source at mm. This can be regarded as another sign of a protoplanet, because the scattering surface of the disk can be lowered by the protoplanet’s gravity, making an observable dip in near infrared scattered light (Jang-Condell, 2009).
-
6.
The obtained PI image also shows small scale asymmetries in the outer power-law region. Possible origins for these asymmetries include corrugation of the scattering surface in the outer region, and shadowing effect by a puffed up structure in the inner power-law region. These two may be disentangled by search for time variation on a shorter timescale in the scattered-light image.
We are grateful to the referee for valuable comments that improved our manuscript. This work is supported by MEXT KAKENHI Nos. 23103004 and 23103005, and by the U.S. National Science Foundation under Award No. 1009203. This research has made use of the SIMBAD database, operated at CDS, Strasbourg, France. Part of this research was carried out during the workshop “Recent Development in Studies of Protoplanetary Disks with ALMA”, hosted by Institute of Low Temperature Science, Hokkaido University.
Appendix A Description of the model calculations
The model is based on a disk where the surface density and temperature distributions are given by power-law forms:
| (6) |
| (7) |
where and are the surface density and temperature at . In the model, the sound speed is approximated by
| (8) |
for simplicity.
The disk is assumed to be vertically isothermal and in hydrostatic balance with the gravity of the central star. The density profile is then expressed by
| (9) |
where is the midplane density and is the pressure scale height. Assuming the Keplerian rotation, it is easy to see that is realized from equations (7) and (8). Using equation (8), the disk aspect ratio scales with
| (10) |
The midplane density, on the other hand, is related with the surface density as
| (11) |
Since our goal in this study is to assess the location of the scattering surface in a simple setup, we do not care about the consistency between the temperature and density profile in terms of the energy balance.
In radiative transfer calculation, we assume a single and isotropic scattering.444Thermal emission is included in the code as well, but it is not significant as long as we consider the intensity in near infrared beyond 10 AU. The equation to be solved is
| (12) |
where is the scattering coefficient, is the coordinate along the line of sight, is the geometric dilution factor, is the optical depth between the central star and the location of the disk, and is the optical depth along the line of sight. In integrating equation (12), we first calculate at all the location of the disk in the grid and then integrate over line of sight from the observer position to the disk.
To compare with the observed radial profile of the PI, we modify the surface density or temperature distribution as described in §4. The averaged PI is assumed to be proportional to the averaged total intensity, which seems reasonable because the total intensity has a similar radial profile to PI (Grady et al., 2007; Fukagawa et al., 2010). We treat the unit of calculated intensities as an arbitrary one partly because of the uncertainty in polarization efficiency, and we fit the shape of the PI radial profile to estimate or .
In this paper, we only deal with the cases of and and look at how the observed radial profile can be reproduced. The case corresponds to the disk whose aspect ratio is independent of as shown in equation (10) (Grady et al., 2007; Panić et al., 2008) and successfully reproduces the -dependence of the PI profile. The -dependence can also be derived analytically in and cases, as shown in Appendix B. Figure 6 shows the cases of g cm-2, K at AU taken from equilibrium temperature for blackbodies directly exposed to the stellar radiation with 9.4 (Meeus et al., 2012). Although the fiducial grain temperatures are set to the local blackbody temperature, the grains are assumed to be highly reflective, with the scattering albedo of , and their total extinction coefficient is set to be cm2 g-1 (). The change of or , however, almost scales the overall profile unless the disk gets optically thin, and it does not significantly affect the estimate for or .
The position of the scattering surface depends on two factors: (i) the volume emissivity of disk material determined by its density and emissivity, and (ii) the vertical distribution of disk material. The model described here essentially parameterizes (i) with and (ii) with , respectively. The change of can be interpreted not only by the change of material density but also by the spatial variation of optical properties of dust particles. The change of , on the other hand, can be related not only to the temperature, or the pressure scale height , but also to the degree of dust settlement toward the disk mid-plane. Since it is impossible to disentangle all these factors solely from the PI image in -band, we do not examine the detailed disk structure based on a realistic disk model in this study. Further detailed analysis on disk structure should be made after sensitive observations of dust emission at millimeter/sub-millimeter wavelengths are carried out with ALMA in a similar angular resolution.
Appendix B Analytic consideration for the cases of and
The results of the model calculation show that the cases of and successfully reproduce the -dependence of surface brightness. In fact, it is possible to predict the radial profile of the surface brightness analytically in these cases as follows.
The approximate solution to equation (12) is given by
| (13) |
where is the grazing angle of the stellar light at the disk surface. Here, the disk scattering surface is determined by the height at which the optical depth from the central star becomes unity. The optical depth can be calculated by
| (14) |
where is given by
| (15) |
Substituting the density profile given by equation (9), we have
| (16) |
Here, we have assumed that the central star is at the origin and used the fact that along the line connecting between the location of the disk considered and the stellar position. If we assume the disk with the constant , the exponential term is constant in the integration and therefore
| (17) |
Finally, if the midplane density profile is given by
| (18) |
its integration can be calculated as
| (19) |
Note that has the form
| (20) |
where
| (21) |
and
| (22) |
We can define the disk scattering surface by
| (23) |
where is the value of the order unity. Then, the location of the scattering surface is given by
| (24) |
where we have used and
| (25) |
In the regions of , in equation (24) only weakly depends on the radius, and the scattering surface always resides a few times higher than the disk scale height. Unlike a flared disk (e.g., Chiang & Goldreich (1997)), the aspect ratio of the scattering surface, , is almost constant (i.e., the scattering surface is nearly parallel to the radial direction from the star; see equation (24) in Appendix B) when and . In such a case, the surface brightness of the resultant scattering light is changed rather sensitively by the change of .
The grazing angle can be calculated by
| (26) |
Since
| (27) |
we have
| (28) |
where ′ denotes the derivative with respect to the argument. Substituting the expressions of and functions and use , we obtain
| (29) |
In , the last part in a bracket is a weak function of . We therefore conclude that the grazing angle scales with
| (30) |
and combining this with equation (13), the radial profile of the scattered light is given by
| (31) |
Equation (29) indicates that is nearly proportional to when distributes smoothly, while is proportional to , or . The difference in observed proportionality constant of PI() between and is , as shown in equations (1) and (2). This difference corresponded to 0.47 in temperature if the aspect ratio remained constant at all radii. In our model, however, in is smaller than that in , and the stellar radiation incident at the scattering surface at is brighter than the case of constant at all radii. This is why the models with closer to the unity () in §4.1 reproduces the observed radial profile.
References
- Andrews et al. (2011) Andrews, S. M., et al. 2011, ApJ, 732, 42
- Avenhaus et al. (2014) Avenhaus, H., Quanz, S. P., Schmid, H. M., Meyer, M. R., Garufi, A., Wolf, S., & Dominik, C. 2014, ApJ, 781, 87
- Biller et al. (2014) Biller, B. A., et al. 2014, ApJ, 792, L22
- Brown et al. (2009) Brown, J. M., Blake, G. A., Qi, C., Dullemond, C. P., Wilner, D. J., & Williams, J. P. 2009, ApJ, 704, 496
- Bohren & Huffman (1983) Bohren, C. F., & Huffman, D. R. 1983, Absorption and Scattering of Light by Small Particles (New York: Wiley)
- Birnstiel, Dullemond & Pinilla (2013) Birnstiel, T., Dullemond, C. P., & Pinilla, P. 2013, A&A, 550, L8
- Casassus et al. (2013) Casassus, S., et al. 2013, Nature, 493, 191
- Chiang & Goldreich (1997) Chiang, E. I., & Goldreich, P. 1997, ApJ, 490, 368
- Crida et al. (2006) Crida, A., Morbidelli, A., & Masset, F. 2006, Icarus, 181, 587
- Dong et al. (2012) Dong, R., et al. 2012, ApJ, 750, 161
- Duffell & MacFadyen (2013) Duffell, P. C., & MacFadyen, A. I. 2013, ApJ, 769, 41
- Dunkin et al. (1997) Dunkin, S. K., Barlow, M. J., & Ryan, S. G. 1997, MNRAS, 286, 604
- Dullemond & Monnier (2010) Dullemond, C. P., & Monnier, J. D. 2010, ARA&A, 48, 205
- Fukagawa et al. (2010) Fukagawa, M., et al. 2010, PASJ, 62, 347
- Fukagawa et al. (2013) Fukagawa, M., et al. 2013, PASJ, 65, L14
- Follette et al. (2013) Follette, K. B., et al. 2013, ApJ, 767, 10
- Grady et al. (2007) Grady, C. A., et al. 2007, ApJ, 665, 1391
- Grady et al. (2013) Grady, C. A., et al. 2013, ApJ, 762, 48
- Hayano et al. (2004) Hayano, Y., et al. 2004, Proc. SPIE, 5490, 1088
- Hashimoto et al. (2011) Hashimoto, J., et al. 2011, ApJ, 729, 17
- Hashimoto et al. (2012) Hashimoto, J., et al. 2012, ApJ, 758, 19
- Hinkley et al. (2009) Hinkley, S., et al. 2009, ApJ, 701, 804
- Hodapp et al. (2008) Hodapp, K. W., et al. 2008, Proc. SPIE, 7014, 701419
- Honda et al. (2012) Honda, M., et al. 2012, ApJ, 752, 143
- Inoue et al. (2008) Inoue, A. K., Honda, M., Nakamoto, T., & Oka, A. 2008, PASJ, 60, 557
- Jang-Condell (2009) Jang-Condell, H. 2009, ApJ, 700, 820
- Jang-Condell & Turner (2012) Jang-Condell, H., & Turner, N. J. 2012, ApJ, 749, 153
- Joos et al. (2008) Joos, F., Buenzli, E., Schmid, H. M., & Thalmann, C. 2008, Proc. SPIE, 7016, 48
- Kanagawa et al. (2015a) Kanagawa, K. D., Tanaka, H., Muto, T., Tanigawa, T., & Takeuchi, T. 2015a, MNRAS, 448, 994
- Kanagawa et al. (2015b) Kanagawa, K. D., Muto, T., Tanaka, H., Tanigawa, T., Takeuchi, T., Tsukagoshi, T., & Momose, M. 2015b, ApJ, in press
- Kusakabe et al. (2012) Kusakabe, N., et al. 2012, ApJ, 753, 153
- Lin & Papaloizou (1993) Lin, D. N. C., & Papaloizou, J. C. B. 1993, in Protostarsand Planets III, ed. E. H. Levy & J. I. Lunine, 749
- Lyra et al. (2009) Lyra, W., Johansen, A., Klahr, H., & Piskunov, N. 2009, A&A, 493, 1125
- Maaskant et al. (2013) Maaskant, K. M., et al. 2013, A&A, 555, A64
- Manoj et al. (2006) Manoj, P., Bhatt, H. C., Maheswar, G., Muneer, S., 2006, ApJ, 653, 657
- Mayama et al. (2012) Mayama, S., et al. 2012, ApJ, 760, L26
- Minowa et al. (2010) Minowa, Y., et al. 2010, Proc. SPIE, 7736, 77363N
- Meeus et al. (2001) Meeus, G., Waters, L. B. F. M., Bouwman, J., van den Ancker, M. E., Waelkens, C., & Malfait, K. 2001, A&A, 365, 476
- Meeus et al. (2010) Meeus, G., et al. 2010, A&A, 518, L124
- Meeus et al. (2012) Meeus, G., et al. 2012, A&A, 544, A78
- Muto & Inutsuka (2009) Muto, T., & Inutsuka, S. -I. 2009, ApJ, 695, 1132
- Muto (2011) Muto, T. 2011, ApJ, 739, 10
- Muto et al. (2012) Muto, T., et al. 2012, ApJ, 748, L22
- Osorio et al. (2014) Osorio, M. et al. 2014, ApJ, 791, L36
- Paardekooper & Mellema (2006) Paardekooper, S. -J., & Mellema, G. 2006, A&A, 453, 1129
- Panić et al. (2008) Panić, O., Hogerheijde, M. R., Wilner, D., & Qi, C. 2008, A&A, 491, 219
- Pèrez et al. (2014) Pèrez, L. M., Isella, A., Carpenter, J. M., & Chandler, C. J. 2014, ApJ, 783, L13
- Quanz et al. (2013) Quanz, S. P., Avenhaus, H., Buenzli, E., Garufi, A., Schmid, H. M., & Wolf, S., 2013, ApJ, 766, L2
- Raman et al. (2006) Raman, A., Lisanti, M., Wilner, D. J., Qi, C., & Hogerheijde, M. 2006, AJ, 131, 2290
- Reggiani et al. (2014) Reggiani, M., et al. 2014, ApJ, 792, L23
- Regály et al. (2012) Regály, Z., Juhász, A., Sándor, Z., & Dullemond, C. P. 2012, MNRAS, 419, 1701
- Skrutskie et al. (1990) Skrutskie, M. F., Dutkevitch, D., Strom, S. E., Edwards, S., Strom, K. M., & Shure, M. A. 1990, AJ, 99, 1187
- Strom et al. (1989) Strom, K. M., Strom, S. E., Edwards, S., Cabrit, S., & Skrutskie, M. F. 1989, AJ, 97, 1451
- Suzuki et al. (2010) Suzuki, R., et al. 2010, Proc. SPIE, 7735, 773530
- Sylvester et al. (1996) Sylvester, R. J., Skinner, C. J., Barlow, M. J., & Mannings, V. 1996, MNRAS,279, 915
- Tamura (2009) Tamura, M. 2009, in AIP Conf. Proc. 1158, Proc. of the Intl. Conf., ed. T. Usuda, M. Ishii, & M. Tamura (Melville, NY: AIP), 11
- Tamura et al. (2006) Tamura, M., et al. 2006, Proc. SPIE, 6269, 28
- van den Ancker et al. (1997) van den Ancker, M. E., The, P. S., Tjin A Djie, H. R. E., et al. 1997, A&A, 324, L33
- van der Marel et al. (2013) van der Marel, N., et al. 2013, Science, 340, 1199
- Wagner et al. (2015) Wagner, K. R., et al. 2015, ApJ, 798, 94
- Whitney & Hartmann (1992) Whitney, B. A., & Hartmann, L. 1992, ApJ, 395, 529
- Whitney et al. (2003a) Whitney, B. A., Wood, K., Bjorkman, J. E., & Wolff, M. J. 2003a, ApJ, 591, 1049
- Whitney et al. (2003b) Whitney, B. A., Wood, K., Bjorkman, J. E., & Cohen, M. 2003b, ApJ, 598, 1079
- Whitney et al. (2004) Whitney, B. A., Indebetouw, R., Bjorkman, J. E., & Wood, K. 2004, ApJ, 617, 1177
- Williams & Cieza (2011) Williams, J. P., & Cieza, L. A. 2011, ARA&A, 49, 67
- Wisniewski et al. (2008) Wisniewski, J. P., et al. 2008, ApJ, 682, 548
- Zhu et al. (2011) Zhu, Z., Nelson, R. P., Hartmann, L., Espaillat, C., & Calvet, N. 2011, ApJ, 729, 47