Physical Properties of Tidal Features of Interacting Disk Galaxies:
Three-dimensional Self-consistent Models
Abstract
Using self-consistent three-dimensional (3D) -body simulations, we investigate the physical properties of non-axisymmetric features in a disk galaxy created by a tidal interaction with its companion. The primary galaxy consists of a stellar disk, a bugle, and a live halo, corresponding to Milky-Way type galaxies, while the companion is represented by a halo alone. We vary the companion mass and the pericenter distance to explore situations with differing tidal strength parameterized by either the relative tidal force or the relative imparted momentum . We find that the formation of a tidal tail in the outer parts requires or . A stronger interaction results in a stronger, less wound tail that forms earlier. Similarly, a stronger tidal forcing produces stronger, more loosely wound spiral arms in the inner parts. The arms are approximately logarithmic in shape, with both amplitude and pitch angle decaying with time. The derived pattern speed decreases with radius and is close to the curve at late time, with and denoting the angular and epicycle frequencies, respectively. This suggests that the tidally-induced spiral arms are most likely kinematic density waves weakly modified by self-gravity. Compared to the razor-thin counterparts, arms in the 3D models are weaker, have a smaller pitch angle, and wind and decay more rapidly. The 3D density structure of the arms is well described by the concentrated and sinusoidal models when the arms are in the nonlinear and linear regimes, respectively. We demonstrate that dynamical friction between interacting galaxies transfers the orbital angular momentum of one galaxy to the spin angular momentum of the companion halo.
Subject headings:
galaxies: spiral — galaxies: structure — galaxies: interactions — galaxies: evolution — methods: numerical1. INTRODUCTION
Spiral arms play an important role in galactic evolution in diverse ways (e.g., Buta & Combes 1996; Kormendy & Kennicutt 2004; Buta 2013; Sellwood 2014 and references therein). They exert non-axisymmetric torque to stars and gas clouds in galaxy rotation and cause their radial migrations, leading to secular density changes of the disks (e.g., Foyle et al. 2010; Roskar et al. 2012; Baba et al. 2013; Kim & Kim 2014). They also provide sites for active star formation, which is either triggered or organized by the stellar spiral potentials (e.g., Elmegreen & Elmegreen 1986; Elmegreen 1995; Sleath & Alexander 1996; Bertin & Lin 1996; Seigar & James 2002; see also McKee & Ostriker 2007 and Dobbs & Baba 2014 for review).111In a different point of view, Mueller & Arnett (1976) introduced a concept of stochastic self-propagating star formation to explain spiral structures, although it appears to produce flocculent arms rather than grand-design arms (Gerola & Seiden, 1978; Jungwiert & Palous, 1994; Sleath & Alexander, 1995). Therefore, understanding the nature and properties of spiral arms is crucial to understand secular, chemical, and dynamical evolution of disk galaxies.
In terms of lifetime of spiral arms, the theory of spiral structure has forked into two branches: long-lived quasi-stationary density waves (Lin & Shu, 1964, 1966) and short-lived transient features (Toomre, 1969; Toomre & Toomre, 1972). The first picture requires that self-gravity plays a key role in organizing density waves into a self-sustained global pattern that rotates almost rigidly about the galaxy center (Bertin et al., 1989a, b; Lowe et al., 1994; Bertin & Lin, 1996). It successfully predicts systematic offsets between narrow dust lanes and star-forming regions associated with the arms (e.g., Roberts 1969; see also Section 6.4.3 of Binney & Tremaine 2008), although it does not address the origin of the density waves. In the second picture, on the other hand, spiral arms are transient waves that wind up over time as they propagate inward in the radial direction. In this case, spiral arms last only for a few rotation periods. Numerical simulations of isolated disk galaxies show that noises inherent in a stellar disk (e.g., Fujii et al. 2011; Grand et al. 2012, 2013; Baba et al. 2013) or perturbations provided by giant molecular clouds (e.g., D’Onghia et al. 2013) are amplified as they swing from leading to trailing configurations (e.g., Goldreich & Lynden-Bell 1965; Julian & Toomre 1966; Toomre 1981), and form transient but recurrent spiral arms. Such swing-amplified arms in isolated galaxies are usually ragged with multiple arms rather than being grand-design spirals with prominent two arms.
Observations indicate that among samples that include both non-barred and barred spiral galaxies, the probability of having grand-design arms is higher for galaxies with companions (e.g., Kormendy & Norman 1979; Elmegreen & Elmegreen 1982, 1987).222Having a bar increases the probability to possess grand-design arms especially in binary systems (Elmegreen & Elmegreen, 1982).. Recently, Kendall et al. (2015) analyzed spiral structures in a sample of galaxies from the Spitzer Infrared Nearby Galaxies Survey and found that the strength of grand-design arms is rather tightly correlated with tidal forcing from nearby companion galaxies, while the arm morphologies depend very weakly on the galaxy parameters such as stellar mass, gas fraction, disk/bulge ratio, rotational velocity, etc. This indicates that a large fraction of grand-design arms, especially for very strong arms, are driven most likely by tidal interactions.
Toomre & Toomre (1972) pioneered a numerical study for tidal interaction of disk galaxies using noninteracting test particles, and found that extended structures such as tidal tails and bridges develop in the course of galaxy encounters. Subsequent -body simulations focused on very strong encounters that lead to galaxy mergers or significant transformation of disk morphologies (e.g., Farouki & Shapiro 1982; Hernquist 1990b, 1992; Barnes 1992; Mihos & Hernquist 1994; Barnes 1998; Naab & Burkert 2003; Cox et al. 2006; Chan & Junqueira 2014). Some studies concentrated on the orbital parameters required to reproduce the observed morphologies and kinematic features of interacting galaxies (e.g., Howard & Byrd 1990; Elmegreen et al. 1991; Salo & Laurikainen 1993, 2000a), while others investigated properties of tidally-induced spiral arms (e.g., Sundelius et al. 1987; Byrd & Howard 1992; Donner & Thomasson 1994; Salo & Laurikainen 2000b). In particular, Sundelius et al. (1987) found that the spiral arms generated in a cold disk by weak tidal interaction wind up from Sc to Sa appearances. Byrd & Howard (1992) showed that inner spiral arms are created if the tidal strength parameter (see below for definition) is larger than , suggesting that even a low-mass companion can tidally excite grand-design arms if the pericenter distance is small enough. To characterize the tidal strength, Elmegreen et al. (1991) instead used the parameter (see also below for definition) that takes into account the interaction duration, finding that a tidal encounter with deforms the outer disk into an “ocular” shape.
Numerical simulations often show that tidally-induced arms are transient and posses the characteristics of kinematic density waves. For example, Donner & Thomasson (1994) found that spiral arms driven by tidal forces resemble kinematic density waves when self-gravity is weak. In modeling tidal interactions of the M51/NGC 5195 system, Salo & Laurikainen (2000b) found that spiral arms in M51 cannot be described by a single pattern speed, indicative of kinematic density waves. Baba et al. (2013) showed that spiral arms in an isolated galaxy generated by swing amplification of random perturbations have a pattern speed that decreases with the galactocentric radius (see also D’Onghia et al. 2013; Michikoshi & Kokubo 2014). Chan & Junqueira (2014) also found that the pattern speed of arms driven by a satellite on a bound eccentric orbit decreases with radius.
To quantify how the physical properties of the tidally-driven arms depend on , Oh et al. (2008, hereafter Paper I) ran a series of -body simulations by considering a stellar disk inside a fixed halo interacting with a point mass companion on a prescribed parabolic orbit. Paper I found that a tidal bridge consists of the disk particles pulled out by the tidal perturbations, with their epicycle phases locked to the companion, while a tidal tail forms as strongly perturbed near-side particles overtake mildly perturbed far-side particles. Paper I also found that a stronger encounter produces stronger, more open arms that start to develop earlier at smaller . The arm pattern speed turned out to be a decreasing function of even when the arms are strongest, and converges to the curve as they decay. This suggests that tidally-driven arms are unlikely to be quasi-stationary density waves. Similar results were obtained by Dobbs et al. (2010) who included a gaseous disk as well in simulating the M51/NGC 5195 system, although gravity of the gaseous component tends to increase the arm pattern speed. Struck et al. (2011) suggested that these are caustic waves maintained by coherent epicycle oscillations triggered by tidal forcing.
While the results of the Paper I are informative in assessing the quantitative effects of tidal perturbations on the arm properties, they were based on highly idealized galaxy models. First of all, Paper I considered an infinitesimally-thin, two-dimensional (2D) stellar disk. This not only neglects nonplanar motions but also overestimates self-gravity of the disk, making the spiral arms stronger than in disks with finite thickness. In addition, Paper I employed fixed gravitational potentials for the halo/bulge and the perturbing companion. This precludes the possibility of dynamical friction occurring due to their gravitational reactions to the tidal perturbations. Moreover, the galaxy and the companion in Paper I were set to follow the prescribed parabolic orbits, which ignores their orbital decay caused by angular momentum loss. By evolving the system in the frame in which the galaxy remains stationary, Paper I also ignored indirect forces arising from the orbital motion of the galaxy relative to the center of mass of the system, potentially suppressing the growth of lopsided spiral modes in the stellar disk (e.g., Adams et al. 1989; Ostriker et al. 1992).
To overcome the caveats mentioned above, we in this paper extend Paper I by considering a self-consistent three-dimensional (3D) galaxy model in which the stellar disk has a finite thickness and a central bugle and a dark halo are represented by live particles rather than by fixed potentials. The perturbing companion is modeled by a live halo alone for simplicity. As in Paper I, we control the strength of a tidal encounter by varying two parameters: the pericenter distance and the galaxy-to-companion mass ratio. Our objective is four-fold. First, we wish to measure the physical properties of tidally-induced spiral arms in more realistic 3D models and compare them with those in the razor-thin counterpart. We will also find the quantitative dependence of the arm properties on both and . Second, Springel & White (1999) and Dubinski et al. (1999) showed that the formation of tidal tails depends on the shape of the galactic potential. We will show that the tail formation depend not only on the potential shape but also on the tidal stregnth. Third, we want to explore 3D density structures inside spiral arms and compare them with the analytic formulae proposed by Cox & Gómez (2002). Finally, we will show that dynamical friction of the companion in the course of a tidal interaction can be a source of the spin angular momentum of the primary halo.
This paper is organized as follows. In section 2, we describe our galaxy model and introduce the parameters for tidal strength. In Section 3, we present the properties of tidal tails formed in the outer parts and spiral arms in the inner parts. In Section 4, we analyze the 3D density structures of spiral arm in the radial and vertical directions and compare them with the prediction of Cox & Gómez (2002). In Section 5, we explore the orbital decay of the galaxy caused by dynamical friction, which results in spin-up of the initially non-rotating halo. Finally, we summarize our results and discuss their astronomical implications in Section 6.
2. MODEL
2.1. Galaxy Models
In this paper we use 3D -body simulations to study the tidal interaction of a disk galaxy with its companion. The galaxy consists of a stellar disk, a spherical bulge, and a dark matter halo; the effect of a gaseous component is not considered in the present study. For the halo, we adopt a truncated Hernquist (1990a) model
| (1) |
with the mass , the scale radius , and the truncation radius , within which of is enclosed. For the bulge, we take a Plummer sphere
| (2) |
with and .
The stellar disk is initially axisymmetric with density distribution
| (3) |
where is the total disk mass, is the radial scale length, and is the vertical scale height. The corresponding stellar surface density is at . The mass ratio of each component of the galaxy is , with the total mass within the truncation radius.
|
|
|
|
|
|
|
|
|
||||||||||||||||||
|---|---|---|---|---|---|---|---|---|---|---|---|---|---|---|---|---|---|---|---|---|---|---|---|---|---|---|
| TA1 | 0.44 | 25 | 0.410 | 0.248 | 0.12 | 0.69 | 30.9 | 0.173 | ||||||||||||||||||
| TA2 | 0.44 | 35 | 0.180 | 0.166 | 0.16 | 0.61 | 23.1 | 0.108 | ||||||||||||||||||
| TA2H | 0.44 | 35 | 0.175 | 0.163 | 0.15 | 0.61 | 25.5 | 0.113 | ||||||||||||||||||
| TA3 | 0.44 | 45 | 0.096 | 0.121 | 0.21 | 0.55 | 13.6 | 0.066 | ||||||||||||||||||
| TB1 | 0.22 | 25 | 0.202 | 0.134 | 0.19 | 0.45 | 14.2 | 0.111 | ||||||||||||||||||
| TB2 | 0.22 | 35 | 0.089 | 0.091 | 0.25 | 0.45 | 10.2 | 0.061 | ||||||||||||||||||
| TB3 | 0.22 | 45 | 0.046 | 0.065 | 0.35 | 0.39 | 7.6 | 0.039 |
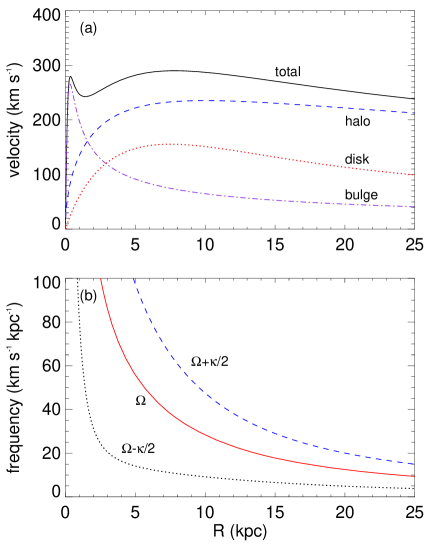
Figure 1 plots the radial distribution of the circular velocity and the contribution of each component as well as the characteristic angular frequencies and in the initial disk. The presence of a strong bulge makes the curve rise steeply toward the center, which suppresses the formation of a bar in our tidal encounter models (e.g., Toomre 1981; Sellwood 2000). To find the equilibrium velocity distribution of the disk particles under the total gravitational potential, we solve the axisymmetric Jeans equations using the method described in Hernquist (1993) and Springel et al. (2005). We ensure that the dark matter halo and bulge do not rotate initially. For the disk, the radial profile of the radial velocity dispersion is chosen such that the Toomre stability parameter of the 3D disk is similar to that of the 2D counterpart considered in Paper I; we set over , which is large enough to suppress a spontaneous growth of spiral structures when evolved in isolation.
We model the perturbing companion using a dark matter halo alone, which follows the truncated Hernquist profile
| (4) |
with the scale radius of , and for . We vary the companion mass to study the dependence of tidal features on the strength of tidal force (see Section 2.2). Compared with the point-mass model considered in Paper I, the current extended-halo model realizes a more realistic, smooth variation of the perturbing gravitational potential especially when the companion is close to the pericenter.
Most of the simulations presented in this paper use the galaxy model constructed by distributing , , and particles for the halo, bulge, and disk of the primary galaxy, respectively, and particles for the companion. We evolve our 3D galaxy model in isolation for 2 Gyr, finding that the disk remains almost axisymmetic, with very weak ( density variations) nonaxisymmetric features forming at its outskirts. This suggests that our initial disk is globally stable, due to a strong bulge as well as quite large value , in the absence of tidal perturbations. To check the dependency of simulation outcomes on the particle numbers, we also run a high-resolution model using , , , and particles. We find that resolution does not make significant differences in the properties of tidal features: the spiral arms in the low-resolution model are weaker and have a smaller pitch angle than in the high-resolution counterpart.
2.2. Model Parameters
Initially, we place the two galaxies at large separation, and make them move on mutual parabolic orbits with a pericenter distance that is calculated under the assumption that the total mass of each galaxy is concentrated at its own center of mass. The galaxy orbits are prograde and located at the same plane as the disk of the primary galaxy. To study tidal interactions with differing strength, we consider six models that differ in and .
The responses of the stellar disk to the tidal field of the companion can be parameterized by either
| (5) |
or
| (6) |
where , taken equal to in this work, is the characteristic size of the primary galaxy (e.g., Springel & White 1999), is the galaxy mass within , is time elapsed for the companion to orbit one radian near the pericenter, and is time taken by the disk particles at to rotate one radian about the galaxy center. The parameter in Equation (5) directly measures the tidal force exerted by the companion relative to the gravitational force of the primary at (e.g., Byrd & Howard, 1992). On the other hand, the parameter in Equation (6) takes allowance for the duration of tidal interaction and thus corresponds to the ratio of the linear momentum imparted to a disk particle by the companion with respect to its original linear momentum of galaxy rotation (e.g., Elmegreen et al., 1991). Note that the current definition of differs slightly from that given in Paper I, since the companion now has an extended density distribution rather than being treated as a point mass. When the tidal perturbations are applied impulsively over the time scale of , is a good measure of tidal strength (e.g., Section 8.2 of Binney & Tremaine 2008). One can thus expect that is a better measure of tidal forcing for tidal tails formed in the outer disk where the rotation period is longer than .
Table 1 lists the parameters of each model and some simulation outcomes. Column (1) labels each run. We choose model TA2 with and as our fiducial model, which is the 3D counterpart of model A2 of Paper I. Model TA2H is identical to model TA2 except that the former employs 20 times more particles than the latter. Column (2) gives the companion mass relative to the primary galaxy. Column (3) lists the pericenter distance of two galaxies under the Keplerian orbits. Columns (4) and (5) give the dimensionless interaction strengths and , respectively. Columns (6), (7), and (8) list the time when the tidal tail develops strongest, and its pitch angle and surface density at , respectively. Here, is the surface density of the initial disk at . Finally, Column (9) gives the peak strength of the spiral arms that are induced.
We take , , and as the units of mass, length, and velocity, respectively. In these units, the gravitational constant is , and the corresponding unit of time is . The simulation time is set such that corresponds to the closest approach of the galaxies under the prescribed parabolic orbits, but the tidal deformation of the galaxies makes the actual time of the closest approach delayed to –0.04, with a smaller value corresponding to weaker tidal forcing. All the simulations start from , when the two galaxies are separated more than . For model TA2, the initial positions and velocities of the galaxies are and for the primary, and and for the companion.
The simulations are performed using the GADGET code that employs the Barnes-Hut hierarchical tree algorithm (Barnes & Hut, 1986) to solve the Poisson equation (Springel et al., 2001). We adopt the force error tolerances of and . The gravitational softening parameter in the low-resolution models is set to for the disk, the halo, and the companion, and for the bulge, corresponding to 2.8 times the mean particle distance in each system (e.g. Springel et al. 2001).
3. Properties of Tidal Features
Tidal perturbations disturb not only the otherwise axisymmetric disk, producing a tidal tail and a bridge in the outer parts () and spiral waves in the inner parts (), but also the primary halo and companion galaxy. In this section, we explore the correlations between the physical properties of the tidal features and the interaction strength parameters and . The deformation of the halo and companion will be presented in Section 5.
3.1. Tidal Tail and Bridge
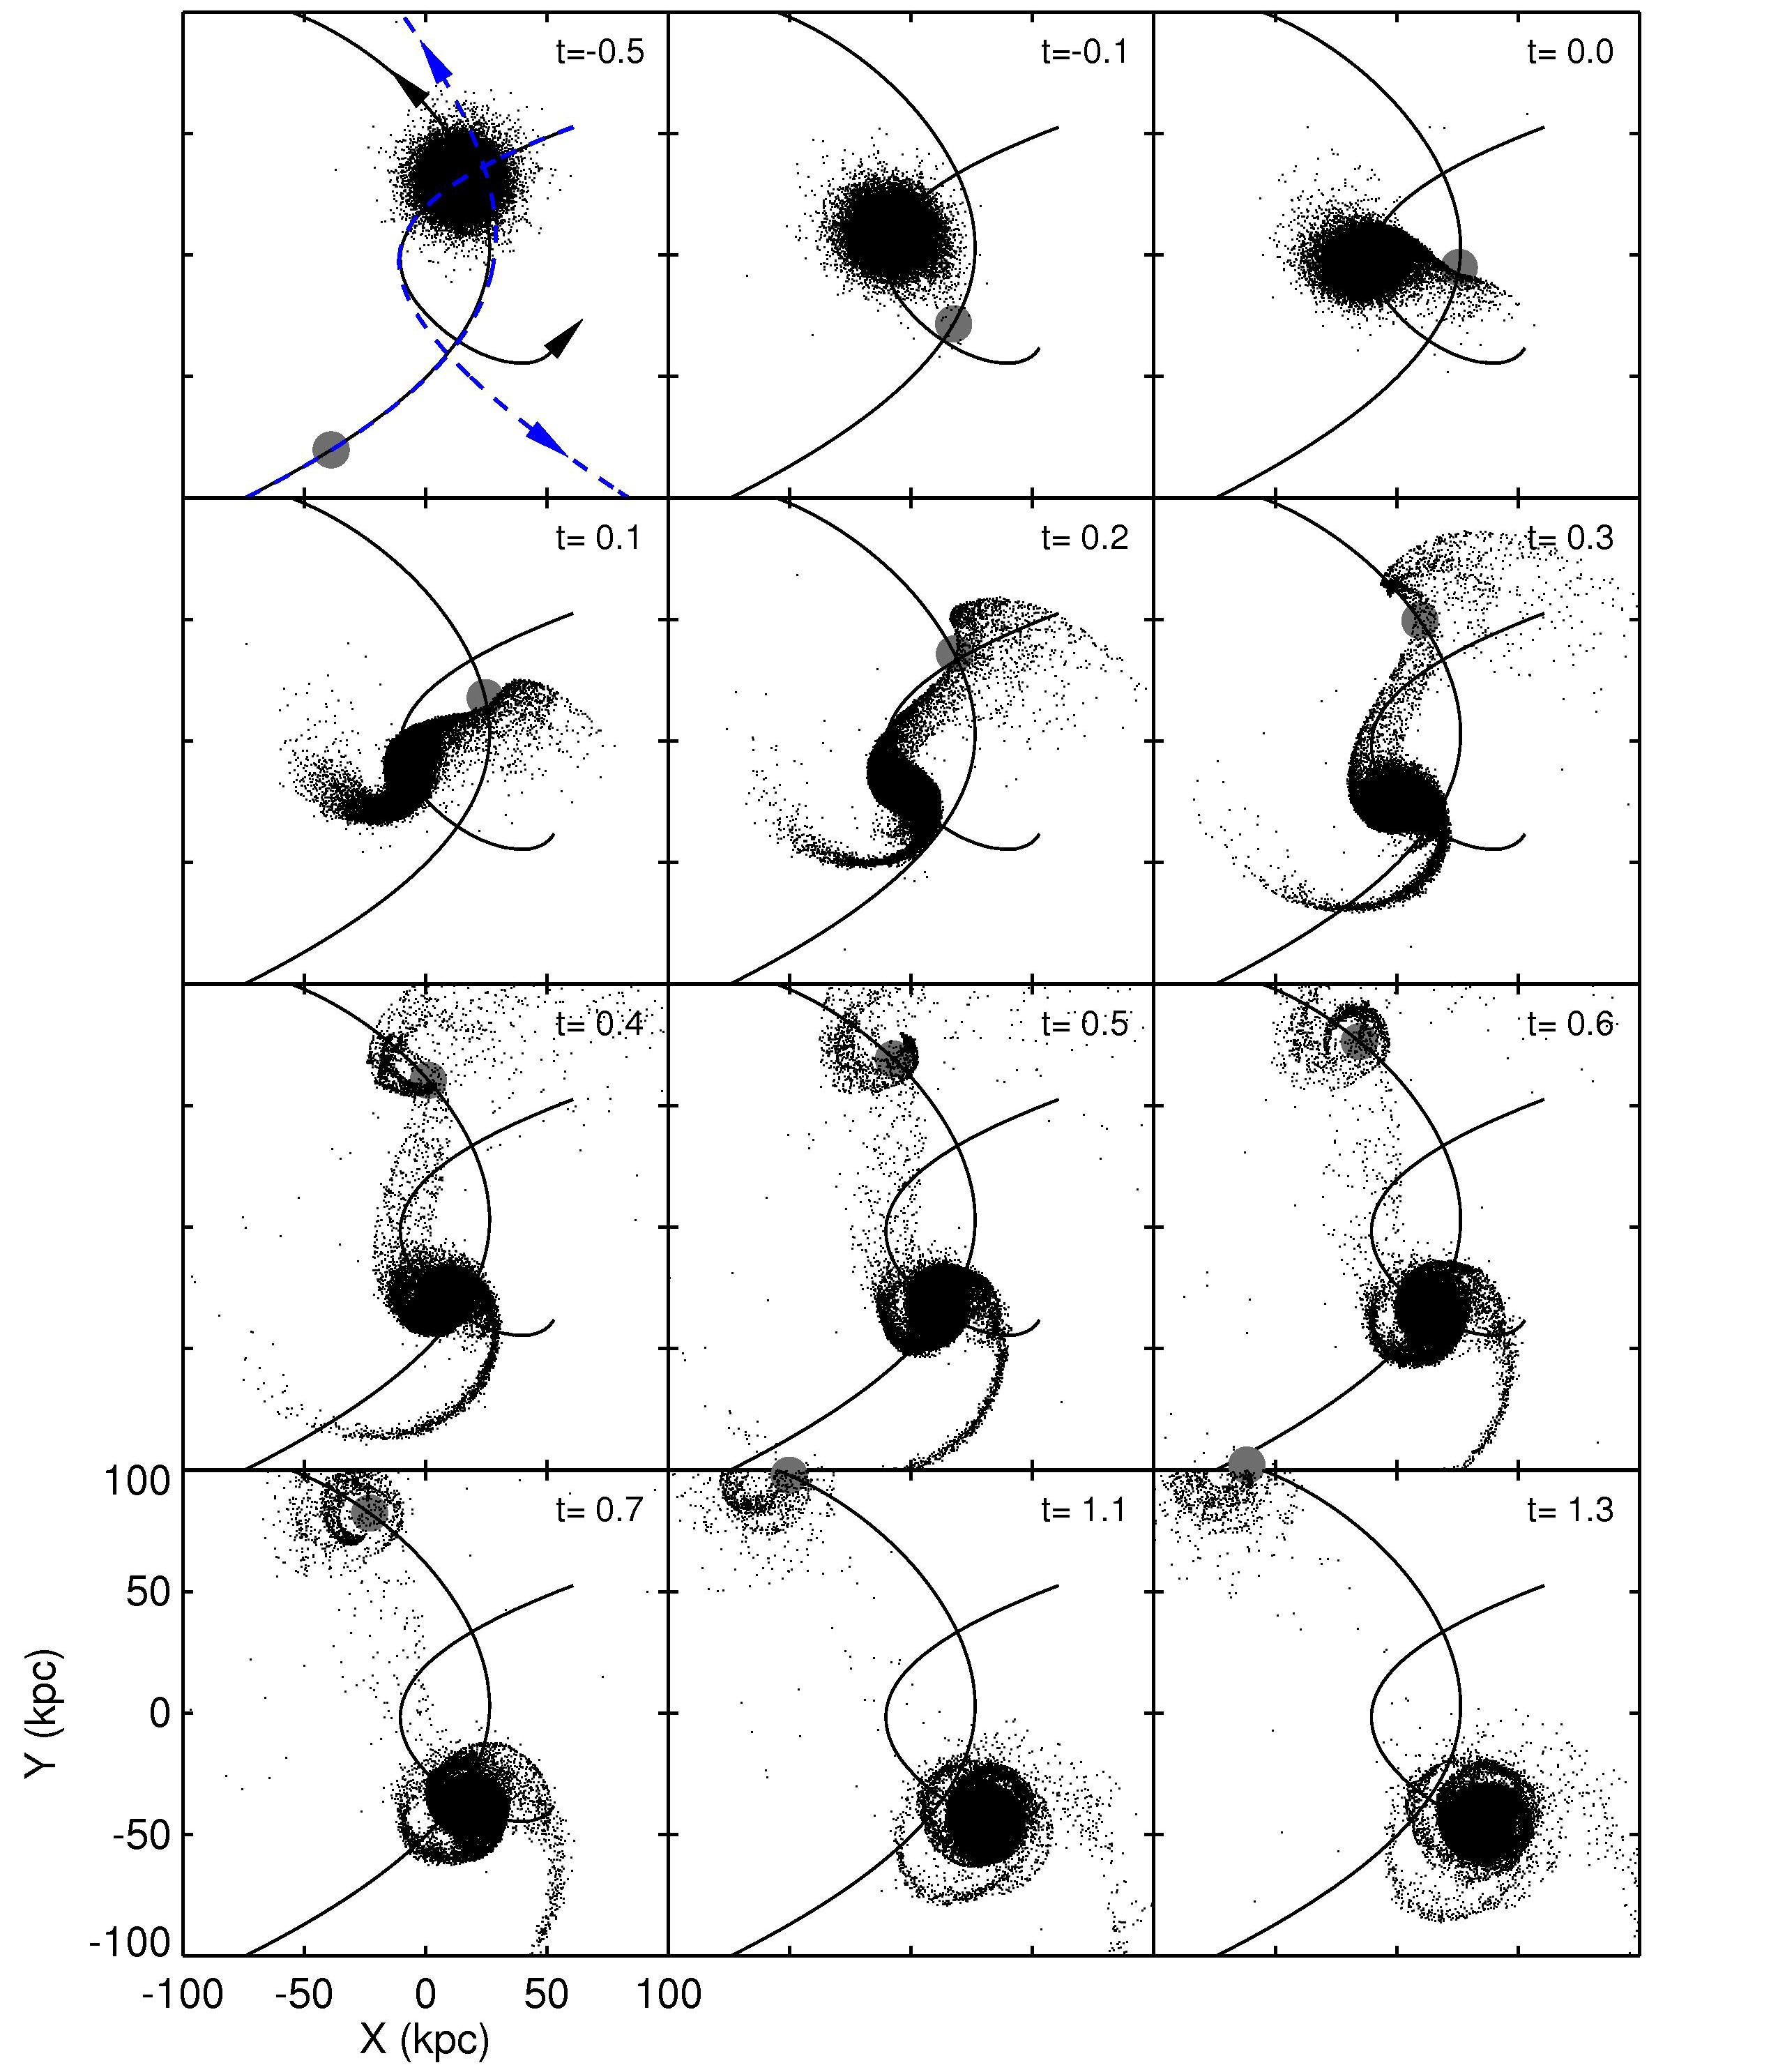
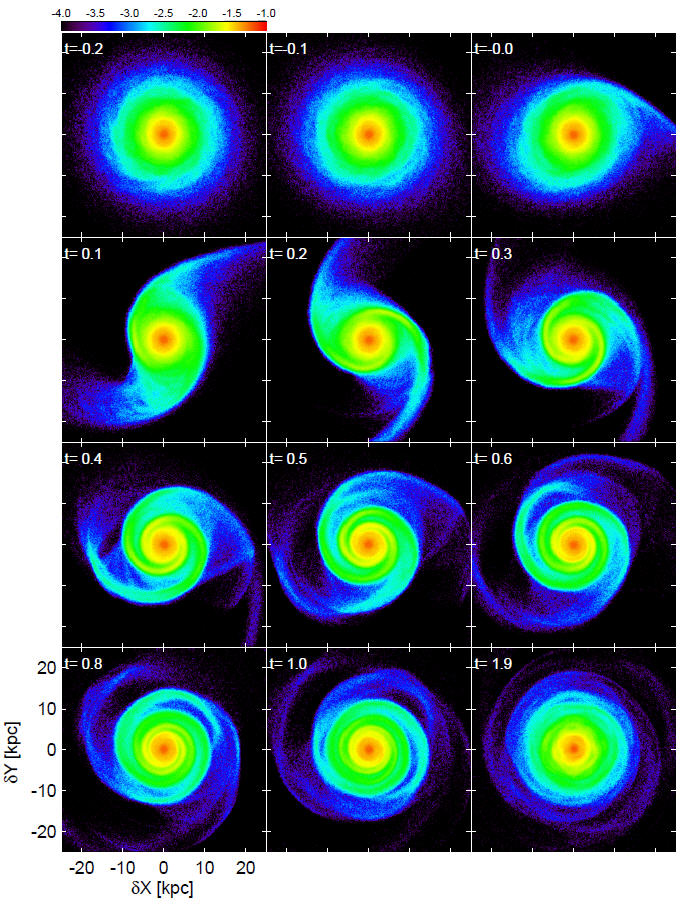
Figure 2 shows morphological changes of the stellar disk of the primary galaxy in our fiducial model TA2 projected on to the orbital plane. The grey circle in each frame indicates the center of mass of the companion at a given epoch, with its size corresponding to the region encompassing a half of the companion mass. The solid curves represent the actual trajectories of the two galaxies. The dashed lines in the frame draw the parabolic orbits they would follow if their extended mass distributions were undisturbed over the course of the encounter. The difference between the solid and dashed orbits are due to the angular momentum loss caused by dynamical friction, as will be discussed in Section 5 in detail.
At early time when the galaxies are separated widely (), tidal perturbations are so weak that the orbits are parabolic and the disk of the primary remains almost axisymmetric. As the perturbing galaxy approaches the pericenter, the tidal force begins to excite the epicycle motions of stars in the outer disk, first shaping them into a bridge at the near side to the companion () and then a tail at the opposite side (). In the bridge, the epicycle phases of the constituting particles are forced to be aligned to the companion in such a manner that the radial velocities and the gradient of the azimuthal velocities are always maximized along the line connecting the galaxies (Paper I). On the other hand, the tidal tail develops as strongly perturbed particles at the near side catch up and overlap with mildly perturbed particles at the far side (Paper I; Pfleiderer 1963; Toomre & Toomre 1972). The tail is approximately logarithmic in shape, indicating that its pitch angle is independent of .
The tails and bridges produced in our models are transient and decay after . As the companion recedes, the tidal force becomes weaker and is thus unable to keep the coherency of the forced epicycle phases of the bridge particles. Composed of particles gathered from a wide range of radii in the unperturbed disk, the tails have a large velocity dispersion, tending to disperse with time. They disappear almost completely at . A small fraction () of the disk particles that achieve velocities larger than the escape velocity become unbound, either captured by the companion or escaping from the system. With no further perturbations from the companion at , on the other hand, the bound particles once in the bridge or tail spread out, following galaxy rotation with large eccentricities. The disk becomes increasingly featureless over time.
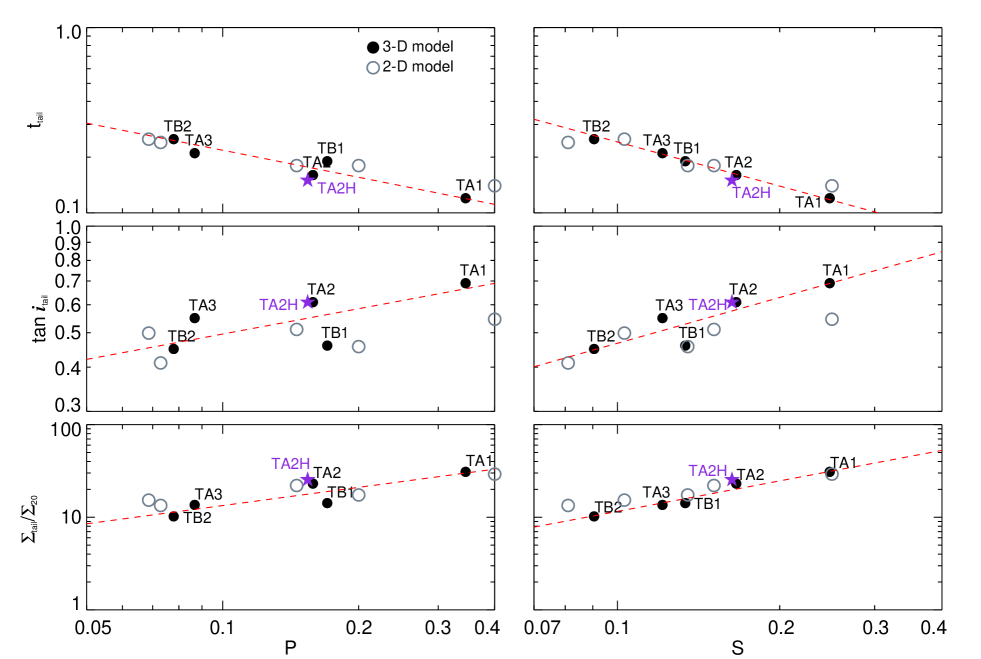
Paper I found that the formation time, shape, and strength of the tails in 2D models are well correlated with . To study how the correlations change in the current self-consistent 3D models, we define the tail formation epoch, , as the time when it becomes densest at , and measure its pitch angle and surface density at that time. Figure 3 plot these values as filled symbols against and ; these are also tabulated in Columns (6)–(8) of Table 1. With weak tidal interaction, model TB3 does not produce a readily identifiable tail, suggesting that the formation of tidal tail requires or . This threshold is probably a lower limit since all of our models consider in-plane, prograde encounters, the most favorable condition for the tail development. A stronger tail tends to form earlier and has a larger pitch angle. The dashed lines are the best power-law fits to the 3D results: , , and in terms of ; , , and in terms of . As expected, the tail properties are better correlated with than : the linear fitting coefficients are and against and , respectively. For comparison, we also plot the 2D results taken from Paper I as as open circles. Overall, the 2D and 3D results agree very well, although the 3D tails are slightly weaker, which is probably caused by weaker disk gravity due to finite disk thickness. Figure 3 shows that the tail in model TA2H with high resolution has almost the same properties as in model TA2, suggesting that our results do not depend sensitively on resolution.
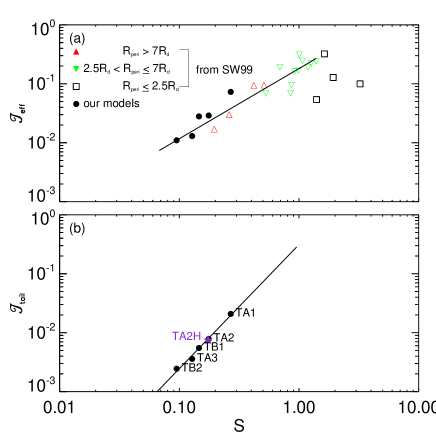
Another way to quantify the tail strength is to use the tidal response introduced by Springel & White (1999) who ran a number of -body simulations for galaxy mergers with differing halo mass and interaction strength. They defined as the maximum fraction of the disk particles in each model that reach distances beyond ( in our models) from the disk center in the course of interaction. Figure 4(a) plots from our tail-forming models (filled circles) as well as the models (open symbols) from Springel & White (1999) as a function of : regular triangles are for models with ; inverted triangles for ; squares for . All of our models have . Despite differences in the galaxy models such as potential depth and rotation curve, etc., our results are overall in good agreement with the extrapolation of Springel & White (1999) for . Note that in very strong encounter models with in Springel & White (1999) represented by open squares, the companion directly passes through the inner parts of the primary disk, for which the parameter relying on a distant tide approximation is not useful in characterizing the interaction strength. Except for these very strong-encounter models, there is a good correlation between and with some scatters. The best fit for models with is , which is shown as the solid line in Figure 4(a).
Since includes the particles not only in a tail but also escaped or captured to the companion, to measure the tail strength we similarly define as the fraction of the disk particles consisting only of a tail at . Figure 4(b) plots for our models as a function of . The solid line draws the best fit , which has a tighter correlation than the – relation. The – relationship can be explained as follows. Let us assume that the tidal perturbations are applied impulsively near the pericenter during the time interval . The radial velocity increment at is then given by . This enhances the epicycle amplitudes of the disk particles to . With the epicycle frequency at for flat rotation, it follows that . Since the perturbed mass that goes into the tail is proportional to , one obtains , similar to our numerical results.
3.2. Spiral Arms
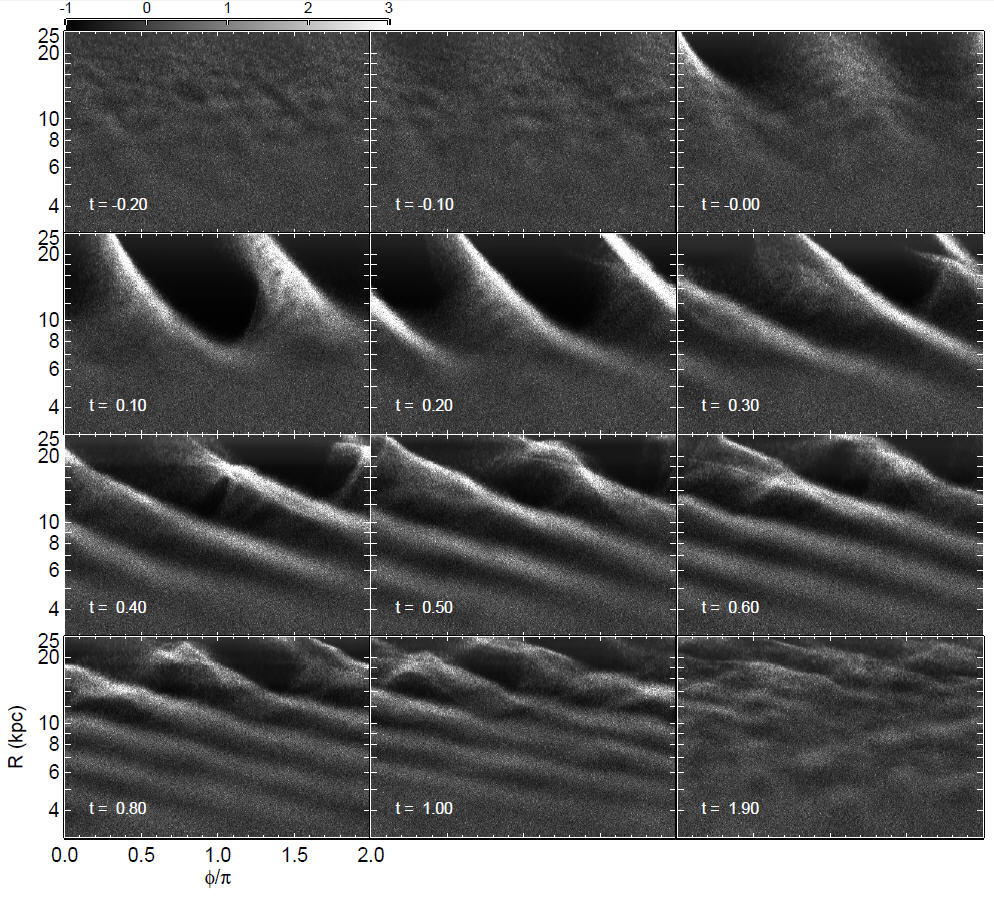
We have seen in the previous section that the tidal force from the companion provides strong perturbations to epicycle orbits of particles in the outer disk, resulting in a tidal tail and a bridge. Tidal disturbances in the inner part of the disk are not as strong as in the outer parts, but can nevertheless induce spiral arms there (e.g., Toomre 1969; Donner et al. 1991). Figure 5 plots close-up snapshots of the stellar surface density in logarithmic scale in model TA2H projected onto the orbital plane, with the center of mass of the disk shifted to the origin (). At , the outer edges of the arms are quite sharp, which is a common feature of tidally-induced arms (e.g., Struck 1990; Elmegreen et al. 1991; Elmegreen et al. 2011; Dobbs et al. 2010).
To delineates the spiral structure, Figure 6 plots the perturbed surface density, , relative to the initial surface density in the – plane. Before the companion passes by the pericenter (), the disk appears almost axisymmetric, without forming a bar or spiral structures, indicating again that the disk is globally stable in isolation. Tidal disturbances excite epicycle motions of the particles in the inner disk, which are coherently organized to build up a well-defined two-armed global spiral pattern. With , the effect of swing amplification on the growth of the spiral arms is not significant (Paper I). It is apparent that the arms are approximately logarithmic. In model TA2H, they become strongest at and decay as they keep winding out over time. In these single encounter experiments, no spiral arms are apparent after (see also Fig. 5).
3.2.1 Arm Strength
One of the most important parameters that control the responses of gas flows across a stellar spiral arm is the arm strength (e.g., Kim & Kim 2014; Kim et al. 2014). It has often been customary to quantify the arm strength using the dimensionless parameter
| (7) |
where denotes the amplitude of the Fourier mode of . Note that effectively measures the maximum gravitational force due to the spiral arms as a fraction of the axisymmetric gravitational force in the unperturbed disk (Roberts, 1969; Shu et al., 1973; Kim & Ostriker, 2002, 2006; Shetty & Ostriker, 2006).333For -armed tightly-wound spirals with pitch angle and radial wavenumber , the corresponding gravitational potential at of a razor-thin disk is with (e.g., Eq. (6.31) of Binney & Tremaine 2008). Therefore, .
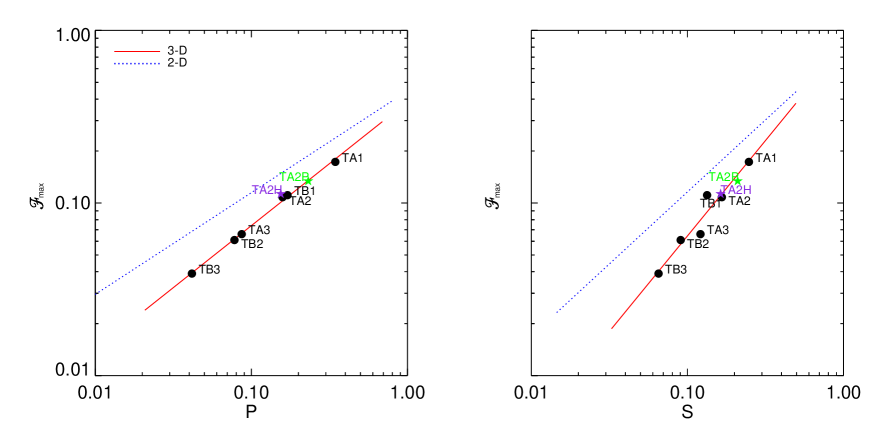
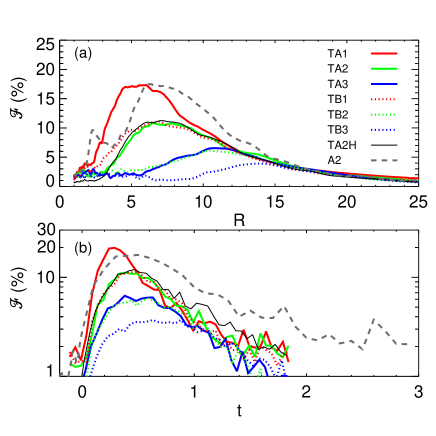
Figure 7(a) plots the radial variation of averaged over the time interval centered at the epoch when the arms attain the maximum strength in each model, while Figure 7(b) gives the temporal change of averaged over a range of radii where the arms are strong. Definitely, a weaker tidal interaction produces weaker arms that grow more slowly at larger galactocentric radii: they are maximized at for the intermediate encounter models TA1, TA2, and TB1 with (or ), and at – for the weak encounter models TA3, TB2, and TB3 with (or ). The difference between the results of models TA2 and TA2H is insignificant, indicating again that resolution does not affect the simulation outcomes much. For comparison, Figure 7 also plots the results of the 2D model A2 taken from Paper I as dashed lines. Note that the arms in model A2 have about 70% stronger than in the 3D counterpart, which is primarily due to the overestimated self-gravity in the 2D, razor-thin geometry.
Figure 8 plots the peak arm strength as functions of and . The solid lines represent the best power-law fits and to the 3D results, with the linear correlation coefficients of and relative to and , respectively. These can be compared to the 2D results of from Paper I shown as dotted lines. Observations usually measure the arm strength in terms of the relative Fourier amplitude (e.g., Rix & Rieke 1993; Patsis, Héraudeau, & Grosbøl 2001; Kendall et al. 2015). In order to facilitate comparisons with observations, Figure 9 presents the dependence on of calculated from our 3D results. The filled circles plot the averages over and , with the errorbars corresponding to the standard deviations. The solid line is the best fit: .
The spiral arms achieve the full strength at – with smaller values corresponding to stronger tidal interaction, after which they begin to decay. This is mainly caused by the increase in the velocity dispersions of the disk particles. First of all, the growth of spiral arms requires the particles at different radii to gather into the arms, which increases the velocity dispersions (Paper I). Also, heating of the disk particles due to gravitational scattering off the arms becomes efficient once the arms are strong enough, inhibiting further growth of the arms (e.g., Sellwood & Carlberg 1984; Binney 2001). The increased velocity dispersions make the epicycle orbits in the arms kinematically less coherent. Figure 7(b) shows that the amplitudes of the arms in the current 3D models decrease with time almost exponentially, with a characteristic timescale of Gyr, about twice faster than in the 2D models of Paper I. The faster decay of the arms in the 3D models is presumably due to weaker disk gravity in a stratified disk, which makes the arms wind out at a faster rate as well.
3.2.2 Pitch Angle
Figure 6 shows that the tidally-induced spiral arms are approximately logarithmic in shape over a wide range of radii. This appears consistent with the observational results that grand design spirals are close to be logarithmic in optical and near-infrared images (e.g., Grosbl & Patsis 1998; Seigar et al. 2006; Davis et al. 2012; Martínez-García 2012). As in Paper I, we calculate the arm pitch angle at a given time by first finding the Fourier coefficients in and defined as
| (8) |
where is the number of particles located at – for the intermediate tidal-forcing models with (or ), and at – for the weak forcing models with (or ), are the coordinates of the -th particle, and is a real number corresponding to the slope of a two-armed spiral in the plane. We then calculate that maximizes and calculate the pitch angle of the arms through at each time (e.g., Sellwood & Carlberg 1984; Sellwood & Athanassoula 1986).
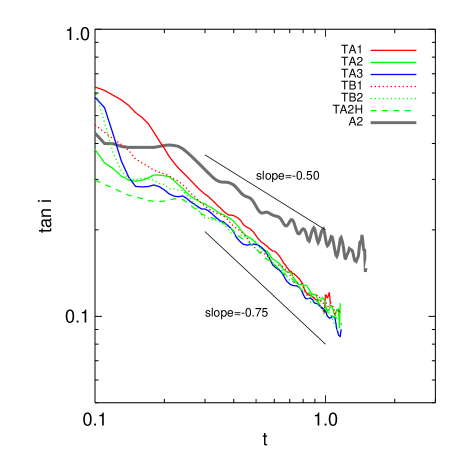
Figure 10 plots the temporal changes of the arm pitch angles for all 3D models. The 2D result of model A2 from Paper I is also compared. When the arms stand out initially, they have moderate pitch angles amounting to . After attaining the peak amplitude, the arms in the 3D models wind out over time as , which is steeper than in the 2D models. The faster winding rates in 3D models are again because of reduced self-gravity in vertically-extended disks. Note that the pitch angle of purely kinematic density waves with no self-gravity decays as (e.g., Section 6.2 of Binney & Tremaine 2008).

3.2.3 Pattern Speed
The pattern speed of spiral arms is also an important parameter, although it is not well constrained observationally. To calculate the arm pattern speed induced in our models, we use the normalized cross-correlation of the perturbed surface densities at two different epoches separated by as
| (9) |
By taking a sufficiently small value of , we find that maximizes at given radius and time. The instantaneous pattern speed is then given by .
Figure 11 plots as contours the amplitudes of the in the – plane for some selected epoches of models TA2 (left) and TB2 (right). The angular frequencies and from the initial rotation curve are overplotted as a solid line and two dotted lines, respectively. The locus of in each panel draws the arm pattern speed as a function of . Shortly after the pericenter passage of the companion (), the perturbed surface density is dominated by the tidal bridge rather than the arms. The bridge has an almost fixed pattern speed at km s-1 kpc-1, which corresponds to the angular speed of the companion near the pericenter. At this time, the particles inside the bridge are tidally locked to the companion. As the companion moves away from the primary, the bridge becomes weaker and becomes progressively dominated by the spiral arms. At when the arms have substantial amplitudes, is larger than , but only slightly. Since is not constant over radius, the arms produced in our models are not exactly a pattern in a strict sense. They are rather similar to gravity-modified kinematic density waves. Although self-gravity tends to increase , its effect is not significant in our 3D models. At late time (), converges to the curve.
To summarize this section, spiral arms induced by a tidal interaction in our models are not quasi-stationary density waves envisaged by Lin & Shu (1964). They are rather kinematic density waves slightly modified by gravity. Due to reduced self-gravity, spiral arms in the 3D models are weaker and decay faster than those in the razor-thin counterparts. The arms in vertically-stratified disks have a smaller pitch angle and wind up more rapidly than those in the razor-thin, 2D disks.
4. Density Structure of Spiral Arms
While there are numerous studies on the generation of stellar spiral arms, they concentrate mostly on arm morphologies and longevity without focusing on the arm density structures (e.g., Hernquist 1990b; Barnes 1992; Mihos & Hernquist 1994; Naab & Burkert 2003). Without much information on the vertical structure of stellar spiral arms, most previous works that studied galactic spiral shocks across the arms employed the arm potentials that are independent of, or varying weakly with, the vertical height (e.g., Kim & Ostriker 2006; Kim et al. 2006, 2010). Cox & Gómez (2002) suggested an analytic expression for 3D spiral density perturbations as described below. In this section, we analyze the density structures of spiral arms produced in our models and compare them with the analytic suggestion of Cox & Gómez (2002).
Starting from a physically-motivated trial function for the spiral gravitational potential that drops off exponentially in the radial direction, Cox & Gómez (2002) obtained a simple formula for the spiral density perturbation
| (10) |
with
| (11) |
where is the normalization coefficient, is the fiducial radius, is the radial scale length of the perturbed density, is the vertical scale height, is the Fourier amplitude of an azimuthal mode , and denotes the azimuthal phase of the arm at . The summation over is to allow for linear superpositions of various modes along the azimuthal direction for two-armed, logarithmic spirals. As examples, Cox & Gómez (2002) considered two different cases: sinusoidal arms having with (e.g. Kim & Ostriker, 2002; Wada & Koda, 2004; Shetty & Ostriker, 2006) and concentrated arms having with , , and . The concentrated arms have flatter interarm regions than the sinusoidal arms. The four-armed concentrated spirals were used by Dobbs & Bonnell (2006) and Dobbs et al. (2006) to study gas dynamics driven by spiral arms. The thick spiral potential considered by Patsis, & Grosbøl (1996) corresponds to the sinusoidal arms.
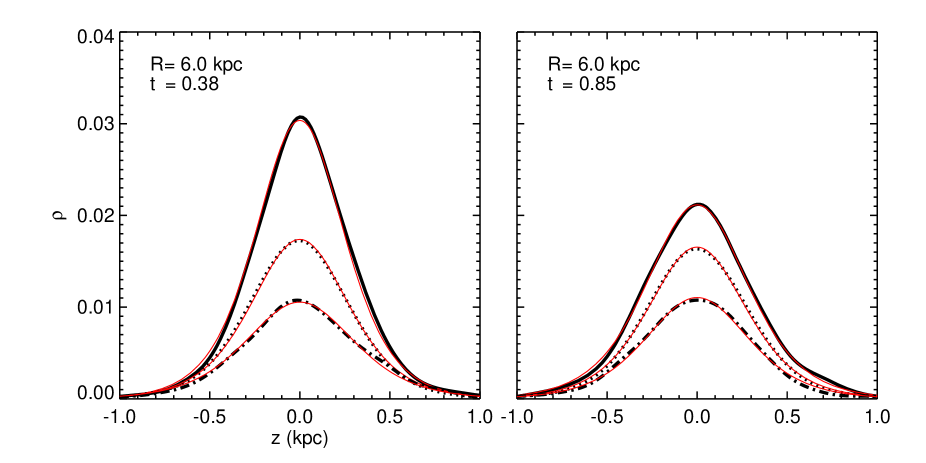
Figure 12 plots the vertical density profiles in the arm regions at and of model TA2H at when the arm strength is nearly peaked (left), and at when the arms are in the decaying phase (right). The black solid, dotted, and dot-dashed lines draw the total density , the azimuthally-averaged density , and the perturbed density , respectively. The three density distributions are well described by , shown as thin red lines, with , , at for the total, azimuthally-averaged, perturbed densities, respectively, and with , , at . The temporal increase of the scale heights between and is due to disk heating. But, these agree within 10%, validating the vertical dependence of in Equation (10), with a scale height similar to that of the background averaged disk.
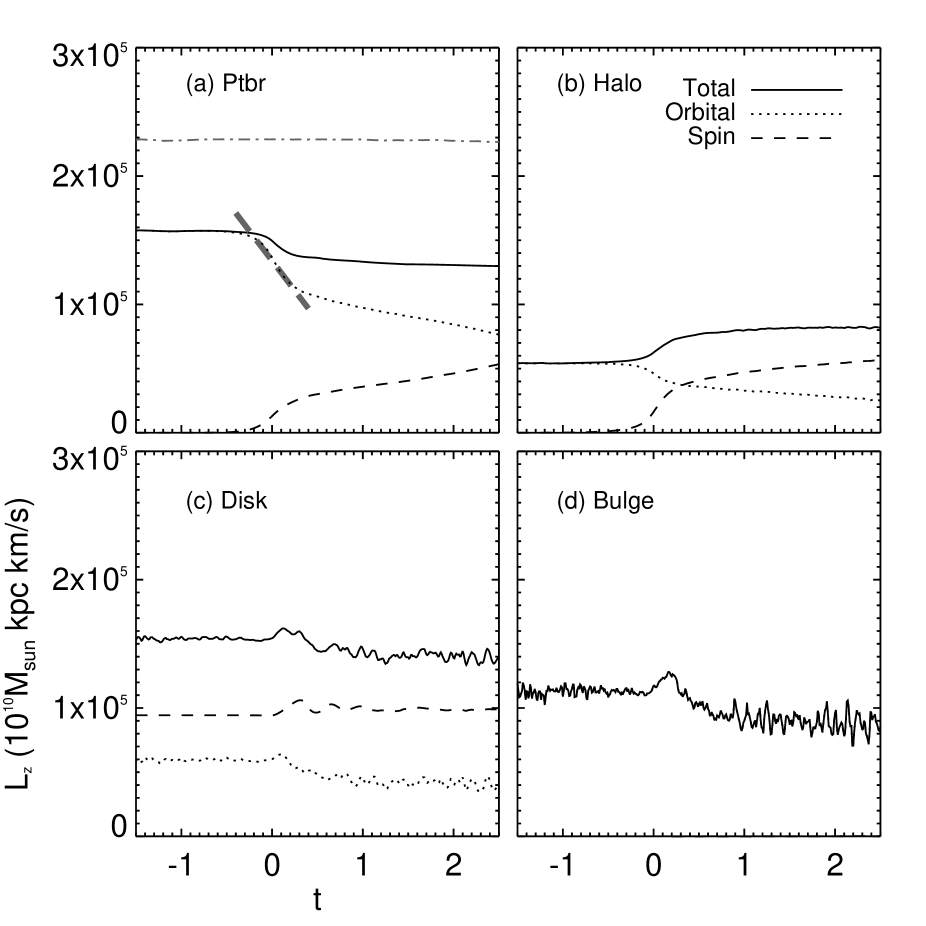
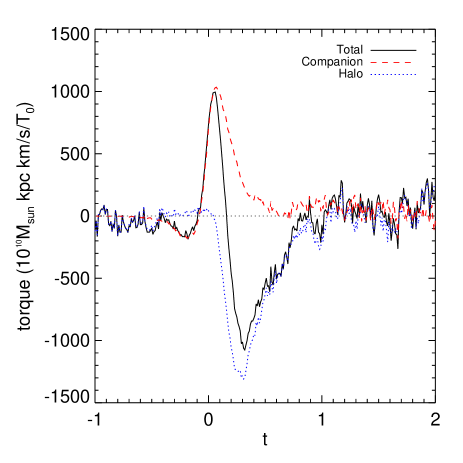
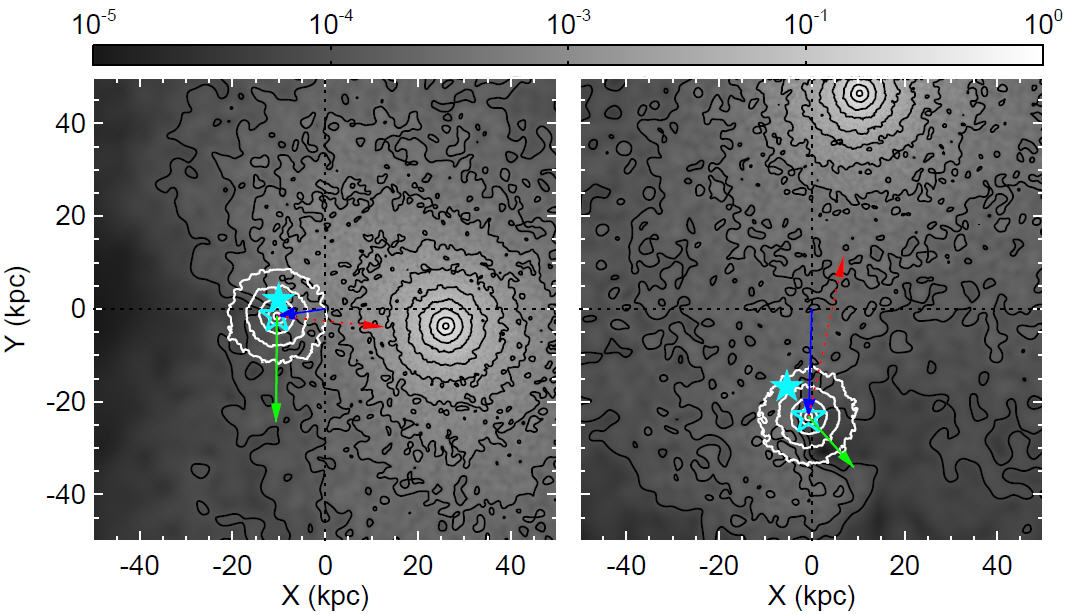
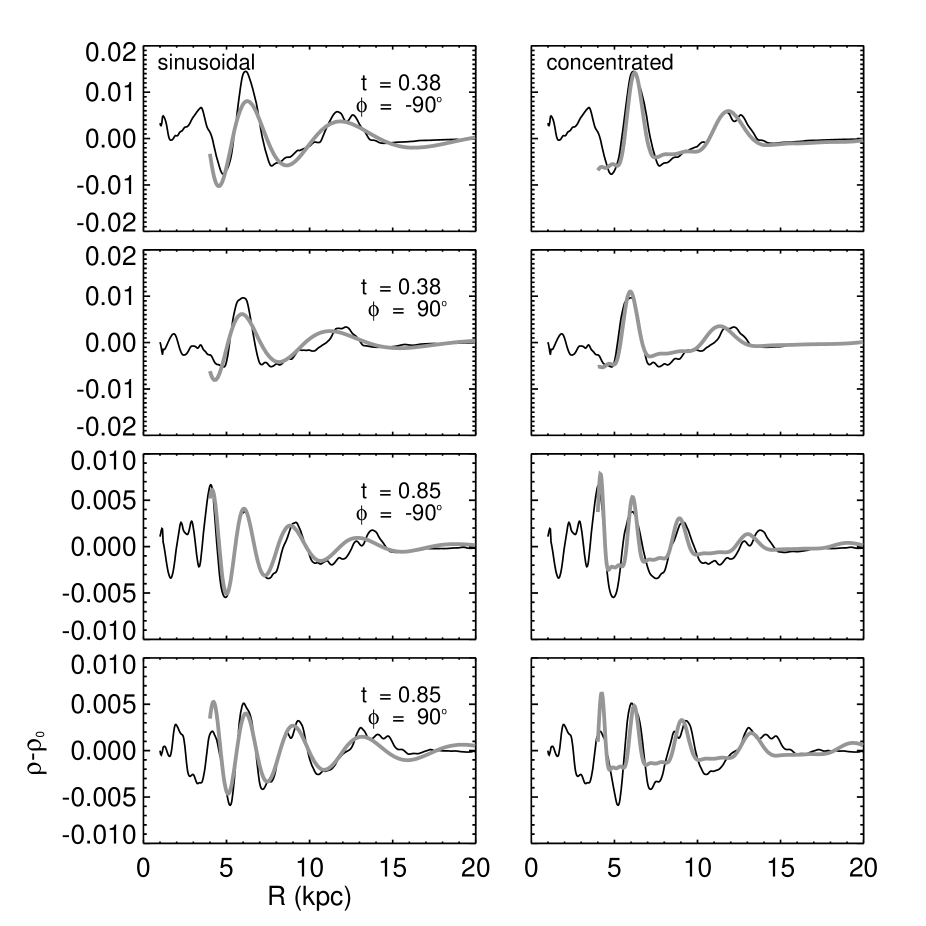
Figure 13 plots as solid lines as a function of along the cuts with for model TA2H in the midplane. The top and second rows are at , while the third and bottom rows are at . The thin solid lines give the simulation results, while the thick grey lines draw the best fits using Equation (10) based on the sinusoidal arms (left panels) and the concentrated arms (right panels). The fact that Equation (10) describes the arm positions represented by the over-densities fairly well implies that the spiral arms are closely logarithmic in shape. Overall, the concentrated arms fit the radial arm structure better at when the arms are strong with , whereas the sinusoidal arms provide a better fit at when the arms are weak with . We note however that these fits are reasonably good only at and fail at smaller . This is expected from the fact that the tidally-driven arms do not decline monotonically with but are peaked at (see Fig. 7), while Equation (10) requires arms to decay exponentially in the radial direction over all radii.
5. Orbital Decay
As Figure 2 shows, the actual trajectories of the primary and companion galaxies during the tidal encounter deviate from those under the assumption of the rigid halos. The discrepancy is due to dynamical friction occurring when two galaxies overlap at least partly. As the companion enters the primary halo, the former creates a density wake in the latter that in turn exerts gravitational drag force on the former. The drag force removes the orbital angular momentum from the companion, decreasing the pericenter distance. The orbital angular momentum extracted from the companion is transferred to the spin angular momentum of the primary halo. A similar process also occurs when the primary enters the companion halo, which results in the angular momentum transfer from the orbit of the primary to the spin of the companion.
To quantify the amount of the angular momentum transfer, Figure 14 plots the temporal variations of the -component of the angular momenta of all the components as functions of time. In each panel, the solid line draws the net (orbital plus spin) angular momentum, while the dotted and dashed lines give the orbital and spin angular momenta defined, respectively, by
| (12) |
and
| (13) |
where is the total mass, is the position vector of the center of mass, and is the mean velocity of each component, measured in the center-of-mass frame of the whole system. The dot-dashed line in Figure 14(a) plots the total angular momentum of the whole system, showing that it is conserved within 3% throughout the entire evolution. Initially, all the components except the disk do not spin, and their angular momenta are dominated by the orbital motions. As the primary and companion approach the pericenter, they start to experience dynamical friction, and the primary halo and the companion begin to continuously acquire the spin angular momentum at the expense of the orbital angular momentum.
In order to check if the decrease in the orbital angular momentum of the companion is really caused by dynamical friction due to the primary halo, we use the Chandrasekhar (1943) formula for the drag force
| (14) |
where is the average density of the halo, is the relative speed of the companion, , with denoting the mean velocity dispersion of halo particles, and is the Coulomb logarithm introduced to avoid a singularity in the force evaluation, with and representing the maximum and minimum impact parameters of the background particles, respectively. For orbital decay of a satellite galaxy in a dark matter halo, Equation (14) matches the numerical results provided is taken to be of order of the orbital radius of the halo, and with being the half-mass radius (e.g., Lin & Tremaine 1983; Weinberg 1986). To apply Equation (14) to model TA2H at , we calculate the mean density of the halo as , where and denote the position vectors of the halo and the companion, respectively. The velocity of the primary relative to the halo is . With and , . The resulting torque on the companion is given by
| (15) |
which is plotted as a thick solid line in Figure 14(a), in fairly good agreement with the instantaneous decreasing rate of the orbital angular momentum of the companion. This validates that dynamical friction is indeed a primary cause of the angular momentum transfer in our numerical simulations.
A close inspection of Figure 14 reveals that while the orbital angular momenta of the halo and companion decrease monotonically with time, those of the disk and bulge stay almost constant at , increase slightly for , and subsequently decrease slowly. This indicates that the disk and bulge experience positive torque temporarily near the pericenter, while the halo and companion always receive negative torque. To analyze what causes this unexpected behavior of the angular momenta of the disk and bulge, Figure 15 plots as dashed and dotted lines the torques exerted on the disk/bulge due to particles in the companion and the halo, respectively. It is apparent that the torque by the companion is overall positive, while the halo gives a negative torque to the disk/bulge. The resultant net torque, shown as the solid line, is positive for , which boosts the orbital motion of the disk/bulge system.
To understand why the companion torque is positive, Figure 16 plots the density distributions of the companion (gray scale with black contours) and the disk and bulge of the primary (white contours) at (left) and (right) of model TA2H in the orbital plane. The contour levels decrease by a factor of starting from the innermost level of for both companion and disk/bulge. Note a clear density wake in the companion formed at near due to the primary. The filled and open star symbols in cyan mark the centers of mass of the halo and disk/bulge of the primary, respectively, while the arrows in green indicate the velocity vectors of the disk/bulge in the center of mass frame of the whole system.
The dynamical friction of the primary due to the companion is stronger for the (outer) halo than the disk/bulge owing to proximity to the companion. This causes the halo to move slower than the rest of the primary galaxy, gradually making them displaced from each other. At , the center of mass of the disk/bulge is entering the third quadrant and moving in the negative- direction, while that of the halo is still in the second quadrant. At this time, the position vector of the bulge, indicated by the blue arrow, is inclined to the line connecting the centers of mass of the disk/bulge and the companion (the red dotted arrow). In such a geometrical configuration, the companion pulls the disk/bulge forward by providing a positive torque, while the halo tends to slow them down. It turns out that the positive torque is stronger than the gravitation pull by the halo at this time, as Figure 15 shows. The net effect is that the separation between the centers of mass of the disk/bulge and the halo increases at a faster rate. The positive torque becomes strongest when the companion is closest to the disk/bulge, and then decreases as the companion moves away. At , the positive torque by the companion is smaller than the negative torque by the halo. The disk/bulge is subsequently pulled back to, and moves in phase with, the halo after .
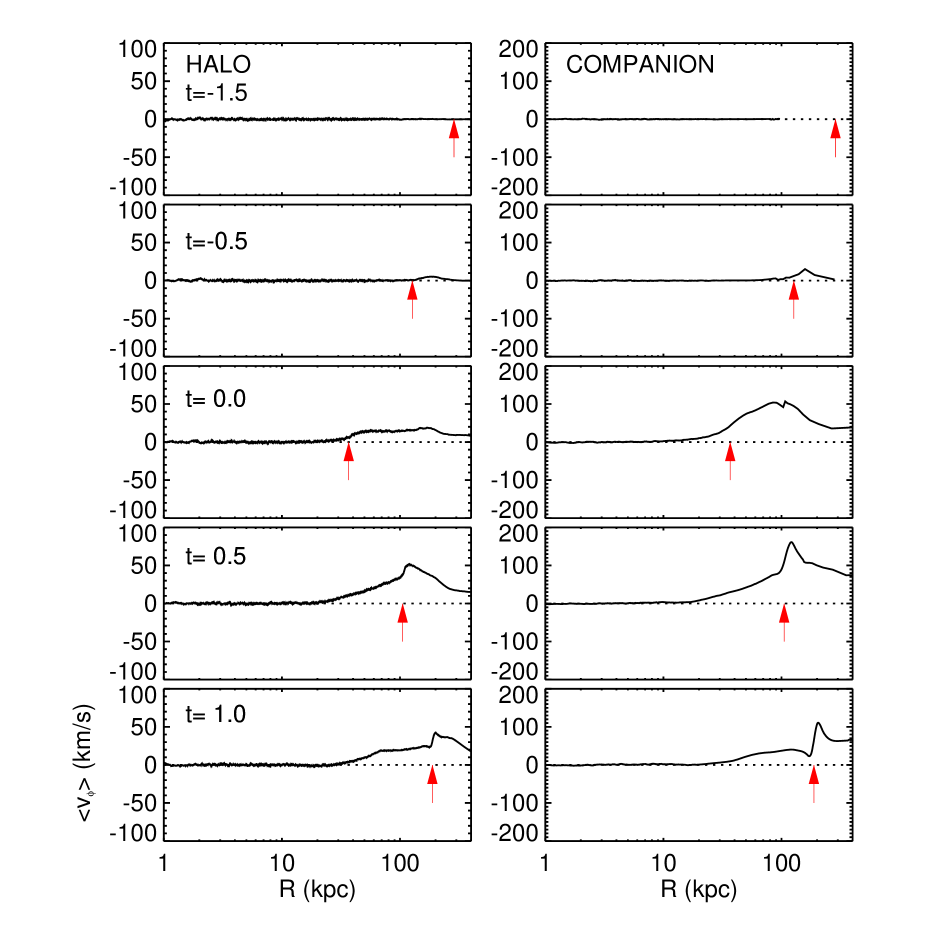
Does the dynamical friction between two galaxies really transfer the orbital angular momentum of one galaxy to the spin angular momentum of the other? Figure 17 plots the temporal changes of the axially-averaged rotation velocities of the halo (left) and companion (right). The vertical arrow in each panel marks the position of the companion and the primary in the left and right panels, respectively. Initially (), they are non-rotating, spherical, and about apart. As the center of the companion (halo) moves through the outer parts of the primary halo (companion), it creates a density wake in the halo (companion) that pulls it backward. At the same time, the wake in the halo (companion) is pulled forward by the companion (halo), acquiring positive rotational velocities as shown in Figure 17. The mass-weighted mean rotational velocities of the companion and the halo at is and , respectively. This suggests that tidal interactions can be a source of the spin angular momentum of a dark matter halo that might be non-rotating when it first formed.
6. SUMMARY & DISCUSSION
6.1. Summary
Using self-consistent, 3D -body simulations, we have investigated the physical properties of tidal features induced in a disk galaxy interacting with its companion. The disk galaxy consists of a halo, a bulge, and a stellar disk, corresponding to Milky-Way type galaxies, all of which are represented by live particles. The perturbing companion is simplified by a live halo alone. This work is a straightforward extension of Paper I that considered a 2D, razor-thin disk residing within a fixed halo. We do not consider the effect of the gaseous component in the present work. By varying the companion mass and the pericenter distance, we explore the intermediate and weak interaction regimes with the strength parameter of or (see Eqs. [5] and [6] for the definitions of and ). We analyze the properties of tidal tails formed in outer regions, and spiral arms in the inner regions, and study their dependence on and . We also study the 3D density structures of spiral arms as well as the orbital decay of the galaxies caused by dynamical friction occurring during a tidal encounter. The main results of this work can be summarized as follows.
-
1.
The tidal force from the companion excites epicycle motions in the outer regions of the primary, forming a bridge at the near side and an extended tail at the far side for interactions with or : tidal forcing weaker than this is unable to produce a tidal tail. The tail formation time, pitch angle, and surface density measured at scale as , , and in terms of , and , , and in terms of . This is in good agreement with the 2D results of Paper I, although the 2D tails are slightly stronger than the 3D counterparts, due to stronger gravity in the disk midplane. We also find that the tail response defined by the fraction of the disk particles consisting of a tail at has an excellent correlation with as .
-
2.
The tidal force also excites two-armed spiral density waves over a range of radii in the inner parts of the disk. We calculate the spatial and temporal dependence of the arm strength defined by the ratio of the maximum gravitational force due to the modes to the centrifugal force of disk rotation (Eq. [7]). For intermediate tidal interactions with (or ), the arms are strongest at –, while weak interaction models with (or ) have the arms induced at –. The spiral arms are stronger in models with larger or , with the peak arm strength given by or . The spiral arms are approximately logarithmic in shape, with a pitch angle when the arms are strongest. After the peak, the arms decay with a timescale of , and wind out as . The derived arm pattern speed is a decreasing function of and becomes close to the curve at late time. This suggests that the induced spiral arms are kinematic density waves modified weakly by self-gravity. Compared to the 2D counterparts, arms in 3D models are weaker, have a smaller pitch angle, and wind and decay more rapidly with time, due to weaker gravity.
-
3.
When compared with the analytic expression of Cox & Gómez (2002), the 3D density structure of tidally-induced, arms can be reasonably well described by the concentrated arms when the arms are in the nonlinear regime with . On the other hand, arms in the linear regime with are better fitted by the sinusoidal model. The perturbed density in the arm regions follows the characteristic profile along the vertical direction, with the scale height not much different from that of the initial disk.
-
4.
The halos of the primary and companion become partially overlap in the course of a tidal encounter. This creates gravitational density wakes in the halos, resulting in dynamical friction. The dynamical friction has a few notable effects. First, it transports the orbital angular momentum of one galaxy to the spin angular momentum of the halo of its companion, making the pericenter distance smaller than that under the rigid halos. Second, the initially rotation-free halos achieve the mass-weighted rotational velocities amounting to and for the primary and companion, respectively. Third, the dynamical friction is stronger for the halo, causing offsets between the centers of mass of the halo and disk/bulge of the primary. Thus, the disk/bulge can temporarily gain angular momentum by a positive torque from the companion near the pericenter, although they are later pulled back to the center of mass of the halo as the companion moves away.
6.2. Discussion
Tidal interaction of a galaxy with its companion in a prograde orbit is studied using fully consistent -body models. We find that the physical properties of the tidally-induced nonaxisymmetric features are tightly correlated with the interaction strength parameters and . These correlations are in qualitative agreement with those from the 2D results presented in Paper I, although the structures in the 3D models are generally weaker and decay more rapidly. These are also qualitatively consistent with the results of Elmegreen et al. (1991) who described in terms of the formation criteria of the outer disk features such as double arms corresponding to spiral arms decoupling from the tidal tail. Byrd & Howard (1992) similarly found that the tidal strength determines the strength of grand-design spiral arms in interacting galaxies. Overall, is a better parameter for characterizing tidal tails formed in the outer regions, while spiral arms induced in the inner regions are better correlated with .
Strength and shapes of tidal tails have been used to constrain the masses of dark halos (e.g., Faber & Gallagher 1979). Using numerical simulations, Dubinski et al. (1996) found that a tidal tail becomes shorter and less massive as the mass and size of a dark halo increase due to a shorter interaction time as well as a deeper potential well (e.g., White 1982). More quantitatively, Mo et al. (1998) suggested as an indicator of the susceptibility of a disk galaxy to the tail formation, where and refer to the escape and circular velocities at , respectively. Note that measures the depth of the halo potential relative to the specific kinetic energy of the disk. Using galaxy models with , Springel & White (1999) showed that the maximum tidal response described in Section 3.1 is inversely proportional to . They argued that tidal forcing produces a tail with a substantial amplitude only when in their models. Dubinski et al. (1999) conducted an extensive survey of galaxy collisions, and confirmed that is really a governing parameter and must be less than for the tail formation.
Our primary galaxy has , corresponding to the lower end in the models of Springel & White (1999) (see their Figure 10). Based on the results of Springel & White (1999) and Dubinski et al. (1999), therefore, one can naturally expect strong tidal tails produced in all of our simulations. However, it turns out that a tail is absent in model TB3 with , while all the other models with do produce a tail with strength depending on . Model TB3 has a very weak tidal response at from particles captured by the companion, even if it is more prone, in terms of , to the tail formation than any model of Springel & White (1999). This suggests that the tail formation should depend not only on but also on the interaction strength. Our numerical results imply that a criterion for producing a tidal tail is (or ) for . The critical values of and would increase with increasing , since it would then become increasingly difficult to make disk particles climb out of the halo potential well.
We found that spiral arms induced by a tidal encounter are approximately logarithmic, consistent with many of observed grand-design spirals including M51 (e.g., Kennicutt, 1981; Elmegreen et al., 1989; Patrikeev et al., 2006; Shetty et al., 2007). In our models, a logarithmic shape results from the fact that the spiral arms in the present simulations are close to kinematic density waves, slightly modified by self-gravity, for which the pitch angle varies with time and space as
| (16) |
(e.g., Eq. (6.26) of Binney & Tremaine 2008). The rotation curve of our galaxy model shown in Figure 1 gives at where arms are induced, making roughly constant over . This predicts that kinematic density waves wind out with time as when self-gravity is neglected. Since for galactic disks, this also predicts that is smaller for larger , consistent with the observational results that the arm pitch angle has a negative correlation with the shear rate (e.g., Seigar et al. 2005, 2006, 2014). Our results show that self-gravity reduces the arm-winding rate to , although it is not strong enough to maintain the arms quasi-steady. This holds even in 2D models with overestimated self-gravity at the disk midplane (Paper I).
Another prediction of kinetic density waves is that the arm pattern speed is not strictly constant over the radius but a decreasing function of . Indeed, Westpfahl (1998) found that the pattern speed of the arms in M81 interacting with NGC 3077 is best described by – based on the Tremaine & Weinberg (1984) method, after taking allowance for the radial variation of . Meidt et al. (2013) applied a similar method to M51 in obvious interaction with NGC 5195, and found that the arms consist of multiple patterns with larger pattern speeds at smaller radii (see also Meidt et al. 2008a, b), although it is questionable whether they are really multiple patterns with different pattern speeds or a single pattern with radially-varying . Realistic interaction models of Salo & Laurikainen (2000b) for the M51/NGC 5195 pair also predict close to the curve over a range of radii where the arms are strong. It is interesting to note the spiral arms in the isolated galaxy NGC 1068 have a pattern speed that decreases steeply with , indicative of a short lifetime of order of (Speights & Westpfahl 2011; see also Speights & Westpfahl 2012). All of these suggest that arms in real spiral galaxies are more likely transient rather than possessing the characteristics of quasi-stationary density waves unless the disks are strongly self-gravitating.
While we employ very simple galaxy models for tidal interactions, our models can well be applied to the M51/NGC 5195 system that have the mass ratio of – (e.g., Smith et al. 1990) and a pericenter distance of – (e.g., Salo & Laurikainen 2000a), corresponding to models TA1 and TA2. As Figure 7 shows, the arm strength is maximized after the pericenter passage. Lee et al. (2005) found observationally that the age distribution of star clusters in the arms of M51 has a narrow peak at – and a broad peak at –. If the enhanced star formation is really triggered by tidal effects, the M51/NGC 5195 pair might have undergone double interactions, the first one – ago and the second one – ago (Salo & Laurikainen, 2000a), considering the time delay between the arm formation and the closest approach. The peak arm strength in models TA1 and TA2 is , consistent with the radially averaged value of from -band observations (e.g., Rix & Rieke 1993; Rix & Zaritsky 1995; Salo & Laurikainen 2000b; Scoville et al. 2001). The arm pitch angle at peak is in models TA1 and TA2 (Figure 10), which is also consistent with the observed pitch angle of (e.g., Shetty et al. 2007; Fletcher et al. 2011; Hu et al. 2013; Puerari et al. 2014). Based on our numerical results, the stellar spiral arms in M51 are in the nonlinear regime and their 3D density structure may be described by the concentrated arm model of Cox & Gómez (2002).
By analyzing the properties of spiral arms in the Spitzer Infrared Nearby Galaxies Survey, Kendall et al. (2015) very recently found that spiral morphology depends only weakly on the galaxy properties, while the arm strength is tightly correlated with tidal forcing from nearby companions. Their Figure 17 shows that is an increasing function of , which agrees with our numerical results qualitatively, but seemingly not quantitatively. That is, of the arms in the Spitzer samples varies in the range of – for –, while our results predict – only for and no arm induced for (see also Byrd & Howard 1992). As Kendall et al. (2015) noted, this apparent quantitative discrepancy may arise because the observed values in the Spitzer samples correspond to the projected distance of a nearest neighbor at the current epoch, while in our models measures the tidal force using the 3D distance at the epoch of the pericenter passage. The projection effect overestimates the tidal forcing, while the distance at the current epoch is likely to underestimate the true significantly. For example, a comparison between Figure 17 of Kendall et al. (2015) and our Figure 9 suggests that NGC 1566 with and the current forcing estimate of might probably have undergone an interaction with its companion NGC 1581 with at the pericenter passage.
Finally, we remark on the absence of a bar in our numerical simulations. As Figures 5 and 6 show, tidal forcing in our models induces spiral structures at , while the inner regions with remain almost unaffected. This is in contrast to the results of Noguchi (1987), Gerin et al. (1990), and Mihos et al. (1997) who showed that disks subject to tidal interaction can be unstable to form a bar. The major difference between the galaxy models used by the present paper and their work is that our models possess a relatively strong bulge, while their models have no or very weak bulge. The strong bulge in our models puts an inner Lindbland resonance which suppresses feedback to swing amplification that would otherwise produce a bar near the center (Toomre, 1981). This suggests that a strong bulge may be responsible for the absence of a bar in non-barred grand design spiral galaxies.
References
- Adams et al. (1989) Adams, F. C., Ruden, S. P., & Shu, F. H. 1989, ApJ, 347, 959
- Baba et al. (2013) Baba, J., Saitoh, T. R., Wada, K. 2013, ApJ, 763, 46
- Barnes & Hut (1986) Barnes, J., & Hut, P. 1986, Nature, 324, 446
- Barnes (1992) Barnes, J. E. 1992, ApJ, 393, 484
- Barnes (1998) Barnes, J. 1998, in Galaxies: Interactions and Induced Star Formation eds. D. Friedli, L. Martinet, & D. Pfenniger (Springer: Heidelberg), 275
- Bertin & Lin (1996) Bertin, G., & Lin, C. C. 1996, Spiral Structure in Galaxies: A Density Wave Theory (Cambridge: MIT Press)
- Bertin et al. (1989a) Bertin, G., Lin, C. C., Lowe, S. A., & Thurstans, R. P. 1989a, ApJ, 338, 78
- Bertin et al. (1989b) Bertin, G., Lin, C. C., Lowe, S. A., & Thurstans, R. P. 1989b, ApJ, 338, 104
- Binney (2001) Binney, J. 2001, in Astronomical Society of the Pacific Conference Series, Vol. 230, Galaxy Disks and Disk Galaxies, ed. J. G. Funes & E. M. Corsini, 63
- Binney & Tremaine (2008) Binney, J., & Tremaine, S. 2008, Galactic Dynamics: Second Edition (Princeton University Press)
- Buta (2013) Buta R. 2013, Secular Evolution of Galaxies: XXIII Canary Islands Winter School of Astrophysics, eds. J. Falcon-Barroso, & J. Knapen (Cambridge: Cambridge University Press), p.155
- Buta & Combes (1996) Buta R., & Combes F. 1996, Fund. Cosmic Phys., 17, 95
- Byrd & Howard (1992) Byrd, G. G., & Howard, S. 1992, AJ, 103, 1089
- Chan & Junqueira (2014) Chan, R., & Junqueira, S. 2014, A&A, 567, 17
- Chandrasekhar (1943) Chandrasekhar, S. 1943, ApJ, 97, 255
- Cox & Gómez (2002) Cox, D. P., & Gómez, G. C. 2002, ApJS, 142, 261
- Cox et al. (2006) Cox, T. J., Dutta, S. N., Di Matteo, T., Hernquist, L., Hopkins, P. F., Robertson, B., & Springel, V. 2006, ApJ, 650, 791
- Davis et al. (2012) Davis B. L., Berrier J. C., Shields D. W., et al. 2012, ApJS, 199, 33
- Dobbs & Baba (2014) Dobbs, C., & Baba, J. 2014, PASA, 31, 35
- Dobbs & Bonnell (2006) Dobbs, C. L., & Bonnell, I. A. 2006, MNRAS, 367, 873
- Dobbs et al. (2006) Dobbs, C. L., Bonnell, I. A., Pringle, J. E. 2006, MNRAS, 371, 1663
- Dobbs et al. (2010) Dobbs, C. L., Theis, C., Pringle, J. E., & Bate, M. R. 2010, MNRAS, 403, 625
- D’Onghia et al. (2013) D’Onghia, E., Vogelsberger, M., Hernquist, L. 2013, ApJ, 766, 34
- Donner & Thomasson (1994) Donner, K. J., & Thomasson, M. 1994, A&A, 290, 785
- Donner et al. (1991) Donner, K. J., Engstrom̈, S., & Sundelius, B. 1991, A&A, 252, 571
- Dubinski et al. (1996) Dubinski, J., Mihos, J. C., & Hernquist, L. 1996, ApJ, 462, 576
- Dubinski et al. (1999) Dubinski, J., Mihos, J. C., & Hernquist, L. 1999, ApJ, 526, 607
- Elmegreen (1995) Elmegreen, B. G. 1995, in Molecular Clouds and Star Formation, ed. C. Yuan & J.-H. You, 149
- Elmegreen & Elmegreen (1982) Elmegreen, D. M., & Elmegreen, B. G. 1982, MNRAS, 201, 1021
- Elmegreen & Elmegreen (1986) Elmegreen, B. G., & Elmegreen, D. M. 1986, ApJ, 311, 554
- Elmegreen & Elmegreen (1987) Elmegreen, B. G., & Elmegreen, D. M. 1987, ApJ, 314, 3
- Elmegreen et al. (1989) Elmegreen, B. G., Seiden, P. E., & Elmegreen, D. M. 1989, ApJ, 343, 602
- Elmegreen et al. (1991) Elmegreen, D. M., Sundin, M., Sundelius, B., & Elmegreen, B. 1991, A&A, 244, 52
- Elmegreen et al. (2011) Elmegreen, D. M., Elmegreen, B. G., Yau, A., Athanassoula, E., Bosma, A. et al. 2011, ApJ, 737, 32
- Faber & Gallagher (1979) Faber, S. M., & Gallagher, J. S. 1979, ARA&A, 29, 409
- Farouki & Shapiro (1982) Farouki, R. T., & Shapiro, S. L. 1982, ApJ, 259, 103
- Fletcher et al. (2011) Fletcher, A., Beck, R., Shukurov, A., Berkhuijsen, E. M., & Horellou, C. 2011, MNRAS, 412, 2396
- Foyle et al. (2010) Foyle K., Rix H.-W., & Zibetti S., 2010, MNRAS, 407, 2010
- Fujii et al. (2011) Fujii, M. S., Baba, J., Saitoh, T. R., et al. 2011, ApJ, 730, 109
- Gerin et al. (1990) Gerin, M., Combes, F., & Athanassoula, E. 1990, A&A, 230, 37
- Gerola & Seiden (1978) Gerola, H., & Seiden, P. E. 1978, ApJ, 223, 129
- Grand et al. (2012) Grand, R. J. J., Kawata D., & Cropper, M. 2012, MNRAS, 421, 1528
- Grand et al. (2013) Grand, R. J. J., Kawata D., & Cropper, M. 2013, A&A, 553, A77
- Goldreich & Lynden-Bell (1965) Goldreich, P., & Lynden-Bell, D. 1965, MNRAS, 130, 125
- Grosbl & Patsis (1998) Grosbl, P. J., & Patsis, P. A. 1998, A&A, 336, 840
- Hernquist (1990a) Hernquist, L. 1990a, ApJ, 356, 359
- Hernquist (1990b) Hernquist, L. 1990b, Dynamics and Interactions of Galaxies, ed. R. Wielen (Berlin: Springer), 108
- Hernquist (1992) Hernquist, L. 1992, ApJ, 400, 460
- Hernquist (1993) Hernquist, L. 1993, ApJS, 86, 389
- Howard & Byrd (1990) Howard, S., & Byrd, G. G. 1990, AJ, 99, 1798
- Hu et al. (2013) Hu, T., Shao, Z., & Peng, Q. 2013, ApJ, 762, 27
- Julian & Toomre (1966) Julian, W. H., & Toomre, A. 1966, ApJ, 146, 810
- Jungwiert & Palous (1994) Jungwiert, B., & Palous, J., 1994, A&A, 287, 55
- Kendall et al. (2015) Kendall, S., Clarke, C., & Kennicutt, R. C. 2015, MNRAS, 446, 4155
- Kennicutt (1981) Kennicutt, R. C., Jr. 1981, AJ, 86, 1847
- Kim et al. (2006) Kim, C.-G., Kim, W.-T., & Ostriker, E. C. 2006, ApJ, 649, L13
- Kim et al. (2010) Kim, C.-G., Kim, W.-T., & Ostriker, E. C. 2010, ApJ, in press
- Kim & Ostriker (2002) Kim, W.-T., & Ostriker, E. C. 2002, ApJ, 570, 132
- Kim & Ostriker (2006) Kim, W.-T., & Ostriker, E. C. 2006, ApJ, 646, 213
- Kim et al. (2014) Kim, W.-T., Kim, Y., Kim, J.-G. 2014, ApJ, 789, 68
- Kim & Kim (2014) Kim, Y., Kim, W.-T. 2014, MNRAS, 440, 208
- Kormendy & Kennicutt (2004) Kormendy J., & Kennicutt R. C. 2004, ARA&A, 42, 603
- Kormendy & Norman (1979) Kormendy, J., & Norman, C. A. 1979, ApJ, 233, 539
- Lee et al. (2005) Lee, M. G., Chandar, R., & Whitmore, B. C. 2005, AJ, 130, 2128
- Lin & Shu (1964) Lin, C. C., & Shu, F. H. 1964, ApJ, 140, 646
- Lin & Shu (1966) Lin, C. C., & Shu, F. H. 1966, Proceedings of the National Academy of Science, 55, 229
- Lin & Tremaine (1983) Lin, D. N. C., & Tremaine, S. 1983, ApJ, 264, 364
- Lowe et al. (1994) Lowe, S. A., Roberts, W. W., Yang, J., Bertin, G., & Lin, C. C. 1994, ApJ, 427, 184
- Martínez-García (2012) Martínez-García, E. E. 2012, ApJ, 744, 92
- McKee & Ostriker (2007) McKee, C. F., & Ostriker, E. C. 2007, ARA&A, 45, 565
- Meidt et al. (2008a) Meidt, S. E., Rand, R. J., Merrifield, M. R., Debattista, V. P., & Shen, J. 2008a, ApJ, 676, 899
- Meidt et al. (2008b) Meidt, S. E., Rand, R. J., Merrifield, M. R., Shetty, R., & Vogel, S. N. 2008b, ApJ, 688, 224
- Meidt et al. (2013) Meidt, S. E., Schinnerer, E., Garcia-Burillo, S. et al. 2013, ApJ, 779, 45
- Michikoshi & Kokubo (2014) Michikoshi, S., & Kokubo, E. 2014, ApJ, 787, 174
- Mihos & Hernquist (1994) Mihos, J. C., & Hernquist, L. 1994, ApJ, 425, L13
- Mihos et al. (1997) Mihos, J. C., McGaugh, S. S. de Blok, W. J. G. 1997, ApJ, 477, 79
- Mo et al. (1998) Mo, H. J., Mao, S., & White, S. D. M. 1998, MNRAS, 295, 319
- Mueller & Arnett (1976) Mueller, M. W., & Arnett, W. D. 1976, ApJ, 210, 670
- Naab & Burkert (2003) Naab, T., & Burkert, A. 2003, ApJ, 597, 893
- Noguchi (1987) Noguchi, M. 1987, MNRAS, 228, 635
- Oh et al. (2008) Oh, S. H., Kim, W.-T., Lee, H. M., & Kim, J. 2008, ApJ, 683, 94 (Paper I)
- Ostriker et al. (1992) Ostriker, E. C., Shu, F. H., & Adams, F. C. 1992, ApJ, 399, 192
- Patrikeev et al. (2006) Patrikeev, I., Fletcher, A., Stepanov, R., Beck, R., Berkhuijsen, E. M., Frick, P., & Horellou, C. 2006, A&A, 458, 441
- Patsis, & Grosbøl (1996) Patsis, P. A., & Grosbøl, P. 1996, A&A, 315, 371
- Patsis, Héraudeau, & Grosbøl (2001) Patsis, P. A., Héraudeau, Ph., & Grosbøl, P. 2001, A&A, 370, 875
- Puerari et al. (2014) Puerari, I., Elmegreen, B. G., & Block, D. L. 2014, AJ, 148, 133
- Pfleiderer (1963) Pfleiderer, J. 1963, ZAp, 58, 12
- Rix & Rieke (1993) Rix, H.-W., & Rieke, M. J. 1993, ApJ, 418, 123
- Rix & Zaritsky (1995) Rix, H.-W., & Zaritsky, D. 1995, ApJ, 447, 82
- Roberts (1969) Roberts, W. W. 1969, ApJ, 158, 123
- Roskar et al. (2012) Roskar, R., Debattista, V. P., Quinn, Thomas. R., & Wadsley, J. 2012, MNRAS, 426, 2089
- Salo & Laurikainen (1993) Salo, H., & Laurikainen, E. 1993, ApJ, 410, 586
- Salo & Laurikainen (2000a) Salo, H., & Laurikainen, E. 2000a, MNRAS, 319, 377
- Salo & Laurikainen (2000b) Salo, H., & Laurikainen, E. 2000b, MNRAS, 319, 393
- Scoville et al. (2001) Scoville, N. Z., Polletta, M., Ewald, S., Stolovy, S. R., Thompson, R., & Rieke, M. 2001, AJ, 122, 3017
- Seigar & James (2002) Seigar, M. S., James, P. A. 2002, MNRAS, 337, 1113
- Seigar et al. (2005) Seigar, M. S., Block, D. L., Puerari, I., Chorney, N. E., & James, P. A. 2005, MNRAS, 359, 1065
- Seigar et al. (2014) Seigar, M. S., Davis, B. L., Berrier, J., & Kennefick, D. 2014, ApJ, 795, 90
- Seigar et al. (2006) Seigar, M. S., Bullock, J. S., Barth, A. A., & Ho, L. C., 2006, ApJ, 645, 1012
- Sellwood (2000) Sellwood J. A. 2000, in Dynamics of Galaxies: from the Early Universe to the Present, ASP Conf. Series, V.197, 3
- Sellwood (2014) Sellwood J. A. 2014, RvMP, 86, 1
- Sellwood & Athanassoula (1986) Sellwood, J. A., & Athanassoula, E. 1986, MNRAS, 221, 195
- Sellwood & Carlberg (1984) Sellwood, J. A., & Carlberg, R. G. 1984, ApJ, 282, 61
- Shetty & Ostriker (2006) Shetty, R., & Ostriker, E. C. 2006, ApJ, 647, 997
- Shetty et al. (2007) Shetty, R., Vogel, S. N., Ostriker, E. C., & Teuben, P. J. 2007, ApJ, 665, 1138
- Shu et al. (1973) Shu, F. H., Milione, V., & Roberts, W. W., Jr. 1973, ApJ, 183, 819
- Sleath & Alexander (1995) Sleath, J. P., & Alexander, P. 1995, MNRAS, 275, 507
- Sleath & Alexander (1996) Sleath, J. P., & Alexander, P. 1996, MNRAS, 283, 358
- Smith et al. (1990) Smith, J., Gehrz, R. D., Grasdalen, G. L., Hackwell, J. A., Dietz, R. D., & Friedman, S. D. 1990, ApJ, 362, 455
- Speights & Westpfahl (2011) Speights, J. C., & Westpfahl, D. J. 2011, ApJ, 736, 70
- Speights & Westpfahl (2012) Speights, J. C., & Westpfahl, D. J. 2012, ApJ, 752, 52
- Springel et al. (2005) Springel, V., Di Matteo, T., & Hernquist, L. 2005, MNRAS, 361, 776
- Springel & White (1999) Springel, V., & White, S. D. M. 1999, MNRAS, 307, 162
- Springel et al. (2001) Springel, V., Yoshida, N., & White, S. D. M. 2001, NewA, 6, 79
- Struck (1990) Struck-Marcell, C. 1990, AJ, 99, 71
- Struck et al. (2011) Struck, C., Dobbs, C. L., & Hwang, J.-S. 2011, MNRAS, 411, 2498
- Sundelius et al. (1987) Sundelius, B., Thomasson, M., Valtonen, M. J., & Byrd, G. G. 1987, A&A, 174, 67
- Toomre (1969) Toomre, A. 1969, ApJ, 158, 899
- Toomre (1981) Toomre, A. 1981, in Structure and Evolution of Normal Galaxies, ed. S. M. Fall & D. Lynden-Bell, 111
- Toomre & Toomre (1972) Toomre, A., & Toomre, J. 1972, ApJ, 178, 623
- Tremaine & Weinberg (1984) Tremaine, S., & Weinberg, M. D. 1984, ApJ, 282, L5
- Wada & Koda (2004) Wada, K., & Koda, J. 2004, MNRAS, 349, 270
- Weinberg (1986) Weinberg, M. D. 1986, ApJ, 300, 93
- Westpfahl (1998) Westpfahl, D. J. 1998, ApJS, 115, 203
- White (1982) White, S. 1982, in The Morphology and Dynamics of Galaxies, ed. L. Martinet & M. Mayor (Sauverny: Geneva Obs.), 289