AGN Reverberation Mapping
Abstract
Reverberation mapping is now a well-established technique for investigating spatially-unresolved structures in the nuclei of distant galaxies with actively-accreting supermassive black holes. Structural parameters for the broad emission-line region, with angular sizes of microarcseconds, can be constrained through the substitution of time resolution for spatial resolution. Many reverberation experiments over the last 30 years have led to a practical understanding of the requirements necessary for a successful program. With reverberation measurements now in hand for 60 active galaxies, and more on the horizon, we are able to directly constrain black hole masses, derive scaling relationships that allow large numbers of black hole mass estimates throughout the observable Universe, and begin investigating the detailed geometry and kinematics of the broad line region. Reverberation mapping is therefore one of the few techniques available that will allow a deeper understanding of the physical mechanisms involved in AGN feeding and feedback at very small scales, as well as constraints on the growth and evolution of black holes across cosmic time. In this contribution, I will briefly review the background, implementation, and major results derived from this high angular resolution technique.
1 Introduction and Motivation
In the 25 years that the Hubble Space Telescope has been in low Earth orbit, there have been leaps and bounds in our understanding of many astrophysical phenomena, not the least of which are supermassive black holes. Dedicated ground-based programs coupled with the exquisite spatial resolution afforded by HST have led to the now-common understanding that massive galaxies host supermassive black holes in their cores (see the review by Ferrarese & Ford 2005). In general, studies have shown that more massive galaxies host more massive black holes, which is interpreted as a symbiosis between galaxies and black holes in which they grow together and regulate each other’s growth. Recent studies have begun to find several galaxies that do not appear to follow this simple scaling relationship, however, and our picture of galaxy and black hole co-evolution throughout the Universe’s history is becoming more complicated (see the review by Kormendy & Ho 2013).
The active galactic nucleus, or AGN, phase is now understood to be a sporadic event in the life of a typical supermassive black hole, thought to be triggered by a merger or secular process in the host galaxy (see the review by Heckman & Best 2014 and references therein). During this phase, the black hole is accreting at a relatively high rate, and the accretion process is releasing large amounts of energy across the electromagnetic spectrum. The lifetime of a typical AGN event for a typical black hole is small compared to the age of the Universe, and is generally thought to be on the order of years (e.g., Kelly et al. 2010). Cosmic downsizing is observed in AGNs as it is in galaxies: the bright quasars we see in the early Universe are associated with massive black holes and large accretion rates, while today’s active black holes tend to be fewer in number, less massive, and have smaller accretion rates (e.g., Ueda et al. 2003, 2014; Shankar et al. 2009; Kelly et al. 2010; Kalfountzou et al. 2014).
Unfortunately, the rarity of bright AGNs compared to the plethora of galaxies hosting quiescent black holes today leads to the situation in which we find ourselves, where AGNs are generally distant and difficult to study even with the pristine spatial resolution afforded by HST. The techniques that have been developed to constrain the masses of inactive black holes in nearby galaxies rely on spatially resolving the innermost parsecs of a galactic nucleus, so they are limited to distances Mpc and therefore not applicable to most AGNs. And yet AGNs act as beacons that shine across the entire observable Universe, tempting us to try to understand black hole and galaxy growth and evolution out to (Momjian et al., 2014) and perhaps beyond.
Luckily, AGNs are not only bright, they are also highly variable. We can, in effect, substitute time resolution for spatial resolution in a technique known as reverberation mapping (Blandford & McKee 1982; Peterson 1993) to probe microarcsecond scales in the nuclei of even the most distant active galaxies.
2 Reverberation Mapping Primer
t]
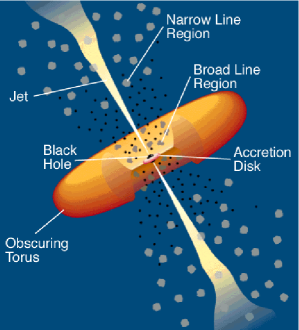
Many independent studies have led to the general picture of AGN structure that we understand today (e.g., Antonucci 1993; Urry & Padovani 1995; Peterson 1997; Netzer 2015 and references therein), as represented by the cartoon diagram in Figure 1. In the center is the supermassive black hole, with a mass in the range of M⊙, and its associated accretion disk. The jet (if the AGN has one) is perpendicular to the accretion disk and highly collimated. On larger scales ( pc for typical Seyferts, approximately the extent of the inner Oort Cloud in our own Solar System) lies a region of photoionized gas that radiates line emission. The location of this gas deep within the potential well of the black hole results in line-of-sight gas velocities that are quite large, causing the emission lines to appear Doppler broadened in the AGN spectrum by a few 1000 km s-1. We imaginatively call this region of gas the broad line region (BLR). The outer edge of the BLR is most likely set by the dust sublimation radius (e.g., Netzer & Laor 1993; Nenkova et al. 2008; Goad et al. 2012), as the inclusion of dust in the BLR gas will extinguish the line emission. The dusty gas that exists outside this radius is generally referred to as the “torus”, although the exact geometry of the region is not known. The dust torus causes the AGN system to have different spectral signatures when viewed at different orientations — a system that is close to face-on will have broad emission lines in its spectrum, while a system that is viewed edge-on will have the dust torus blocking the observer’s line of sight to the BLR, so no broad emission lines will be seen. On even larger scales (tens of pc for typical Seyferts), additional gas that is photoionized by the AGN system also exists, but the location of this gas on galactic scales results in line-of-sight velocities that are on the order of a few 100 km s-1. We see the signature of this gas as narrow emission lines in the AGN spectrum, hence the name attributed to this region of gas is the narrow line region (NLR).
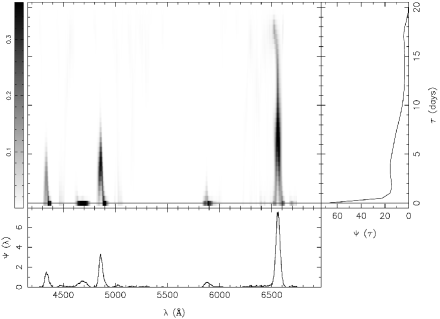
Reverberation, or “echo”, mapping measures the light travel time between different regions in an AGN system. The continuum emission is expected to arise from the accretion disk, and in the ultraviolet, optical, and near-IR it is observed to vary on timescales of hours to days. The source of this variability is not yet understood (one possible explanation is magnetic recombination in the accretion disk, e.g., Kawaguchi et al. 2000), but whatever the cause, the variations that are observed in the continuum emission are seen echoed at a later time in the fluxes of the broad emission lines (see Figure 2 for example light curves for the nearby Seyfert galaxy NGC 4151). The time delay between the variations in the continuum and the echo of those variations in an emission line is simply the average light travel time from the accretion disk to the BLR. The accretion disk is generally assumed to be very compact, and so the time delay can be interpreted as the average radius of the BLR in the AGN system. By definition, reverberation mapping requires a line of sight that permits the observer to view the broad emission lines in the AGN spectrum, so it is only applicable to AGNs with a relatively face-on orientation.

Within the BLR, different emission lines are observed to respond to continuum variations with different time delays, such that species with higher ionization potentials, like C IV , respond with a shorter time delay than those with lower ionization potentials, like H (e.g., Peterson & Wandel 2000; Kollatschny et al. 2001; Bentz et al. 2010b). This behavior points to ionization stratification within the BLR – more highly ionized line emission is radiated from a smaller radius within the BLR, while emission from more neutral gas occurs at larger radii, further from the central ionizing source. Photoionization modeling constraints agree with this interpretation: the photoionized gas in the BLR preferentially emits line emission wherever the temperature and density are most favorable for a specific atomic transition (e.g., Baldwin et al. 1995; Korista et al. 1997; Korista & Goad 2004).
With reverberation mapping, the radius we measure is the responsivity-weighted average radius, which may not exactly coincide with the emissivity-weighted average radius of the gas for that particular line emission. But the general behavior that we observe is the same: in a single AGN, if the central luminosity increases, then the time delay we measure for any specific emission line becomes larger (e.g., Peterson et al. 2002; Bentz et al. 2007; Kilerci Eser et al. 2015). It is important to keep in mind that we are not measuring a geometrical radius, such as an inner or outer boundary of the BLR, with emission-line reverberation mapping.
Even for a relatively nearby AGN, the size of the region probed by reverberation mapping is quite compact and not resolvable with current imaging technology or that which is likely to be developed in the foreseeable future. For a typical Seyfert galaxy at a distance of 40 Mpc, the time delay expected for the H emission line is light-days, which projects to an angular radius of microarcsec.
In practice, reverberation mapping relies on dense spectrophotometric monitoring of an AGN system over an extended period of time. The basic requirements for a successful monitoring program are the following:
-
1.
total campaign length at least three times the longest expected time delay to maximize the probability that varibility of a large enough amplitude will occur during the campaign (Horne et al., 2004);
-
2.
sampling cadence that is sufficiently dense to resolve the variability and expected time delays (e.g., Nyquist sampled in time);
-
3.
exposure times that yield a signal-to-noise in the continuum and substantially higher in the emission lines, where the amplitude of variability is generally only a few percent;
-
4.
spectral resolution that is sufficiently high to distinguish broad emission lines from each other and from overlapping or nearby narrow emission lines (generally of a few thousand);
-
5.
flux calibration that is good to % or better from observation to observation throughout the campaign (Peterson et al., 2004);
-
6.
strong nerves and a healthy dose of good luck.
Meeting all of these constraints with a ground-based telescope is observationally quite challenging. The weather especially can cause an otherwise well-planned reverberation campaign to not live up to its potential or to fail outright. Added to this uncertainty is the fact that AGN variations are stochastic and not guaranteed to occur during the course of a monitoring campaign for any particular AGN of interest (cf. the case of Mrk 290 which was monitored in 2007 and showed strong variations as reported by Denney et al. 2010, but according to Bentz et al. 2009b showed little to no variation when it was monitored again in 2008). The typical warning for the stock market also applies here: past performance is no guarantee of future behavior.
To date, successful reverberation campaigns have been carried out for different AGNs (Bentz & Katz, 2015). Constraints on readily-available resources have generally limited the size of the telescope used in a reverberation campaign to -m class telescopes. Coupled with the need for high signal-to-noise ratio spectra in each visit, most of these 60 AGNs are apparently bright and reside within the nearby Universe (). Reverberation mapping is not fundamentally limited to nearby objects, but the high luminosities necessary for high signal-to-noise spectra of quasars directly translates to a long emission-line time delay, which is further stretched through cosmological dilation (cf. Kaspi et al. 2007 and their monitoring campaign length of 10 years). Ongoing efforts to multiplex reverberation mapping with the Sloan Digital Sky Survey multi-object spectrograph may soon increase the sample size by a substantial fraction and push the median of the sample to somewhat larger redshifts (Shen et al., 2015), but large statistical samples of reverberation results at multiple redshifts spanning the course of cosmic history are unlikely for the forseeable future. Luckily, the results we have in hand for the current reverberation sample are able to provide us with a foothold for investigating cosmological black hole growth.
3 Reverberation Mapping Products
Substantial progress over the last 10 years especially has led to several valuable and widely used reverberation-mapping products, including direct black hole mass measurements, black hole scaling relationships that can be used to quickly estimate large numbers of black hole masses, and detailed information on the geometry and kinematics of the BLR gas. As we describe in the following sections, the first two items are fairly well-developed at this time, while we are just now beginning to truly exploit the third.
3.1 Black Hole Masses
In order to directly constrain the mass of a black hole, a luminous tracer (usually gas or stars) must be used to probe the local gravitational potential. In the case of reverberation mapping, the photoionized BLR gas is deep within the potential well of the black hole where its motion is expected to be dominated by gravity in the absence of strong radiation pressure. While the effect of radiation pressure is still debatable for lines such as C IV, these conditions are most likely to be satisfied for H (e.g., Marconi et al. 2008; Netzer 2009; Netzer & Marziani 2010) which is expected to arise from gas that is well-shielded from the central ionizing source. The Doppler-broadened width of the H emission line is therefore a measure of the line-of-sight velocity of the gas within the BLR. And, as described in Section 2, the time delay in the H emission line is a measure of the radius of the BLR for that same line-emitting gas. Coupling these two measurements together through the virial theorem allows a direct constraint on the mass of the central black hole, modulo a scaling factor to account for the detailed geometry (including inclination) and kinematics (whether rotation, infall, or outflow) of the gas.
Given the orientation-dependent picture of AGNs described above, and our inability to directly resolve the BLRs of even nearby AGNs with current technology, it is necessary to constrain the black hole mass scaling factor through some means. This is typically accomplished in an indirect way by comparing the relationship between black hole mass and host-galaxy bulge stellar velocity dispersion, the relationship, for nearby quiescent galaxies with stellar- and gas-dynamical modeling-based black hole masses to the relationship for AGNs with as-yet-unscaled reverberation masses, i.e., virial products. The average multiplicative factor that must be applied to the AGN virial products to bring the AGN relationship into agreement with that of the quescent galaxies is found to be (most recently , Grier et al. 2013a, when all AGNs are treated equally and local high-luminosity AGNs are included to extend the range of the relationship).
Certainly, there are many assumptions involved in determining this average scaling factor, and it is important to keep in mind when applying the scaling factor that it is a population average and therefore likely to be uncertain by a factor of for any individual AGN. Nonetheless, several lines of independent evidence point to this value of the mass scaling factor being in the right ballpark.
The first is to simply assume that the main contribution to the scale factor is the inclination of the system, or the term in the gas velocity. A scale factor of would imply a typical broad-lined AGN inclination of ∘, which is well in line with expectations based on our current understanding of AGN structure. Furthermore, this average inclination agrees well with the geometric inclinations derived for the extended and resolved narrow-line region structure of several nearby AGNs (Fischer et al., 2013).
t]
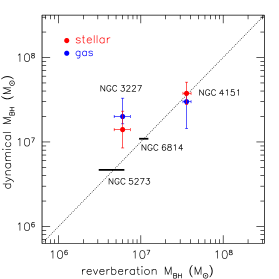
A more rigorous test is to compare the black hole masses derived from reverberation mapping with those derived from stellar- or gas-dynamical modeling in the same objects. As previously discussed, most AGNs are too far away for dynamical modeling techniques to be applied, but a few very nearby AGNs can be examined in this way. Direct comparisons have been carried out for two AGNs to date — NGC 3227 (Davies et al., 2006; Denney et al., 2010) and NGC 4151 (Onken et al., 2014) (see Figure 3). So far, the resultant black hole masses agree remarkably well between such disparate measurement techniques, each derived from independent observations and each with their own independent set of assumptions and biases. While the agreement is reassuring for these two objects, a sample of two is hardly definitive. Two more AGNs with reverberation masses — NGC 6814 (Bentz et al., 2009b) and NGC 5273 (Bentz et al., 2014) — are in various stages of the dynamical modeling process, and a handful of other AGNs are being targeted for reverberation-mapping with the hope of dynamical modeling to follow.
One current complication to this test, however, is the effect of bars on the central stellar dynamics, and therefore the derived black hole masses (e.g., Brown et al. 2013; Hartmann et al. 2014). Even for the relatively face-on galaxy NGC 4151, Onken et al. (2014) found a significant bias was induced in the best-fit black hole mass from the weak galaxy scale bar. NGC 5273 will be an especially interesting case for testing black hole masses from reverberation mapping versus stellar dynamical modeling given its unbarred S0 morphological type. Furthermore, in the next several years, it is likely that JWST will allow some advancement in the numbers of AGNs that can provide direct mass comparisons across techniques. Gültekin et al. (2009) argue that dynamical modeling can still place strong constraints on black hole mass even if the radius of influence of the black hole is not strictly resolved in the observations. JWST will provide a comparable spatial resolution for studies of host-galaxy stellar absorption features to that which is currently achieved with ground-based observatories and adaptive optics, but the advantages of JWST include a stable PSF, a significantly higher Strehl ratio, and very low backgrounds, all of which are important for deriving tight dynamical constraints on the black hole mass.
Finally, as we discuss in Section 3.3, it is possible to directly constrain the black hole mass, without needing to resort to the use of a scaling factor, from the reverberation-mapping data itself. Data quality concerns have generally not allowed this goal to be met in the past, but recent progress is encouraging, and the resultant mass constraints generally agree with our expectations based on the arguments above.
3.2 Black Hole Scaling Relationships
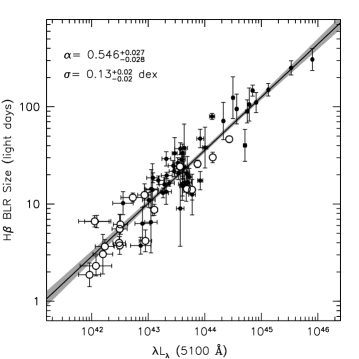
One of the most useful scaling relationships to arise from the compendium of reverberation-mapping measurements is the relationship — the relationship between the time delay, or average radius of emission, for a specific emission line and the luminosity of the central AGN at some particular wavelength. This particular scaling relationship was expected from simple photoionization arguments and looked for in the early days of reverberation mapping when the number of successful monitoring campaigns and reverberation measurements was still very small (Koratkar & Gaskell, 1991). The addition of several high-luminosity local PG quasars to the reverberation sample led to the first well-defined functional form of the relationship (Kaspi et al., 2000). Figure 4 shows the most current calibration of the relationship between H and the AGN continuum luminosity at rest-frame 5100 Å, where all luminosities have been carefully corrected for the contamination of host-galaxy starlight using high-resolution HST images and two-dimensional decompositions of the images to separate the galaxy starlight from the AGN emission (Bentz et al., 2013).
Rather than carrying out a long-term monitoring campaign for any AGN of interest, the relationship allows a single spectrum to provide an estimate of the black hole mass through two simple measurements: the width of the broad emission line as a proxy for the gas velocity, and the continuum luminosity of the AGN as a proxy for the time delay expected in the emission line. This handy shortcut provides a means for taking large spectroscopic surveys and producing catalogs full of black hole mass estimates (e.g., Shen et al. 2011). Of course, as one might expect, the devil is in the details.
Currently, H is the only emission line for which a well-calibrated relationship exists. Unfortunately, H shifts out of the observed-frame optical bandpass at redshifts of only . The Mg II and C IV emission lines in the rest-frame ultraviolet are therefore more accessible for most quasar surveys conducted from the ground. But at this time, only a handful of measurements of C IV reverberation time delays exist (see Kaspi et al. 2007 for a first attempt to constrain a C IV relationship), and even fewer reverberation measurements exist for Mg II. Quasar black hole masses therefore require bootstrapping the estimates into the UV using the H relationship as the cornerstone (e.g., Vestergaard & Peterson 2006). Furthermore, the exact prescription for turning two simple spectral measurements into an unbiased mass estimate is still highly debatable (see, e.g., Denney et al. 2009, 2013 for discussion of several of the specific details that can cause biases).
Interestingly, the small scatter in the relationship has led to the proposal that it may be used to turn AGNs into standardizable candles for investigating cosmological expansion (Watson et al., 2011; King et al., 2014). Quasars are easily observed well beyond , where Type Ia supernovae become rare and difficult to find and where the differences in cosmological models are more apparent. One of the largest practical difficulties in turning this idea into reality, however, is again the long time delays involved in monitoring high redshift quasars and the necessity of high signal-to-noise spectroscopy over the course of such a monitoring campaign.
Other black hole scaling relationships include the aforementioned AGN relationship (Onken et al., 2004; Graham et al., 2011; Park et al., 2012; Grier et al., 2013a) and the relationship between the AGN black hole mass and the host-galaxy bulge luminosity, the relationship (Wandel, 2002; Bentz et al., 2009a; Bentz, 2011). While the more commonly-used forms of these relationships tend to be those derived for black holes with dynamically-modeled black hole masses (e.g., Magorrian et al. 1998; Ferrarese & Merritt 2000; Gebhardt et al. 2000; Gültekin et al. 2009; McConnell & Ma 2013; Kormendy & Ho 2013), the AGN relationships provide a useful counterpoint given the differences between the two samples. In particular, the AGN reverberation sample has a large percentage of late-type, disk-dominated galaxies, whereas the quiescent galaxy sample with dynamical black hole masses is comprised mainly of early-type galaxies. It is not at all clear that galaxies of different morphological types should all follow the same scaling relationships (cf. the recent review by Kormendy & Ho 2013). Furthermore, active galaxies may not follow the same scaling relationships as quiescent galaxies (e.g., Wandel 1999), but most studies of galaxy and black hole co-evolution at cosmological distances are necessarily limited to active galaxies.
Even despite these differences between the samples, it appears that our current constraints on the general forms of the and relationships are consistent for AGNs with reverberation masses and for quiescent galaxies with dynamical black hole masses. Several ongoing studies aim to refine and more accurately constrain these relationships, and part of this effort is devoted to tackling the key observational uncertainties that remain — such as determining accurate distances to the AGN host galaxies, and replacing stellar velocity dispersion measurements from long-slit spectra with those obtained from integral field spectroscopy of the host galaxies. Here again, barred galaxies (and galaxies with “disky” bulges) are a source of confusion. While they are seen to be outliers in the quiescent relationship (Hu, 2008; Graham et al., 2011; Kormendy & Ho, 2013), there is no such offset seen in the AGN relationship (Grier et al., 2013a) unless it is artificially inserted by scaling the black hole masses in those galaxies by a different value (Ho & Kim, 2014). Comparisons between the different assumptions and biases in the AGN relationship versus the quiescent galaxy relationship will therefore help to shed light on the underlying causes for such puzzles. And while it has been the focus of less intense study in the last decade or so, an accurately calibrated relationship will be especially necessary for constraining galaxy evolution through upcoming deep all-sky photometric surveys with no spectroscopic component, like LSST.
3.3 BLR Geometry and Kinematics
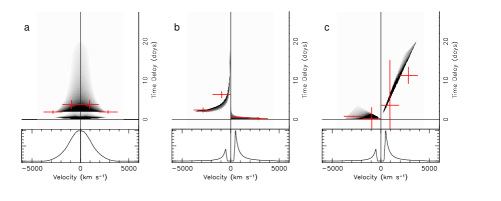
Most of the progress in reverberation mapping has focused on the lowest-order measurement that can be made, namely the average time delay of an emission line, because this is what is required to make a dynamical mass measurement. Historically, it was also the only measurement that could be recovered from the marginally-sampled light curves from early reverberation campaigns. However, there is much more information encoded in densely-sampled light curves. In particular, the emission-line light curve is a convolution of the continuum variations and the extended response of the BLR gas at different line-of-sight velocities and light travel times relative to the observer. Resolving the time delays as a function of velocity across an emission-line profile can therefore give constraints on the detailed geometry and kinematics of the BLR gas. In Figure 5, we show three examples of emission-line response given one fairly simple model for the BLR and three different possible kinematics of the gas: rotation, infall, and outflow. The differences between the three are apparent in a full deconvolution of the emission-line response (Figure 5 shaded regions), or a first-order analysis in which the mean time delays are computed for velocity bins across the line profile (Figure 5 error bars).
While the wealth of information that is potentially available from reverberation-mapping datasets has been understood for quite some time, the practical difficulties involved in deconvolving a faint signal from sparsely- and irregularly-sampled noisy data have limited much progress in this area. Notable early attempts include Wanders et al. (1995), Done & Krolik (1996), and Ulrich & Horne (1996), but recovered maps of velocity-resolved results, reminiscent of those shown in Figure 5, were ambiguous at best. In the last few years, however, reverberation programs have enjoyed much more success given the careful experimental setup and the resultant high quality of the data (Bentz et al. 2009b, 2010a; Denney et al. 2010; Grier et al. 2012; De Rosa et al. 2015).
With such high quality data now in hand, there are two general methods for extracting the reverberation signal. Deconvolution techniques can be used to produce a model-independent, but potentially difficult-to-interpret, velocity delay map like the models displayed in Figure 5. Direct modeling of the spectroscopic data, on the other hand, produces easily-interpreted constraints on different possible physical models, but is by definition model-dependent and human imagination-limited.
The most widely employed deconvolution algorithm to date is the MEMECHO code (Horne et al. 1991; Horne 1994), which uses maximum entropy balanced by to find the simplest possible solution that fits the data. Each pixel in the AGN spectrum can be treated as a separate velocity bin for which an entire light curve exists throughout the monitoring campaign. The code solves for the time delay response function in all the individual light curves for each of the pixels in the spectrum. From the many reponse functions, a map of time delay as a function of velocity is reconstructed.
Figure 6 shows an example of the deconvolved response of the broad optical recombination lines in the spectrum of the Seyfert galaxy Arp 151 (Bentz et al., 2010a). The differences in expected mean time delays for the lines is immediately apparent, and also interesting is the strong prompt response in the red wings of the Balmer lines compared to the lack of prompt response in the blue wings of those same emission lines. An asymmetric response such as this could be produced by either rotating gas with enhanced emission in one location (such as a hot spot or warp), or by infalling gas, or some combination of these simplistic models. Similar asymmetries are also seen in the deconvolved responses of a handful of additional AGNs (Grier et al., 2013b).
Direct modeling, on the other hand, tests the data against specific geometric and kinematic models to constrain the family of models that best represent the observations. For the Arp 151 dataset above, direct modeling results prefer a thick disk BLR geometry, inclined at ∘ to the observer’s line of sight, and the kinematics are dominated by inflow with some contribution from rotation (Pancoast et al., 2014), in general agreement with the interpretation of the deconvolution results. Pancoast et al. (2014) also find similar results for a few additional AGNs.
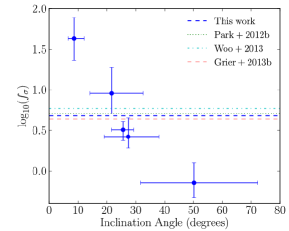
Furthermore, direct modeling is able to determine the individual scaling factor that would need to be applied to the reverberation-based black hole mass as described in Section 3.1 above. For the handful of AGNs with successful dynamical models, we can see that the scale factor indeed varies from object to object, as expected for a population of objects with random inclinations within some limited range (see Figure 7). The average of these individual scaling factors also agrees quite well with the population average derived above through use of the relationship (see Section 3.1).
t]
4 Looking Ahead
The future is looking quite busy for applications of reverberation mapping. In addition to the many ongoing areas of study summarized in the previous pages, several recent or ongoing programs, such as the multi-object SDSS reverberation program (Shen et al., 2015) and the massive HST plus ground-based reverberation program for NGC 5548 (De Rosa et al., 2015), are just starting to report results that are sure to lead to new insights and new puzzles in AGN physics. Additionally, the upcoming OzDES program (King et al., 2015) will help push to higher redshifts, providing a more stable anchor for black hole mass estimates of high- quasars.
The flurry of recent activity in velocity-resolved reverberation mapping is unlikely to abate any time soon, and here we may hope to unlock many of the secrets surrounding AGN feeding and feedback. New codes to deal with velocity-resolved reverberation mapping data are currently being developed (Skielboe et al. 2015, Anderson et al. in prep), and new features are being added to currently-existing codes (Pancoast, private communication).
With UV astronomy currently dependent on the continuation of HST, it is certainly conceivable to think that the Kronos spacecraft (Peterson et al., 2003), or a similar instrument, may again make an appearance in proposal form. It is an exciting time for supermassive black holes, reverberation mapping, and AGN physics!
Acknowledgements.
I would like to thank the conference organizers for inviting me to present this review. This work is supported by NSF CAREER grant AST-1253702.References
- Antonucci (1993) Antonucci, R. 1993, ARA&A, 31, 473
- Baldwin et al. (1995) Baldwin, J., Ferland, G., Korista, K., & Verner, D. 1995, ApJ, 455, L119
- Bentz (2011) Bentz, M. 2011, in Narrow-Line Seyfert 1 Galaxies and their Place in the Universe, 33
- Bentz et al. (2006) Bentz, M. C., Denney, K. D., Cackett, E. M., et al. 2006, ApJ, 651, 775
- Bentz et al. (2007) Bentz, M. C., Denney, K. D., Cackett, E. M., et al. 2007, ApJ, 662, 205
- Bentz et al. (2013) Bentz, M. C., Denney, K. D., Grier, C. J., et al. 2013, ApJ, 767, 149
- Bentz et al. (2014) Bentz, M. C., Horenstein, D., Bazhaw, C., et al. 2014, ApJ, 796, 8
- Bentz et al. (2010a) Bentz, M. C., Horne, K., Barth, A. J., et al. 2010a, ApJ, 720, L46
- Bentz & Katz (2015) Bentz, M. C., & Katz, S. 2015, PASP, 127, 67
- Bentz et al. (2009a) Bentz, M. C., Peterson, B. M., Pogge, R. W., & Vestergaard, M. 2009a, ApJ, 694, L166
- Bentz et al. (2009b) Bentz, M. C., Walsh, J. L., Barth, A. J., et al. 2009b, ApJ, 705, 199
- Bentz et al. (2010b) Bentz, M. C., Walsh, J. L., Barth, A. J., et al. 2010b, ApJ, 716, 993
- Blandford & McKee (1982) Blandford, R. D., & McKee, C. F. 1982, ApJ, 255, 419
- Brown et al. (2013) Brown, J. S., Valluri, M., Shen, J., & Debattista, V. P. 2013, ApJ, 778, 151
- Davies et al. (2006) Davies, R. I., Thomas, J., Genzel, R., et al. 2006, ApJ, 646, 754
- De Rosa et al. (2015) De Rosa, G., Peterson, B. M., Ely, J., et al. 2015, ApJ, in press (astro-ph/1501.05954)
- Denney et al. (2009) Denney, K. D., Peterson, B. M., Dietrich, M., Vestergaard, M., Bentz, M. C. 2009, ApJ, 692, 246
- Denney et al. (2010) Denney, K. D., Peterson, B. M., Pogge, R. W., et al. 2010, ApJ, 721, 715
- Denney et al. (2013) Denney, K. D., Pogge, R. W., Assef, R. J., Kochanek, C. S., Peterson, B. M., Vestergaard, M. 2013, ApJ, 775, 60
- Done & Krolik (1996) Done, C., & Krolik, J. H. 1996, ApJ, 463, 144
- Ferrarese & Ford (2005) Ferrarese, L., & Ford, H. 2005, SSR, 116, 523
- Ferrarese & Merritt (2000) Ferrarese, L., & Merritt, D. 2000, ApJ, 539, L9
- Fischer et al. (2013) Fischer, T. C., Crenshaw, D. M., Kraemer, S. B., & Schmitt, H. R. 2013, ApJS, 209, 1
- Gebhardt et al. (2000) Gebhardt, K., Bender, R., Bower, G., et al. 2000, ApJ, 539, L13
- Goad et al. (2012) Goad, M. R., Korista, K. T., & Ruff, A. J. 2012, MNRAS, 426, 3086
- Graham et al. (2011) Graham, A. W., Onken, C. A., Athanassoula, E., & Combes, F. 2011, MNRAS, 412, 2211
- Grier et al. (2013a) Grier, C. J., Martini, P., Watson, L. C., et al. 2013a, ApJ, 773, 90
- Grier et al. (2013b) Grier, C. J., Peterson, B. M., Horne, K., et al. 2013b, ApJ, 764, 47
- Grier et al. (2012) Grier, C. J., Peterson, B. M., Pogge, R. W., et al. 2012, ApJ, 755, 60
- Gültekin et al. (2009) Gültekin, K., Richstone, D. O., Gebhardt, K., et al. 2009, ApJ, 698, 198
- Hartmann et al. (2014) Hartmann, M., Debattista, V. P., Cole, D. R., Valluri, M., Widrow, L. M., & Shen, J. 2014, MNRAS, 441, 1243
- Heckman & Best (2014) Heckman, T. M., & Best, P. N. 2014, ARA&A, 52, 589
- Ho & Kim (2014) Ho, L. C., & Kim, M. 2014, ApJ, 789, 17
- Horne (1994) Horne, K. 1994, in Astronomical Society of the Pacific Conference Series, Vol. 69, Reverberation Mapping of the Broad-Line Region in Active Galactic Nuclei, ed. P. M. Gondhalekar, K. Horne, & B. M. Peterson, 23–25
- Horne et al. (2004) Horne, K., Peterson, B. M., Collier, S. J., & Netzer, H. 2004, PASP, 116, 465
- Horne et al. (1991) Horne, K., Welsh, W. F., & Peterson, B. M. 1991, ApJ, 367, L5
- Hu (2008) Hu, J. 2008, MNRAS, 386, 2242
- Kalfountzou et al. (2014) Kalfountzou, E., Civano, F., Elvis, M., Trichas, M., & Green, P. 2014, MNRAS, 445, 1430
- Kaspi et al. (2007) Kaspi, S., Brandt, W. N., Maoz, D., Netzer, H., Schneider, D. P., & Shemmer, O. 2007, ApJ, 659, 997
- Kaspi et al. (2000) Kaspi, S., Smith, P. S., Netzer, H., Maoz, D., Jannuzi, B. T., & Giveon, U. 2000, ApJ, 533, 631
- Kawaguchi et al. (2000) Kawaguchi, T., Mineshige, S., Machida, M., Matsumoto, R., & Shibata, K. 2000, PASJ, 52, L1
- Kelly et al. (2010) Kelly, B. C., Vestergaard, M., Fan, X., Hopkins, P., Hernquist, L., & Siemiginowska, A. 2010, ApJ, 719, 1315
- Kilerci Eser et al. (2015) Kilerci Eser, E., Vestergaard, M., Peterson, B. M., Denney, K. D., & Bentz, M. C. 2015, ApJ, 801, 8
- King et al. (2015) King, A. L., Martini, P., Davis, T. M., et al. 2015, MNRAS, submitted (astro-ph/1504.03031)
- King et al. (2014) King, A. L., Davis, T. M., Denney, K. D., Vestergaard, M., & Watson, D. 2014, MNRAS, 441, 3454
- Kollatschny et al. (2001) Kollatschny, W., Bischoff, K., Robinson, E. L., Welsh, W. F., & Hill, G. J. 2001, A&A, 379, 125
- Koratkar & Gaskell (1991) Koratkar, A. P., & Gaskell, C. M. 1991, ApJ, 370, L61
- Korista et al. (1997) Korista, K., Ferland, G., & Baldwin, J. 1997, ApJ, 487, 555
- Korista & Goad (2004) Korista, K. T., & Goad, M. R. 2004, ApJ, 606, 749
- Kormendy & Ho (2013) Kormendy, J., & Ho, L. C. 2013, ARA&A, 51, 511
- Magorrian et al. (1998) Magorrian, J., Tremaine, S., Richstone, D., et al. 1998, AJ, 115, 2285
- Marconi et al. (2008) Marconi, A., Axon, D. J., Maiolino, R., et al. 2008, ApJ, 678, 693
- McConnell & Ma (2013) McConnell, N. J., & Ma, C.-P. 2013, ApJ, 764, 184
- Momjian et al. (2014) Momjian, E., Carilli, C. L., Walter, F., & Venemans, B. 2014, AJ, 147, 6
- Nenkova et al. (2008) Nenkova, M., Sirocky, M. M., Nikutta, R., Ivezić, Ž., & Elitzur, M. 2008, ApJ, 685, 160
- Netzer (2009) Netzer, H. 2009, ApJ, 695, 793
- Netzer (2015) —. 2015, ARA&A, in press (astro-ph/1505.00811)
- Netzer & Laor (1993) Netzer, H., & Laor, A. 1993, ApJ, 404, L51
- Netzer & Marziani (2010) Netzer, H., & Marziani, P. 2010, ApJ, 724, 318
- Onken et al. (2004) Onken, C. A., Ferrarese, L., Merritt, D., et al. 2004, ApJ, 615, 645
- Onken et al. (2014) Onken, C. A., Valluri, M., Brown, J. S., et al. 2014, ApJ, 791, 37
- Pancoast et al. (2014) Pancoast, A., Brewer, B. J., Treu, T., et al. 2014, MNRAS, 445, 3073
- Park et al. (2012) Park, D., Kelly, B. C., Woo, J.-H., & Treu, T. 2012, ApJS, 203, 6
- Peterson (1993) Peterson, B. M. 1993, PASP, 105, 247
- Peterson (1997) —. 1997, An Introduction to Active Galactic Nuclei (Cambridge: Cambridge Univ. Press), 101
- Peterson et al. (2002) Peterson, B. M., Berlind, P., Bertram, R., et al. 2002, ApJ, 581, 197
- Peterson et al. (2004) Peterson, B. M., Ferrarese, L., Gilbert, K. M., et al. 2004, ApJ, 613, 682
- Peterson et al. (2003) Peterson, B. M., Polidan, R. S., & Robinson, E. L. 2003, in Society of Photo-Optical Instrumentation Engineers (SPIE) Conference Series, Vol. 4854, Future EUV/UV and Visible Space Astrophysics Missions and Instrumentation., ed. J. C. Blades & O. H. W. Siegmund, 311–318
- Peterson & Wandel (2000) Peterson, B. M., & Wandel, A. 2000, ApJ, 540, L13
- Shankar et al. (2009) Shankar, F., Weinberg, D. H., & Miralda-Escudé, J. 2009, ApJ, 690, 20
- Shen et al. (2011) Shen, Y., Richards, G. T., Strauss, M. A., et al. 2011, ApJS, 194, 45
- Shen et al. (2015) Shen, Y., Brandt, W. N., Dawson, K. S., et al. 2015, ApJS, 216, 4
- Skielboe et al. (2015) Skielboe, A., Pancoast, A., Treu, T., Park, D., Barth, A. J., & Bentz, M. C. 2015, MNRAS, submitted (astro-ph/1502.02031)
- Ueda et al. (2014) Ueda, Y., Akiyama, M., Hasinger, G., Miyaji, T., & Watson, M. G. 2014, ApJ, 786, 104
- Ueda et al. (2003) Ueda, Y., Akiyama, M., Ohta, K., & Miyaji, T. 2003, ApJ, 598, 886
- Ulrich & Horne (1996) Ulrich, M.-H., & Horne, K. 1996, MNRAS, 283, 748
- Urry & Padovani (1995) Urry, C. M., & Padovani, P. 1995, PASP, 107, 803
- Vestergaard & Peterson (2006) Vestergaard, M., & Peterson, B. M. 2006, ApJ, 641, 689
- Wandel (1999) Wandel, A. 1999, ApJ, 519, L39
- Wandel (2002) —. 2002, ApJ, 565, 762
- Wanders et al. (1995) Wanders, I., Goad, M. R., Korista, K. T., et al. 1995, ApJ, 453, L87
- Watson et al. (2011) Watson, D., Denney, K. D., Vestergaard, M., & Davis, T. M. 2011, ApJ, 740, L49