Hubble Tarantula Treasury Project: Unraveling Tarantula’s Web. II. Optical and Near Infrared Star Formation History of the Starburst Cluster NGC 2070 in 30 Doradus
Abstract
We present a study of the recent star formation of 30 Doradus in the Large Magellanic Cloud (LMC) using the panchromatic imaging survey Hubble Tarantula Treasury Project (HTTP). In this paper we focus on the stars within 20 pc of the center of the massive ionizing cluster of 30 Doradus, NGC 2070. We recovered the star formation history by comparing deep optical and NIR color-magnitude diagrams (CMDs) with state-of-the-art synthetic CMDs generated with the latest PARSEC models, which include all stellar phases from pre-main sequence to post-main sequence. For the first time in this region we are able to measure the star formation using intermediate and low mass stars simultaneously. Our results suggest that NGC2070 experienced a prolonged activity. In particular, we find that the star formation in the region: i) exceeded the average LMC rate Myr ago; ii) accelerated dramatically Myr ago; and iii) reached a peak value 1-3 Myr ago. We did not find significant deviations from a Kroupa initial mass function down to 0.5 M⊙. The average internal reddening E(BV) is found to be between 0.3 and 0.4 mag.
1 Introduction
The Large Magellanic Cloud (LMC) harbors the nearest giant extragalactic H ii region (Kennicutt, 1991), the Tarantula Nebula (30 Doradus). The central region of the nebula is dominated by the cluster NGC 2070, a collective of several dense sub-clusters (Walborn & Blades 1997; Sabbi et al. 2012) whose light is dominated by massive OB stars. The most prominent of these sub-clusters is the very central super star cluster (SSC) R 136.
This region has a number of characteristics that make it extraordinary. First of all, it displays an extreme rate of star formation (SF), with one quarter of the total massive recent ( Myr) star formation in the LMC contained within 15′ from 30 Doradus (Kennicutt, 1991). Moreover, with a stellar mass of at least concentrated within a radius of 4.7 pc (Hunter et al., 1995), this cluster can be classified as a relatively low-mass clone of more distant starburst clusters, likely building blocks of starburst galaxies.
Over the years, there have been debates over whether or not NGC 2070 is a young analog of old globular clusters. Recent arguments seem to suggest a positive answer. Using photometry Andersen et al. (2009) found that NGC2070’s initial mass function (IMF) is Salpeter-like down to , giving the first direct evidence that solar-like stars are formed in a starburst cluster. Using multi-epoch spectroscopy of O-type stars, Hénault-Brunet et al. (2012) measured a velocity dispersion between 4 and 5 km s-1, close to the expected value if it were in virial equilibrium. In this case the velocity dispersion would be low enough to allow the cluster to stay bound.
Due to the proximity of the LMC, 30 Doradus can be imaged with the Hubble Space Telescope (HST) on scales down to pc, resolving stars down to the sub-solar regime. By coupling HST imaging with ground-based spectroscopy diagnostics, we know that the region has undergone continuous SF activity or a superposition of multiple bursts of SF. Indeed, over the whole region, there is evidence of at least three events: i) an on-going off-center activity, as documented by the presence of embedded O-type stars and luminous infrared protostars along an arc of molecular gas and warm dust around 30 Doradus (Rubio et al., 1992; Hyland et al., 1992; Walborn & Blades, 1997; Rubio et al., 1998; Walborn et al., 1999; Brandner et al., 2001); ii) a recent event, represented by the SSC R 136 itself, 2 Myr old or less, as inferred from spectroscopy of the O stars (Massey & Hunter 1998), 3-4 Myr old from HST imaging (Hunter et al. 1995); iii) an “old” event, documented by the presence of Hodge 301, a 25 Myr old cluster (Grebel & Chu 2000) located only 3 arcmin northwest of R 136.
However, most of high resolution studies are limited to a few bands and cover only small patches of the 30 Doradus complex. The Hubble Tarantula Treasury Project (HTTP; Sabbi et al. 2015, in prep.), an HST survey covering a wide area around 30 Doradus at high resolution, fills this gap. This unique data-set, which combines resolution and spatial coverage, can be exploited in varied ways, including studies of massive SF, low mass SF, the IMF, the reddening distribution, etc.. In our current paper, we take the opportunity to explore the SF during the last 50 Myr for the central 40 pc of 30 Doradus, a.k.a. the starburst cluster NGC 2070, by comparing the observational color-magnitude diagrams (CMDs) with state-of-the-art synthetic CMDs. These simulations incorporate the latest (V.1.2S) set of PAdova and TRieste Stellar Evolution Code (PARSEC) isochrones (see Bressan et al. 2012 and Tang et al. 2014), the first theoretical library to include homogeneously all stellar phases from pre-main sequence (PMS) to post-main sequence for all masses between and . For the first time, we derive the history of the region using low and intermediate mass stars, either in the PMS or main sequence (MS) phases, simultaneously. In particular, we exploit magnitudes and colors of the PMS turn ons (hereafter TOn; see Section 3), i.e. the CMD loci where the PMS phase joins to the MS. This “hook” has been demonstrated to be particularly sensitive to age (see, e.g., Stauffer 1980; Belikov et al. 1998; Baume et al. 2003; Stolte et al. 2004; Mayne 2010; Cignoni et al. 2010). We use both the optical F555W vs F555WF775W and the near infrared (NIR) F110W vs F110WF160W CMDs of the HTTP sample, which offer complementary advantages in terms of higher spatial resolution (the optical) and lower reddening sensitivity (the NIR).
To recover the SF rate of NGC 2070 since the beginning of its activity, there are three important factors that must be accounted for: differential reddening, LMC field contamination, and stellar crowding. The first causes the CMD features to appear redder and more scattered, mimicking older populations and lowering the age resolution. Field contamination mostly adds low mass stars to the sample, mimicking much older populations and a steeper IMF. Finally, stellar confusion affects completeness and, therefore, the reachable look-back time. Moreover, unaccounted incompleteness can also mimic mass segregation.
The paper is structured as follows. In Section 2 we briefly describe the observations. Section 3 is dedicated to the physics of the TOn clock. In Section 4 we identify the general properties of the stellar populations in the HTTP data-set, with special emphasis on NGC 2070. In Section 5 we perform artificial star tests, the only way to take crowding into account, and we recover the SFH of NGC 2070 using the synthetic CMD approach. Field contamination is also carefully discussed. Results are presented in Section 6 and compared to the literature in Section 7. Section 8 compares NGC 2070 with other starburst clusters. Our conclusions (Section 9) close the paper.
Throughout the paper, for the sake of simplicity, we will refer to the entire HTTP data-set as “30 Doradus”, the starburst cluster as NGC 2070 and its core as R 136.
2 Observations and Photometric Reduction
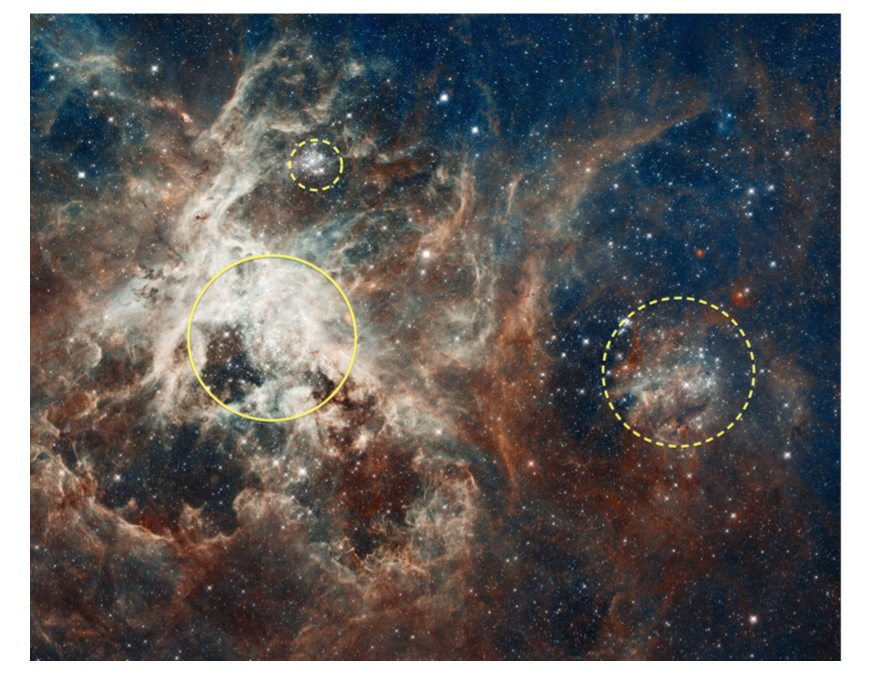
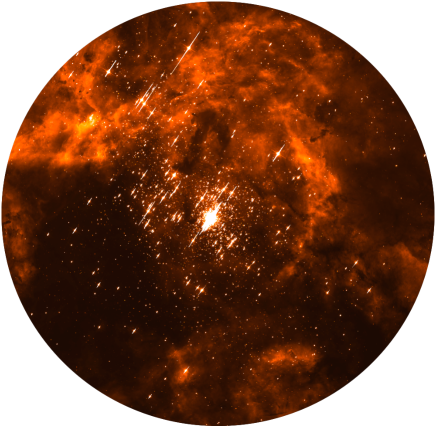
We observed 30 Doradus with the HST Wide-Field Camera 3 (WFC3) and the HST Advanced Camera for Surveys (ACS) as part of proposal GO-12939 (PI: E. Sabbi). We built this program on an existing HST monochromatic survey in the F775W filter (GO-12499, PI: Lennon), designed to measure proper motions of runaway candidates. In both data-sets we used the Wide Field Channel (WFC) of ACS in parallel with either the UVIS or the IR channels of WFC3 to maximize the efficiency of the observations. The images were taken with the filters F275W, F336W, F555W, F658N, F110W and F160W between December 2012 and September 2013. The survey utilized 60 orbits. Figure 1 shows the F775W image of 30 Doradus with indicated the major stellar concentrations, NGC 2070, Hodge 301 and NGC 2060.
Bright and faint sources are respectively identified using the packages img2xym_WFC.09x10 (Anderson & King 2006) and KS2, an evolution of the program described in Anderson et al. (2008). A detailed description of the photometric analysis can be found in Sabbi et al. (2015, in preparation).
We culled the catalog of detected objects to only include sources with
high quality in the PSF-fitting, Q. The final catalog
contains detected in the filter F275W, in F336W,
in F555W, in F658N, in
F775W, stars in F110W and in the F160W.
3 Stellar clocks: MS Turn-Off and PMS Turn-On
One of the characteristics of 30 Doradus that makes it a particularly interesting object is the high concentration of massive stars that coexist with a plethora of coeval intermediate and low mass PMS stars. This enables us to reconstruct the past history of 30 Doradus using the MS turn-off (MSTO)111Although the term MSTO refers to the end of the MS phase for stars of any mass, the reference here is to stars more massive than , whose MS evolutionary times are shorter than Myr., the locus of the CMD where MS stars exhaust their core hydrogen, and the PMS TOn, where low and intermediate mass PMS stars ignite hydrogen in their cores. In terms of stellar mass, the MSTO mass is the mass of the most massive star still on the MS at an evolutionary time corresponding to the age of the cluster, while the TOn mass is the mass of the least massive star that has reached the MS at the age of the cluster. In the following we discuss pros and cons of the two clocks.
Massive stars: The main appeal of using the MSTO of massive stars (M) stems from the high luminosity of such sources, which translates into high quality photometry and complete samples. The optical and infrared spectra of these objects are well approximated by the Rayleigh-Jeans tail of a black body with temperature Teff. Hence, given that the spectral energy distribution shape is almost unchanged as a function of wavelength, the optical and infrared colors are nearly constant (and around 0 mag). This is clearly visible in Figure 2, where we overlaid young isochrones of different ages (0.5, 1, 3, 7, 15 Myr) on to the entire HTTP catalog (shaded grey area) in the UV (left panel), optical (middle panel) and NIR (right panel) CMDs. The adopted distance modulus (mM)0 and reddening E(BV) are 18.5 (Panagia et al. 1991; Schaefer 2008; Pietrzyński et al. 2013) and 0.3 (chosen by eye based on the fit of the optical CMD), respectively. In the NIR CMD the upper MS (UMS) looks like a vertical line and isochrones of different age have MSTOs almost indistinguishable from one another. This degeneracy is attenuated in the optical and almost lifted in the UV CMD. Observationally, studies of massive stars has always been hampered by their rarity, due to the short timescales involved in their evolution and the steepness of the IMF.
On the theoretical side, models of massive stars are still affected by major uncertainties. In particular, physical mechanisms like mass loss, rotation and binary evolution are not well understood (see, e.g., de Mink et al. 2012).
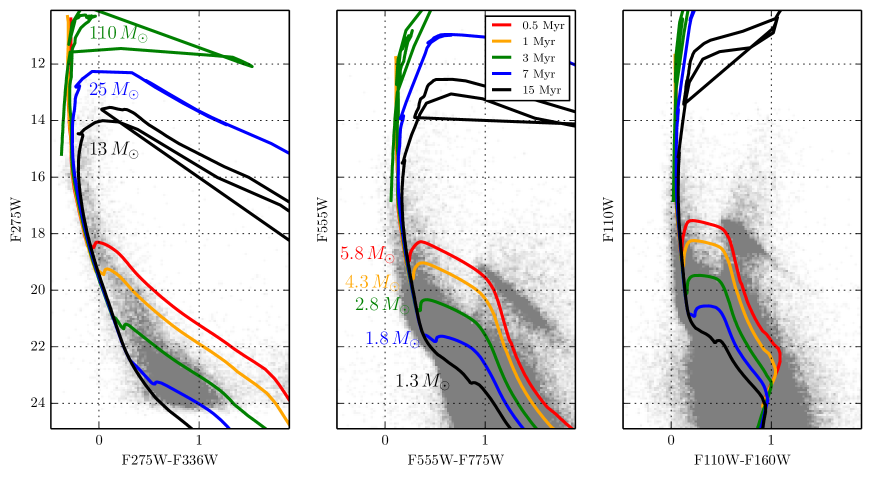
Intermediate and low mass stars: For ages younger than 20-30 Myr, the PMS TOn is another valuable stellar chronometer which involves intermediate and low mass stars instead of massive stars222Stars more massive than 6 M⊙ have no PMS phase at all.. In analogy with the MSTO, the TOn properties are directly related to the age of the stellar population, but with evolutionary times much shorter than the corresponding MS times. In fact, the age of a cluster is equal to the time spent in PMS phase by its most massive star still in PMS phase. By definition, this star is at the TOn. Hence, when the intrinsic luminosity of the TOn is detected, it is straightforward to associate it with the age of the cluster. From the CMD point of view, the potential strength of the TOn is apparent from the morphology of the isochrones in Fig. 2. In the optical and NIR CMDs the isochrone portion just before the MS has a hook and then is significantly flatter than the MS. The TOn is at the vertex of the hook, quite easy to recognize. For ages older than 2030 Myr the PMS phase is much closer to the MS and the TOn visibility declines. Theory also predicts that the PMS phase (recognizable as the portion of the isochrones at the right of the MS in Fig. 2) itself is a valuable age indicator: older PMS isochrones are fainter and closer to the MS than younger ones. However, poorly understood phenomenons like residual mass accretion and magnetic fields (whose interplay is responsible for the appearing of irregular photometric variability and UV to infrared excesses), and observational uncertainties like differential reddening from the circumstellar material can dislocate these stars (especially in the first few Myr) from their theoretical positions in the CMD (see Gouliermis 2012 for a review).
An advantage of the TOn with respect to the MSTO derives from the evolution at nearly constant luminosity of PMS stars near the MS, corresponding to an almost horizontal track in the optical and NIR CMDs. This leads to a luminosity(TOn) - age relation. On the other hand, the MS evolution of massive stars near the MSTO is rather vertical (except in the UV CMD), hence age is not uniquely related to luminosity. Among the drawbacks, the intrinsic faintness of TOns compared to the MSTOs makes TOns prone to photometric errors and incompleteness, issues that are exacerbated in the UV CMD because older TOns tend to be also redder. From the theoretical side, the TOn visibility is intimately connected with the PMS evolutionary times which are still model dependent (see, e.g., Baraffe et al. 2009; Hosokawa et al. 2011; Soderblom et al. 2014 and references therein).
In this paper we aim to study the SFH of 30 Doradus with the TOns, hence we focus our analysis on the optical and NIR CMDs. As shown in the optical CMD (middle panel of Fig. 2), the most massive star that is relevant to this study is around .
Before closing this section, we emphasize another interesting feature that emerges from Fig. 2. Whereas the isochrones reddened with E(BV)= 0.3 fit well the UMS in the optical and NIR CMDs (middle and right panel), the same isochrones are clearly too blue in the UV CMD (left panel). The explanation for this effect resides in the different populations that these CMDs trace: most of the UV stars are very young 30 Doradus stars, with minimal contamination from field stars (the RC is hardly visible at F275W), while the optical and NIR stars can be both members and field stars. As a consequence, the average reddening of the young population in 30 Doradus must be higher than the adopted value E(BV)= 0.3, while the average reddening of the field can be as low as the foreground MW reddening (E(BV)= 0.07; Fitzpatrick & Savage 1984).
The next Section is dedicated to a cursory CMD inspection of the
stellar populations in the whole HTTP data-set.
4 Stellar populations in the HTTP catalog
The CMD is the most powerful tool to recover the history of a resolved stellar population, since different parts of the CMD are populated by different masses with different evolutionary times. In the following analysis we use the CMD to investigate which populations are present in the whole HTTP catalog and the role of the NGC 2070 region. For this task we use the optical CMD, which offers better spatial resolution than the NIR one. A more quantitative analysis will be the subject of Section 5.
4.1 The whole HTTP sample
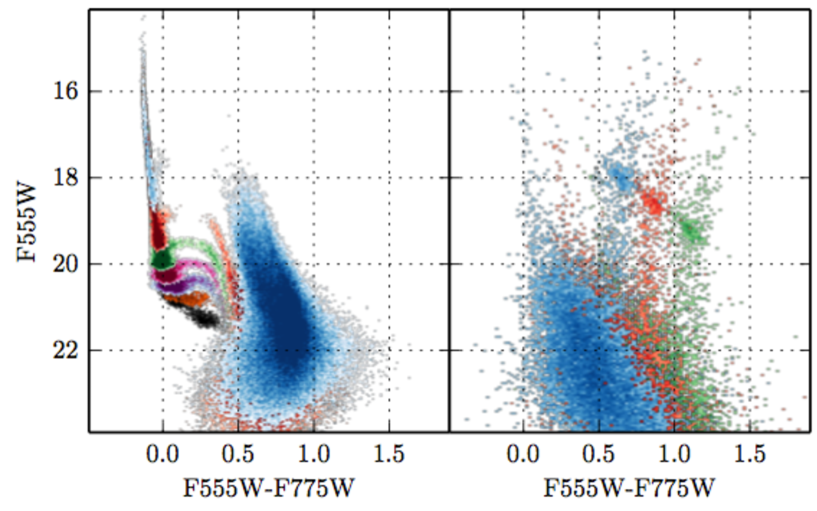
The F555W vs F555WF775W CMD of the entire HTTP data-set is shown in Fig. 3, with overlaid isodensity contours (left panel) and stellar isochrones (PARSEC) of different ages (right panel).
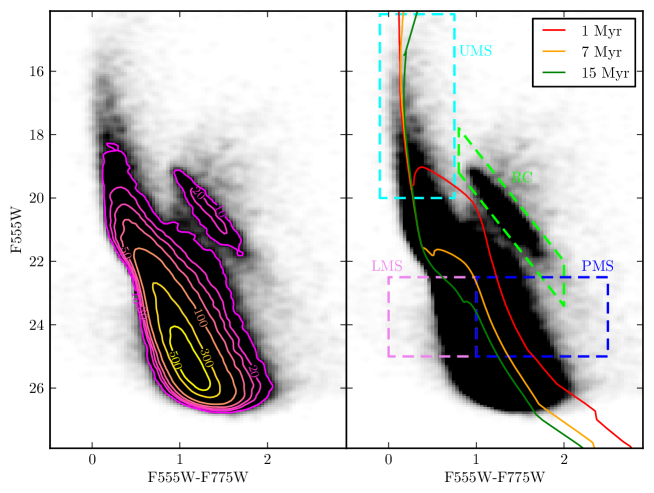
The first remarkable feature of this CMD is an extended UMS, populated by a plethora of intermediate and high mass stars. As the overlaid isochrones show, the width of the UMS is hardly explained by a difference in age. Moreover, given the average youth of these stars, plausibly much younger than Myr, a metallicity spread is unlikely. As widely discussed in other works (see, e.g., Selman et al. 1999; De Marchi & Panagia 2014 ), differential reddening is the main cause of this effect, although stellar rotation may also have a role in widening the UMS.
To the right of the UMS, the next striking feature is the very elongated red clump (RC; see also Section 5.1) and a broad red giant branch (RGB). These phases are populated by stars older than 1 Gyr and belonging to the general field population of the LMC. As for the UMS width, most of the elongation and broadening is due to severe differential reddening affecting the region (see Haschke et al. 2011; De Marchi et al. 2014; De Marchi & Panagia 2014).
Finally, the lower MS shows a huge color dispersion (more than 1 mag) at relatively bright magnitudes (F555W). As usual, a possible explanation comes from the comparison with the isochrones. Although differential reddening contributes to this effect, pushing part of the lower MS (LMS) to the red, the existence of short-lived massive stars requires that a large fraction of these red stars are genuine PMS stars (coeval with the massive stars).
More information on the nature of these populations can be inferred from their spatial distribution. In fact, the spatial distribution of stars in different evolutionary stages yields important information on the star formation processes across the region. Assuming a velocity dispersion of 21-27 km s-1 (measured from RGB stars; Carrera et al. 2011), stars older than 1 Gyr are expected to be diffused over scale lengths of several kpc, hence their distribution should be rather uniform over the HTTP field of view (FOV; 200 pc). On the other hand, stars like those in NGC 2070, young and with very low velocity dispersion (45 km s-1; Hénault-Brunet et al. 2012), are expected to be close to their birthplace.
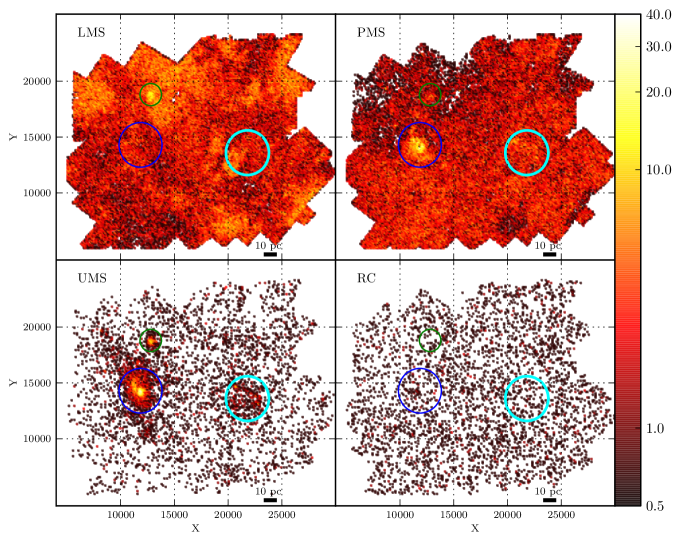
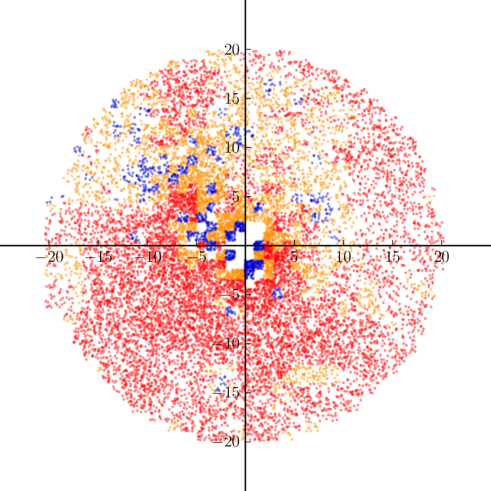
The right panel of Fig. 3 highlights CMD regions of selected UMS (cyan box), RC (green box), low mass MS (LMS) (pink box) and PMS (blue box) stars. UMS and PMS stars are young objects a few tens of Myr old, RC stars are intermediate age stars ( Gyr), LMS are MS stars older than few tens of Myr. Figure 4 shows the corresponding spatial density (stars per pc2).
Populations grow more compact as one moves toward younger ages (see also Fig. 5 and 6 in Harris & Zaritsky 1999). Other interesting features are:
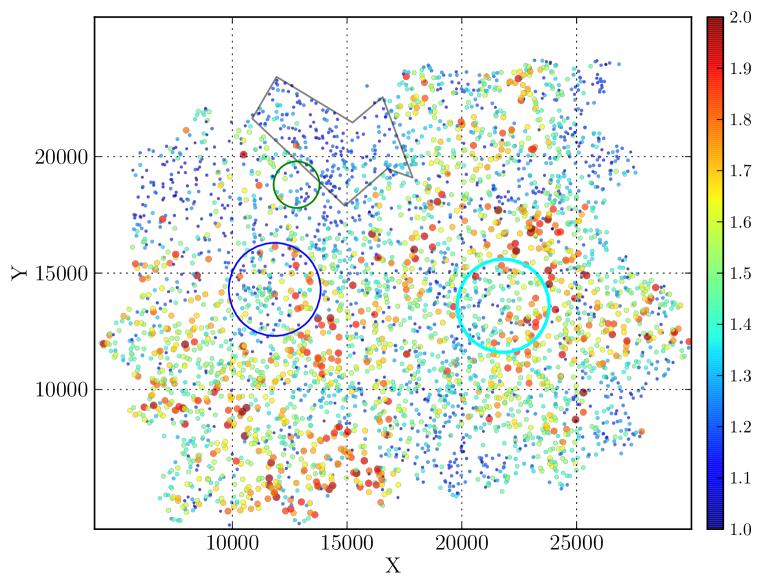
1) the UMS stars (bottom left panel in Fig. 4) appear very clustered. Three major concentrations are visible: NGC 2070, the most prominent, about 40 pc wide (encircled in blue), Hodge 301 (encircled in green) and NGC 2060 (encircled in cyan). Lighter over-densities are also visible throughout the FOV. In other words, although most of the ongoing and recent (i.e., in the last 50 Myr) SF is concentrated in few dense loci, a minor recent activity is present in the entire area;
2) as compared to the UMS distribution, RC distribution (bottom-right panel) is, as expected, rather uniform. RC stars are a pure sample of field stars. Their age, older than 700 Myr, rules out that these objects are associated with 30 Doradus, which is, at most, a few Myr old. The small over-densities are probably contamination of intermediate mass PMS stars or very reddened massive stars from the youngest regions. From a theoretical point of view, the intrinsic position of the RC in the CMD could be affected by factors like binaries, differences in age and metallicity, etc. (see, e.g., Castellani et al. 2000). However, these effects are insufficient to account for the observed RC elongation (up to 1.5 mag in F555WF775W), which is mostly due to differential reddening. The source of this reddening is the gas/dust located between the closest and farthest RC star along the line of sight. More specifically, background RC stars suffer the highest degree of absorption, which is caused by the combination of Milky Way (MW) and 30 Doradus extinction, while foreground stars will suffer only from MW (E(BV)) extinction;
3) The distributions of LMS (top-left panel) and PMS (top-right panel) stars appear mutually exclusive: the top-left corner of the FOV shows a paucity of PMS stars, while LMS stars are clearly overabundant there. The main cause for this effect is reddening. Most of the LMS stars belong to the LMC field. This is because 30 Doradus is younger than few Myr, hence its MS stars are necessarily brighter than our LMS box of Fig. 3 (right panel) (at ages Myr the 30 Doradus low-mass stars are mainly still in PMS, as suggested by the isochrones in Fig. 3). Under these circumstances, the only way to remove LMS stars from the LMS box is the action of reddening (see also the map of Fig. 7). Doing so, these reddened MS stars are likely to fill the PMS box, eventually producing the observed anti-correlation LMS/PMS stars (a similar behavior is found by Gouliermis et al. 2006 in NGC 346; see their Fig. 4). In addition to this, the tendency of young PMS stars to be concentrated where the optical depth is higher exacerbates this effect. The only exceptions are the center of NGC 2070, where the LMS stars are missed because of the severe incompleteness, and Hodge 301, whose high concentration of LMS is due to its higher age (so Hodge 301’s TOn gets into the LMS box).
Finally, the blue circle in Fig. 4 is the region we have used to recover the SFH of NGC 2070. It is immediately clear from the maps that the region harbors most of the UMS stars of the entire 30 Doradus complex, as well as a remarkable concentration of PMS stars. On the other hand the region is quite deficient in LMS stars, probably lost because of the extreme crowding conditions.
4.2 NGC 2070
In this Section we discuss the broad CMD features of the stellar population of NGC 2070. Our selection includes all stars within 2000 pixels ( 20 pc) from the cluster center333Throughout the paper we will refer to R 136 as the NGC 2070 center because it is spatially well defined.. Figure 5 shows the corresponding CMD for the F555W vs F555WF775W filters with overlaid isodensity contours (left panel) and PARSEC isochrones of 1, 7 and 15 Myr (right panel). The MS contours of NGC 2070 differs from those of 30 Doradus as a whole (Fig. 3). The peak density is around F555W, with minor peaks down to F555W, while the 30 Doradus CMD shows a smooth profile down to F555W.
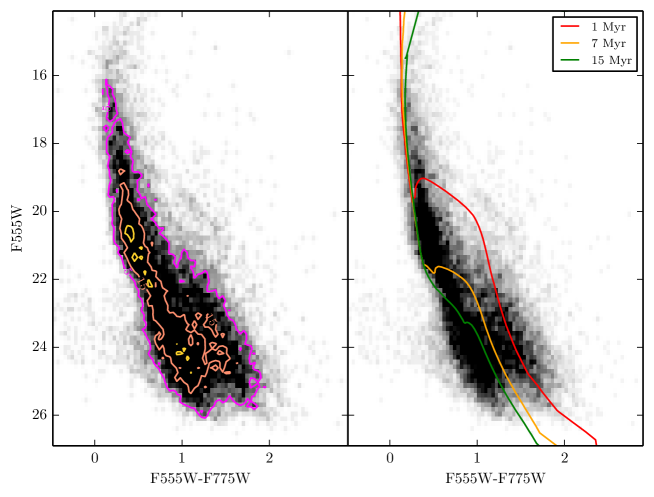
In Figure 6 we investigate the radial distribution of stars in NGC 2070. The top panels show CMDs of stars in concentric annuli (1-2-3) of equal area (the radius of the innermost circle is about 12 pc) around the center of the cluster (from left to right, progressively further out from the center), the bottom panel shows the corresponding luminosity functions (LFs). We find that:
1) The LF of the innermost region 1 shows two clear peaks, located at F555W and F555W. The bright peak is well fitted by an isochrone of 7 Myr (see the figure), evidence of a young TOn. Stars brighter than this magnitude are mostly MS cluster members, while fainter stars are members only if they are on the PMS (by the definition of TOn, fainter members have not reached the MS yet). Indeed, a visual inspection of the CMD shows a clear color bimodality below F555W, which is likely due to field MS stars (mostly not-members) on the blue side, and PMS stars (members) on the red side. The dip after the bright peak is caused by the short evolutionary timescale of the PMS phase compared to the MS. After the dip the LF rises again following the IMF, which increases at lower masses. Eventually the incompleteness wins, creating the second decline at F555W. The apparent lack of lower MS stars in the region 1 is probably due to the higher crowding, which causes more severe incompleteness than in the more external annuli 2 and 3. In Section 5 we will use the synthetic CMD approach, combined with artificial star experiments, to test if these lower MS stars are compatible with LMC field contamination or hide some older TOns. To this aim, we also need to estimate the LMC contamination in a reference field (see next Section).
2) In contrast to the innermost region 1, annular regions 2 and 3 show a monotonic increase towards fainter magnitudes, with no intermediate peak before the final drop due to incompleteness. In terms of age, the lack of obvious TOns means that regions 2 and 3 are not dominated by as young stars like in region 1. Nonetheless, at the magnitude of the region 1 peak, region 2’s LF has a mild excess of stars compared to region 3, which would point to a poorly populated TOn. As a further proof, the region 2 CMD also shows an excess of PMS stars relative to region 3.
3) Stars brighter than in the region 3 show a larger color spread than in regions 1 and 2. The RC is clearly visible in regions 1 and 2 (at magnitudes 20.020.3 and colors 11.5), while it is much more dispersed in 3. All of these suggest a differential reddening that is higher in region 3 than in regions 1 and 2.
5 Recovering the SFH of NGC 2070
The technique of recovering the SFH of spatially resolved populations from their CMDs (e.g. Tosi et al. 1991) has undergone continuous refinement and can now provide reliable SFHs for any resolved population within Mpc (see, e.g., Tolstoy et al. 2009; Cignoni & Tosi 2010 and references therein). These advances have been achieved because of improved models of stellar evolution, which are now computed for fine grids of stellar masses and metallicities and faster multi-CPU computing facilities, which allow one to perform extensive artificial star tests on the real images and to fully explore a wide parameter space.
A widely used approach consists of populating a 2D array of basic synthetic CMDs generated from stellar models. Each basic CMD is a “fuzzy” isochrone, with duration , fixed metallicity and an assumed IMF. To compare the basic CMDs and the observational counterparts, the models are convolved with photometric errors and incompleteness as derived from artificial star tests performed on the real images. The best superposition of the basic CMDs defines the SFH and the age-metallicity relation, and is the one that minimizes the residuals from observational CMD. The approach adopted here is described in more details in the Appendix.
Despite the advances in this field, the derivation of the SFH from the CMD is often affected by systematic errors that are difficult to assess. From a theoretical point of view, several stellar phases are still uncertain (thermally pulsing asymptotic giant branch, PMS, and post-MS for massive stars), while observationally differential reddening and highly variable incompleteness can be hard to treat.
Concerning NGC 2070, and the general 30 Doradus region, we face three major problems in trying to estimate the SFH: 1) membership errors due to field interlopers from the LMC field that mimic older populations; 2) the extreme crowding conditions exacerbate the incompleteness, shortening the reachable look-back time; 3) the high level of differential reddening spreads and dims the CMD, blending together young PMS stars and older MS stars, which introduces further age ambiguities.
5.1 Field contamination
To measure the SFH of NGC 2070 we need to estimate the local field contamination. A typical approach is to decontaminate the cluster by subtracting the star-counts from a reference field. However, given reddening and incompleteness variations across the whole 30 Doradus, it is impossible to find another direction replicating the observational conditions of NGC 2070. A way out is to find a field that resembles as much as possible the LMC field we would observe without NGC 2070, which means low or negligible SF activity in the last 50 Myr, minimal differential reddening and high completeness down to F555W. This reference LMC field could be then artificially corrected for the more severe incompleteness and photometric errors of NGC 2070. The resulting field would differ only in terms of normalization and differential reddening from the real LMC field contaminating NGC 2070. Finally, reddening and normalization of this field could be tuned together with the SFH of NGC 2070 until an adequate match of NGC 2070’s CMD is found.
As a first step we searched for low reddening areas around 30 Doradus. A good tracer for extinction is the RC color. Figure 7 shows the spatial distribution of RC stars, color coded according to the F555WF775W color (larger and redder symbols correspond to redder F555WF775W). We find that, at odds with the smooth distribution of the entire RC sample (see the bottom-right panel of Fig. 4), redder RC stars are very concentrated along filaments and arcs, most likely tracing gas and dust in 30 Doradus. This allows us to select extended regions, like the wide region just above NGC 2070 (see the black box in the Figure), with relatively blue RC stars. Because these stars can not all be in the foreground, these regions must be low-extinction windows in the gas/dust layers of 30 Doradus. Interestingly, the aforementioned region is also poorly populated by PMS stars (see top-right panel of Fig. 4), which implies minimal SF activity in the last 50 Myr.
After a careful inspection of all regions with low extinction and PMS number, we found the best compromise in the region delineated by a black line in Fig. 7. The corresponding CMD is shown in Fig. 8, here overlaid on the 30 Doradus CMD (grey symbols). This sample was adopted to represent our reference field. As expected, its RC and lower MS are much tighter than the general CMD, signatures of scarce differential reddening and young SF activity, respectively. It is worth noting, however, that residual differential reddening is still present.

5.2 Artificial star tests
To test the level of completeness of our photometric data and to have reliable estimates of photometric errors, we ran extensive artificial star experiments. The experiments consist of adding “fake” sources for each of the eight pass-bands, modeled with the PSF used in the photometric analysis of the frames, onto the actual images. We then applied the same source detection routines used for our science images to the fields containing the combined actual images and the fake sources. We then determined the completeness fractions, defined as the ratio of recovered artificial stars to the number of the injected ones. We considered an artificial star lost if it is not recovered or if it is recovered being 0.75 mag brighter than its input magnitude. In fact, this means that it has fallen either on a real star brighter than the artificial star or one of its same brightness. Thus, we are not recovering or measuring the artificial star but a real one instead.
To preserve the crowding conditions of the data, fake stars were arranged in a spatial grid such that the separation of the centers in each star pair was larger than two PSF radii. We found that a separation of 20 pixels guarantees that the probability of recovering a fake star is the same as it would be if we added only one fake star. The experiment is then repeated using a series of slightly shifted grids.
As an example of our fake stars procedure, the top panel of Figure 9 shows the impressive 50% completeness map in the F555W band for a region 2000 pixel ( 20 pc) away from the cluster center (5 million fake stars). The bottom panel shows the corresponding real image. The most striking feature is the remarkable completeness variation, up to 8 magnitudes, in different locations within the region. Regions like the broad area around X=10750, Y=13500 are photometrically complete at 50% level down to , whereas more crowded sub-regions, like the central area, are 50% complete only for .

Such variations are determined by the interplay of four major effects: photon scattering off dust in 30 Doradus, continuum/line nebular emission, pixel saturation and stellar crowding. Dust scattering and gas emission raise the background flux and, in turn, make it more difficult to resolve stars. The net result is visible in the diffuse “nebulous” areas of the completeness map (see Figure 9). More localized than the dust and gas effects, pixel saturation produces the visible “streaks” (charge-bleeding along the rows of the CCD) extending off of many bright stars. Finally, the extreme crowding conditions near R 136 are responsible for the central completeness “hole” (where most of the injected fake stars are lost).
5.3 Reddening and data-model comparison
We are not assuming any a priori reddening distribution. In principle we do not know where populations of different age are located inside NGC 2070, so reddening is an unknown function of age. Naively speaking, young massive stars may have carved the gas with their ionizing flux, hence lowering the extinction. On the other hand, high levels of SF could be sustained only where the gas density is higher, which would lead to the opposite situation. Besides, normalization and reddening of the reference field are also free parameters. Furthermore, PMS stars may appear reddened due to their local circumstellar material.
When dealing with such a large parameter space (age, reddening and field contamination) there is uncertainty on whether the best solution is local or global. To cope with this we combined a genetic algorithm with a local search procedure (Hybrid-Genetic Algorithm, HGA; see Appendix A for details) which is more effective to avoid local trapping than local search alone. In our approach the first step is to store a library of “basic” synthetic CMDs, where each CMD is a Monte Carlo synthetic population generated with a step-wise SF and reddening distribution.
When the CMDs are generated other population parameters like metallicity, distance modulus (mM)0, slope of the IMF and binary fraction q are kept fixed at 0.008 (e.g., Luck et al. 1998), 18.5 (e.g., Panagia et al. 1991; Schaefer 2008; Pietrzyński et al. 2013), Kroupa (2001) and 30%444Primary and secondary stars are both picked from the same IMF., respectively. The extinction coefficients are taken from De Marchi & Panagia (2014). The explored ages range from now up to 50 Myr ago. Since older isochrones tend to be more tightly packed in the CMD than younger isochrones, the duration of each age step increases with age from 1 Myr (at the present time) to 20 Myr (50 Myr ago). The reddening is allowed to vary between 0 and 1 mag with a step of 0.05 mag.
All “basic” synthetic CMDs (see left panel of Fig. 10) are then degraded using the photometric errors and incompleteness as derived from the artificial star tests discussed in the previous Section. Once this basis is generated, any complex synthetic CMD can be constructed as a linear combination of the “basic” synthetic CMDs. In order to take into account field contamination, the CMD of the reference field (see Section 5.1) is artificially reddened with steps of 0.05 mag between E(BV)=0 and E(BV)=1 to produce a complete basis of field CMDs. Likewise any kind of contamination can be simulated by linearly combining these “basic” field CMDs (see right panel of Fig. 10). The only difference is that the “basic” field CMDs are corrected for the difference in photometric errors and incompleteness as estimated in the field itself and in the NGC 2070 region, while the “basic” synthetic CMDs are only corrected for the latter. However, since in the reference field completeness and photometric errors at F555W are 100% and of the error in sub-region A1, the first correction is almost negligible.
The combination of “basic” CMDs (both synthetic and field) which minimizes the residuals from the observational CMD (in terms of Poissonian likelihood) is searched with the HGA code. The best coefficients tell us the most likely: 1) star formation rate as a function of time (i.e., the SFH); 2) total reddening (foreground internal) as a function of time; and 3) field contamination (reddening and normalization).
Which part of the CMD is used? Not all of the CMD is used to recover the SFH. Our analysis is limited on the bright end by the saturation magnitude and on the faint end by the 50% completeness magnitude level. Nonetheless, even with these conservative selections, the large variations of completeness with magnitude in some regions (see upper plot in Fig. 9) force us to derive the SFH in sub-regions within which the completeness is reasonably uniform. In fact, our artificial stars are uniformly distributed across the region, whereas real stars are concentrated in clumps and filaments, structures covering a minor fraction of the total area. As a consequence, most of the stars will suffer a real incompleteness which is worse than the average measured with artificial stars. The division in “iso-complete” sub-regions mitigates this bias. Fig. 11 shows our selection: sub-regions of NGC 2070 where the completeness in F555W is 50% for F555W (A1), F555W (A2) and F555W (A3) are indicated in red, orange and blue, respectively. The stars found in both the F555W and F775W filters inside these sub-regions are used to recover the optical SFHs. Overall, our sub-regions trace the stellar density, from the lowest (A1) to the highest (A3).
This analysis leaves out the very center of NGC 2070, a 3 pc region mostly represented by the SSC R 136. Here stellar crowding is so severe that most of the intermediate and low mass stars are lost, hence little, if any, information is available from TOns.
To further validate the SFH, we independently analized the NIR data. To do this we used all stars detected in both the F110W and F160W images inside each sub-region (defined using the F555W data). In this case however the faint limiting magnitude was anchored to the 50% completeness level in F110W.
6 Results
6.1 SFHs
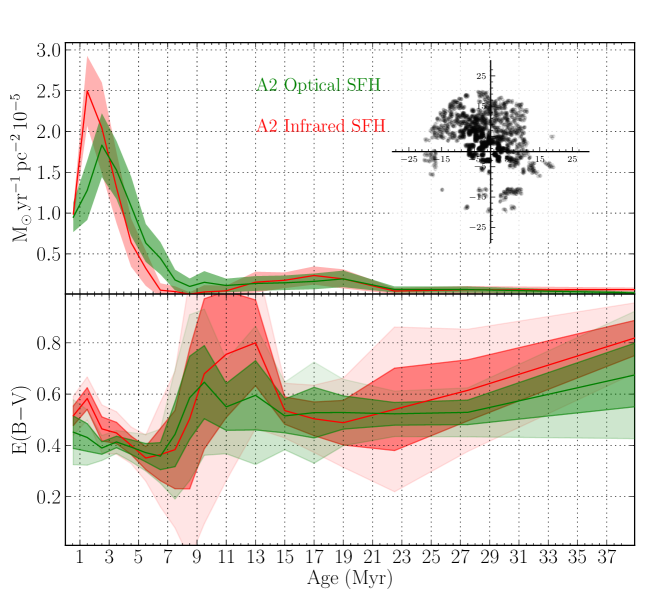
Figures 12 and 13 show the recovered SF rate (in ; top panel) and reddening as a function of age (bottom panel) for sub-regions A1 and A2 respectively, as predicted using the optical (green curve) and NIR (red curve) CMDs. In principle our code provides the full distribution of reddening as a function of age, but to ease the visualization we only provide the mass-weighted555Weighting with the predicted mass allows us to take into account that high reddening stars tend to be under-sampled because of the incompleteness. average reddening as a function of age. The shaded bands indicate one (darker) and two (lighter) standard deviations. Such uncertainties are the quadrature sum of a statistical error (obtained by bootstrapping the data and re-deriving the solutions) and systematic error (obtained by re-deriving the solutions with different age-binnings and CMD binning scheme).
Despite the different spatial resolution and reddening sensitivity, optical and NIR predictions are in good agreement. Both results predict that mild SF activity started throughout the whole NGC 2070 region Myr ago, and that about 7-8 Myr ago the birth rate accelerated. Interestingly, the activity in the last 1 Myr has been relatively quiet compared to the average in the last 5 Myr.

Concerning the activity that commenced 20 Myr ago, it is important to note that our SFHs have been obtained by taking into account field contamination, hence, unless we have been very unlucky in our field selection666Normalization and reddening of field stars are let to vary, whereas the ratio between young and old field stars depends on the chosen field., it is reasonable to assume that this activity is a local extras over the LMC field. Nonetheless, whatever the origin, its significance is low (zero activity is still within 1-sigma error bars).
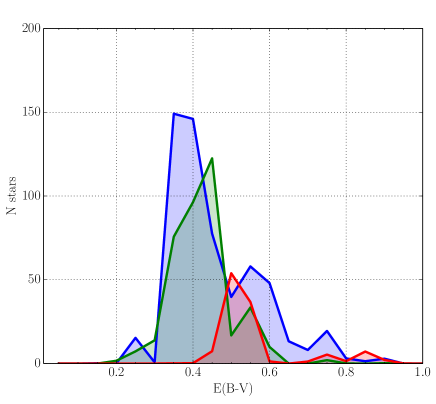
Focusing on the specific sub-regions, the SFH of region A1 shows a mild bimodality, with a minor peak around 5-7 Myr ago and a major peak 1-4 Myr ago (1-3 Myr ago in the optical SFH, 2-4 Myr ago in the NIR one). The measured reddening distribution anti-correlates with SF: the average E(BV) is for stars with ages older than 7 Myr, when the SF activity was lower, and for stars of younger ages, when the SF was stronger. Optical and NIR reddening derivations agree within errors, both in confirming the presence of notable differential reddening. The large oscillations of the NIR solution are mostly due to the low sensitivity to reddening in these filters. Figure 14 shows an example of the full reddening solution (number of considered stars vs E(BV)) for region A1 in three age bins (2, 6 and 20 Myr). As it can be seen, the full distributions are asymmetric with a long tail at high reddening.
The SF in sub-region A2 (Fig. 13) is about two times higher than in sub-region A1. The most important feature in the A2 SF is a pronounced peak in both optical and NIR solutions 1-3 Myr ago. Like in sub-region A1, the reddening of sub-region A2 is anti-correlated with the SF activity. The average reddening values are also very similar.
Because of the high crowding we used only the optical CMD to derive the SFH of the most internal sub-region A3. Fig. 15 shows the result (blue) compared to the other two SFHs over the last 15 Myr. The bottom panel shows the corresponding reddening distribution. The peak activity is almost three times higher than in A2, and at odds with other sub-regions, is clearly located between 1 and 2 Myr ago.
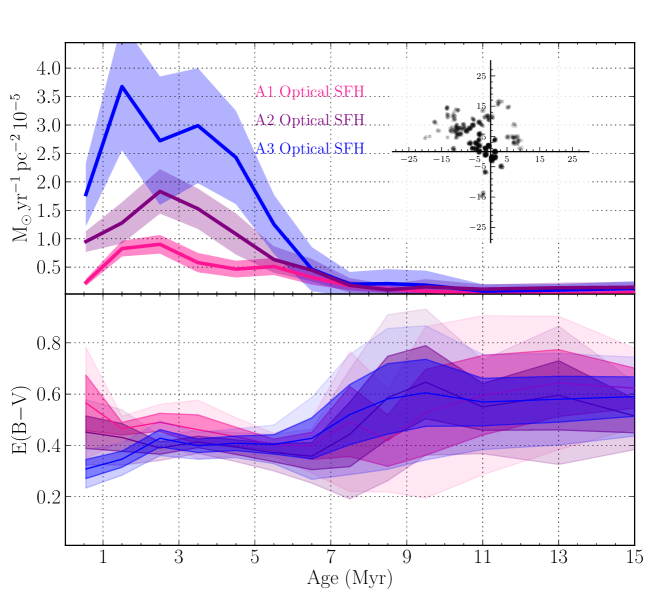
The total mass assembled in the regions A1, A2, and A3, in the last 7 Myr, is about , , and , respectively.
Finally, our analysis does not involve the central core of NGC 2070, where the activity is presumably much higher. A rough estimate can be made by re-scaling the SFH of region A3 to match the number of stars in the magnitude range F555W 16-18, where the sample is fairly complete even in the core. In this magnitude range the core contains two times the stars of region A3, but concentrated in an area four times smaller. This leads to a scaled peak rate of the order of and a total mass of , in excellent agreement with Hunter et al.’s 1995 estimate. Adding this mass estimate to the mass of sub-regions A1, A2 and A3, we get a total mass for NGC 2070 of 777We stress that this result has been obtained with a Kroupa (2001) IMF. Changing from a Kroupa to a Salpeter IMF below 0.5 increases the total by a factor 1.6.. This value is compatible with the results of Selman et al. (1999), who found within 14 pc from R 136 (using a Salpeter IMF down to 0.5 M⊙), Andersen et al. (2009), who found (using a Salpeter IMF down to 0.1 M⊙) and Bosch et al. (2001), who found using dynamical considerations.
6.2 Fit quality
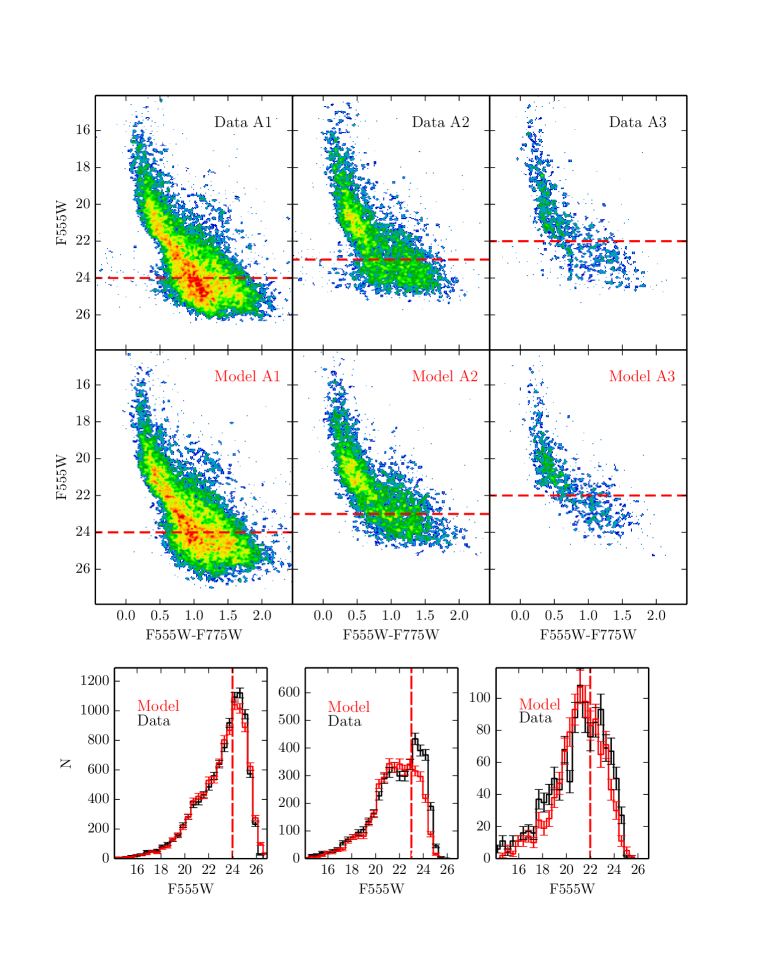
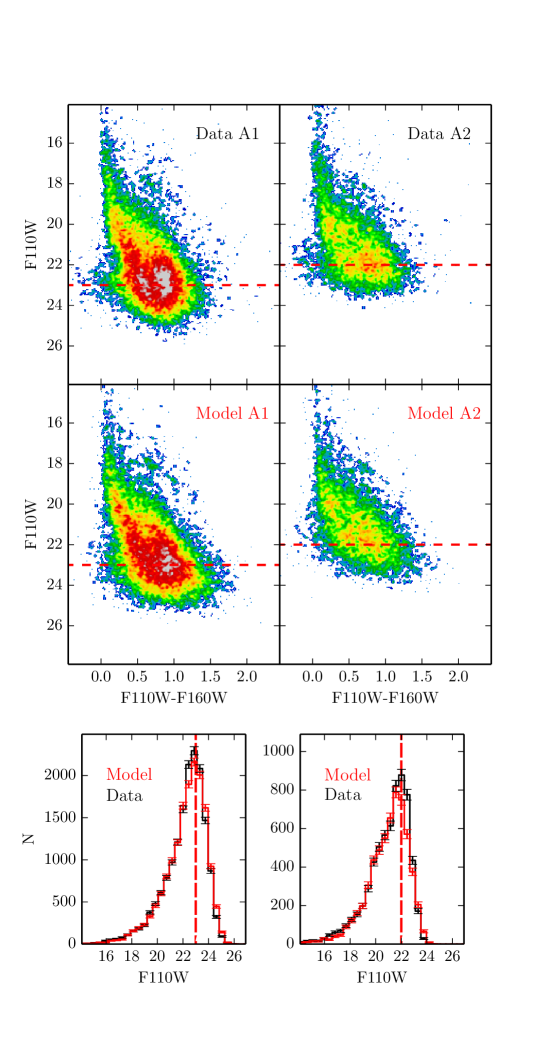
Figure 16 compares the observed optical CMDs (top panels) in the three sub-regions (from left to right, A1-A2-A3) to synthetic CMDs (middle panels) generated from our best solutions. The bottom panels show the corresponding LFs. The red dashed line corresponds to the faintest limit used to fit the data. Figure 17 shows the same analysis for the NIR CMDs (regions A1 and A2 only).
Simulations for sub-regions A1 and A2 show a good agreement with both the optical and NIR CMDs. Within the portion of the CMDs used to fit the data (see red dashed lines), observational and model LFs show deviations that are compatible to the errors (computed as square root of the observational count rates). This suggests that a Kroupa IMF, which is very similar to a Salpeter IMF above 0.5 M⊙, is consistent with the data. At fainter magnitudes our simulations systematically underestimate the observational star counts (more in the optical than the NIR). This effect is minor in sub-region A1, but becomes significant in sub-region A2. One possible explanation for this mismatch is the 0.75 mag selection threshold that we used to reject artificial stars that are actually blended with real stars. Relaxing this condition alleviates the issue, but also increases the scatter in the synthetic CMDs more than what we see in the data. However, the impact of this effect should be minor in the magnitude range used for fitting.
The simulation for sub-region A3 is in less good agreement with the observations. As is visible from the LFs (see the bottom right panel of Fig. 16), the observed star counts systematically outnumber synthetic counts even at bright magnitudes (F555Ws). The straightforward explanation is to attribute the discrepancy to the incompleteness of the region, which is too inhomogeneous to be accurately modeled by our tests. However, from a physical point of view, it is also conceivable that the transition from PMS to MS for intermediate/massive stars is not well reproduced by models. Indeed, the major discrepancy is in the range F555W 18-19, which corresponds to TOn ages younger than 1 Myr. If the PMS evolutionary time for these objects is overestimated (so more PMS stars were predicted than observed) or the PMS birth-line (the region in the CMD where stars are still embedded in their gas cocoons and, therefore, still invisible in optical bands) is closer to the MS than predicted, any attempt to simultaneously fit PMS and MS star counts will end up with a bias. In this case, the deficiency of MS stars could suggest that the SF rate for stars younger than 1 Myr might be underestimated.
Finally, the number and colors of RC stars are well reproduced. This indicates that field contamination and reddening are correctly modeled.
6.3 Solution robustness
To test the robustness of the solution against variations in the assumed IMF, binary prescription (fraction and mass ratio) and distance, we re-derived the SFH of region A1 using alternative values as an example. In Figure 18 we compare the results (shaded orange histograms) with the standard solution (shaded green histogram). The top-left panel shows the SFH obtained using a shorter distance modulus, (mM), as suggested by some Cepheids studies (e.g. Macri et al. 2006). The top-right panel shows the SFH obtained with a binary fraction of 60% (e.g. Sana et al. 2013) and mass ratio randomly drawn from a constant distribution between 0.5 and 1. The bottom-left and bottom-right panels show the SFH obtained using an IMF exponent , above , of 1.9 and 2.7, respectively.
Overall, all recovered solutions are qualitatively and quantitatively (within 2-sigma) consistent, suggesting that our findings are robust. In particular, the onset of the major activity 7 Myr ago is unchanged. Relatively larger differences are found for IMF changes. The predicted rate for s is significantly stronger than the case for ages Myr, while for s it is stronger for ages Myr. These differences are principally due to the SF rate-IMF degeneracy. The lack of stars of lower mass (caused by the flatter IMF) is compensated with a higher early SF rate, whereas the lack of intermediate and massive stars (caused by the steeper IMF) is compensated with a higher recent activity.
We also found that the synthetic CMDs corresponding to the and solutions systematically underestimate and overestimate, respectively, the star-counts for F555W (the reverse for F555W). On the other hand, changing the binary fraction and mass ratio does not affect either the SFH or the fit quality.

7 Comparison with Previous Studies
7.1 SFH
Selman et al. (1999) recovered the SFH of NGC 2070 using a Bayesian approach applied to the UBV photometry down to , corresponding to stars more massive than . The SFH was found to be dominated by three episodes, namely a young peak at Myr, an intermediate-age peak at Myr, and an old peak Myr ago. These three bursts appear to be spatially disjoint, with the youngest stars concentrated towards the center while the intermediate-age stars appear spherically distributed over a 6 pc radius, slightly off-center. The observations are consistent with a SF that propagated inward.
Andersen et al. (2009) obtained HST/NICMOS F160W band images of the central 14 pc 14.25 pc around R 136 and combined them with archival WFPC2 F555W and F814W observations (Hunter et al. 1995, 1996). By fitting the F160W vs F555WF160W CMD with stellar models above (Marigo et al., 2008) and stellar models below (Siess et al., 2000), they constrained the age of the low mass population to be Myr old.
Brandl et al. (1996) derived the age distribution for a region of arcseconds2, at a distance of 4 arcseconds from R 136, using a synergy of NIR photometry with adaptive optics and HST photometry. Their investigation was limited to stars more massive than 12 M⊙. The resulting age distribution (see their Fig. 13) grows from 7 Myr ago up to the present time with three visible bursts at 5-6 Myr, 3-4 Myr and 1 Myr ago. Moreover, they did not find red giants and red super-giants in their FOV, concluding that the age of R 136 must be less than 5 Myr.
According to Walborn & Blades (1997) the central region can be divided into a core, R 136, Myr old, a peripheral triggered population 1 Myr old, and a group of late-O and early-B stars 4-5 Myr old.
De Marchi et al. (2011) used deep HST observations including H for a field of arcmin arcmin enclosing NGC 2070. They inferred that a significant fraction ( 35%) of the PMS stars were formed prior to 12 Myr ago, while a similar fraction is younger than 4 Myr. In terms of SF, they found that 1 Myr ago the region was about 30 times more active than 16 Myr ago.
Using isochrone fitting, Sabbi et al. (2012) found that the majority of the stars in the “northeast clump”, a group of stars a few pc away from R 136, have ages between 2 and 5 Myr ago, while stars in R 136 are at most 2 Myr old.
Except for De Marchi et al. (2011) and Sabbi et al. (2012), our data are generally much deeper than the others in the literature and, therefore, more sensitive to older activity. Indeed, our prediction about the beginning of activity in NGC 2070, about 20 Myr ago, is only accessible with our data. Moreover, our analysis implements the PARSEC evolutionary models, which cover consistently the entire evolution from the PMS phase to the post-MS phase, whereas all previous analyses had forced to combine models for the PMS phase (Siess et al. 2000; Tognelli et al. 2011) and other models for later phases.
Despite these differences, our SFH is broadly consistent with the aforementioned results. Of particular interest is the 7 Myr epoch, when our solution predicts a significant SF enhancement. This event is generally consistent, or slightly older, with what is found in all other studies. Similarly to De Marchi et al. (2011) we find evidence of some activity prior to 10 Myr ago, whose rate is, at most, one order of magnitude lower than the recent one.
From a spatial point of view, the activity shifts to younger ages moving from our region A1 to A3, resembling the inward progression found by Selman et al. 1999. This is interesting, given that Selman et al. 1999 and this work use complementary mass ranges, above in the case of Selman et al. 1999 and below in our case. The inward scenario is also broadly consistent with the De Marchi & Panagia (2014), Walborn & Blades (1997) and Sabbi et al. (2012) findings. De Marchi & Panagia (2014) found that stars younger than 4 Myr are more concentrated towards R 136 than stars older than 12 Myr. These authors also found a remarkable lack of old activity ( Myr) near R 136, whereas the old component is not significantly different in our sub-regions. However, the data in our sub-regions A2 and A3 are not deep enough to allow for a conclusive argument.
7.2 Reddening
Our results predict that stars younger and older than about 10 Myr are on average reddened by E(BV) and , respectively. Because young stars are spatially more concentrated, this also translates into a negative reddening gradient towards the center. This trend is in apparent contrast with findings of Zaritsky (1999), who found that the young populations (star forming regions few Myr old) in the LMC are more reddened than the older ones ( 1 Gyr). However, we point out that the timescales here are much shorter, our “old” population is only few Myr older the young one. Besides, all results indicate a large reddening dispersion (at least 0.1 mag).
Looking at the literature, we find a general consensus for highly variable reddening in the NGC 2070 neighborhood. More specifically, De Marchi & Panagia (2014) used UMS and RC stars to study extinction around NGC 2070. Once corrected for the foreground contribution (E(BV)=0.07), our average prediction for the young component is very close to the peak of their reddening distribution obtained from UMS stars (see the blue histogram in their Fig. 9), while our average prediction for the old component is well within their reddening dispersion.
Our reddening for the young population is also in good agreement with the results of Selman et al. (1999). These authors used stars more massive than and found average extinctions in the range (E(BV)=0.35-0.5).
8 Comparison with other starburst clusters
Overall, NGC 2070’s SFH is similar to that in NGC 346, the largest star forming region in the Small Magellanic Cloud (SMC), whose major activity started about 6-8 Myr ago and peaked about 3 Myr ago before dropping to a lower level (see Cignoni et al. 2011). If we exclude the core of NGC 2070, which is ten times more active than NGC 346, even the peak rate of region A3 is similar in amplitude to the peak rate in NGC346 (about between 4 and 5 Myr ago; Cignoni et al. 2011).
Niederhofer et al. (2015) analysed the CMDs of eight young massive LMC clusters and derived upper limits on potential age spreads by fitting Gaussian profiles to their SFHs. They found age spreads smaller than a few Myr for the youngest clusters (20 – 60 Myr old), which is consistent with our much more detailed analysis for NGC 2070.
Outside the Local Group, resolving older populations in SSCs becomes very challenging. Larsen et al. (2011) analysed seven young massive star clusters (5 – 50 Myr old) in five nearby galaxies, located at distances of 3 – 5 Mpc. They found that the simulated CMDs generated with Padova isochrones (Bertelli et al., 2009) and single burst SFH have problems to reproduce: 1) the observed separation in the CMDs between MS and He-burning “blue loop” stars, 2) the ratio between red and blue supergiants and, in some clusters, 3) the scatter in the luminosities of the supergiant stars (scatter that cannot be explained by observational errors alone). The authors could improve the fit by including an age spread of 10–30 Myr in model clusters.
9 Conclusions
We have presented a detailed analysis of the star formation history in
the starburst cluster NGC 2070, located in the heart of 30 Doradus in
the LMC, using deep optical and NIR CMDs from the Hubble Tarantula
Treasury Project. We used a new synthetic CMD approach combined with
the latest Padova models (PARSEC), the first to cover homogeneously
all stellar phases from PMS to post-MS.
In our implementation we encountered a number of interesting
challenges. We summarize here our main conclusions:
SFH: we found that NGC 2070 experienced prolonged activity, starting at least 7 Myr ago. We identify three major events in the history of this cluster:
-
•
Myr ago - This epoch demarcates the commencement of the first significant period of SF. Prior to this epoch, local activity is not distinguishable from the average activity in the LMC field;
-
•
7 Myr ago - The SF accelerated throughout the entire region;
-
•
1-3 Myr ago the activity reached a peak. In this time range, the SF moves from the periphery to the central regions. Our innermost region (A3) shows a maximum activity 1-2 Myr ago;
Stellar mass: We estimate the stellar mass of NGC 2070 out of 20 pc to be . This value is close to the median mass of Galactic globular clusters (; Mandushev et al. 1991).
Reddening: Concerning the reddening distribution, we find an average E(BV) mag for the young population (10 Myr old), and mag for the old one. An explanation could be that only in the last few Myr the SF has been vigorous enough to sweep away part of the gas through stellar winds. Another possibility is that the old activity took place on the far side of the NGC 2070 nebula as seen from us, therefore those stars experience most of the line of sight optical depth.
IMF: Except the innermost few pc, where the incompleteness is too severe to allow firm conclusions, a Kroupa IMF down to is compatible with the data. This corroborates and extends the result of Andersen et al. (2009) to sub-solar masses. To the level we can measure low-mass stars can form in starburst clusters in the same way they form in low density environments.
Appendix A Synthetic CMDs
The basic synthetic CMDs are populated through the following Monte Carlo procedure: 1) synthetic masses and ages are extracted from the assumed IMF and the j-th SF step, respectively; and 2) synthetic masses and ages are converted to absolute synthetic magnitudes and colors by using a fine grid of isochrones. For our calculations we used the latest (V.1.2S) PARSEC isochrones, covering the entire mass spectrum of from the PMS phase to the early-AGB phase; 3) A fraction q of synthetic stars is randomly chosen to have a companion. The masses of companions are extracted from the same IMF and their flux is added to the flux of the primaries; 4) The absolute synthetic photometry is put at the distance of the LMC and reddened with the k-th reddening. To produce realistic simulations, all basic CMDs are degraded with photometric errors and incompleteness as estimated from artificial star tests (see Section 5.2).
To have all stellar phases well populated, the synthetic CMDs are generated with a large number of stars (). Once constructed, the basic CMDs are binned in n bins of color and m bins of magnitude. The final result is a library of jk 2D histograms CMD and any CMD can be expressed as a linear combination of these 2D histograms (see Equation A1). The coefficients that multiply each of the CMD are the star formation rate at the time step j and reddening step k. The sum over j and k of provides the total star-counts predicted in the CMD bin (m,n) by the star formation .
| (A1) |
Including the reference field in the models corresponds to changing Equation A1 into Equation A2:
| (A2) | |||
where SF(k) regulates the number of field stars with reddening k-th, while F is the actual number of stars in the reference field (reddened with the k-th reddening) in the CMD bin (m,n).
Appendix B Best solution search
Once the observational CMD is binned as well, the next step is to search for the combination of basic CMDs that minimizes the CMD residuals between data and model. For this task we implemented a likelihood distance, whose minimization is not biased by low count statistics. The combination of basic CMDs that minimizes the likelihood corresponds to the most likely SFH behind the data. The uncertainty around the recovered best solution will be the sum in quadrature of a statistical error, obtained through a data bootstrap, and a systematic error, obtained by re-deriving the SFH using different age-binnings and CMD-binning.
In our approach the likelihood is minimized with an hybrid-genetic algorithm (HGA), which combines a classical GA with a local search. Pure GAs are iterative probabilistic algorithms for solving a problem that mimic processes found in the natural biological evolution. Compared to local search algorithms, GAs explore the search space in more points simultaneously, hence they are far less sensitive to the initial conditions and show remarkable ability to escape from local minima. Shortcomings of GAs are the weak ability for local exploration and the slow convergence rate. The proposed HGA aims to overcome both by alternating two phases: a GA, whose goal is to search for a quasi-global solution, and a local search, whose goal is to increase solution accuracy. The synergy of the two incorporates the exploration ability of GAs and the exploitation ability of local search algorithm. For this study we implemented both parallel and serial hybridization. The parallel one is applied to each iteration and aims at enhancing offspring likelihood by means of a local search before moving to the next generation. The serial one consists in applying a final local search after which the GA population has evolved to the region containing the global solution.
Appendix C Test
To test our approach we have generated synthetic data with features resembling NGC 2070 (10000 stars brighter than F555W). To simulate the observational conditions, this fake population is convolved with photometric uncertainties and incompleteness from the artificial star tests of NGC 2070. The input SFH is a sequence of five bursts of different ages and duration 1 Myr, while the input reddening distribution is built with 50% of the stars with E(BV) between 0.20 and 0.25, and 25% between 0.25 and 0.30, 25% between 0.15 and 0.20. Figure 19 shows the result of the reconstruction. The input SFH and reddening distribution are in black; the best reconstructed counterparts in red. The recovered SFH looks like a smoothed version of the input SFH, due to the finite time resolution associated with the discrete nature of the data, and the ill-conditioned nature of mathematical inverse problems. However, overall, input functions are successfully recovered, with most of the differences within the uncertainties. Moreover, a bursty SFH is recovered more accurately if the time gap between the individual bursts is longer.

References
- Andersen et al. (2009) Andersen, M., Zinnecker, H., Moneti, A., et al. 2009, ApJ, 707, 1347
- Anderson & King (2006) Anderson, A., & King, J.R. 2006, STSCI Inst. Sci. Rep ACS 2006-01 (Baltimore: STScI)
- Anderson et al. (2008) Anderson, J., Sarajedini, A., Bedin, L.R., King, I.R., Piotto, G., Reid, I.N., Siegel, M., Majewski, S.R., Paust, N.E.Q., Aparicio, A., Milone, A.P., Chaboyer, B., Rosenberg, A. 2008, AJ, 135, 2055
- Aparicio & Hidalgo (2009) Aparicio, A., & Hidalgo, S. L. 2009, AJ, 138, 558
- Baraffe et al. (2009) Baraffe, I., Chabrier, G., & Gallardo, J. 2009, ApJ, 702, L27
- Baume et al. (2003) Baume, G., Vázquez, R. A., Carraro, G., & Feinstein, A. 2003, A&A, 402, 549
- Belikov et al. (1998) Belikov, A. N., Hirte, S., Meusinger, H., Piskunov, A. E., & Schilbach, E. 1998, A&A, 332, 575
- Bertelli et al. (2009) Bertelli, G., Nasi, E., Girardi, L., & Marigo, P. 2009, A&A, 508, 355
- Bosch et al. (2001) Bosch, G., Selman, F., Melnick, J., & Terlevich, R. 2001, A&A, 380, 137
- Brandl et al. (1996) Brandl, B., Sams, B. J., Bertoldi, F., et al. 1996, ApJ, 466, 254
- Brandner et al. (2001) Brandner, W., Grebel, E. K., Barbá, R. H., Walborn, N. R., & Moneti, A. 2001, AJ, 122, 858
- Bressan et al. (2012) Bressan, A., Marigo, P., Girardi, L., et al. 2012, MNRAS, 427, 127
- Carrera et al. (2011) Carrera, R., Gallart, C., Aparicio, A., & Hardy, E. 2011, AJ, 142, 61
- Castellani et al. (2000) Castellani, V., Degl’Innocenti, S., Girardi, L., et al. 2000, A&A, 354, 150
- Cignoni et al. (2006) Cignoni, M., Degl’Innocenti, S., Prada Moroni, P., Shore, S.N. 2006, A&A, 459, 783
- Cignoni & Tosi (2010) Cignoni, M, Tosi, M.2010, in Dwarf Galaxies and Cosmology, Advances in Astronomy (Hindawi), vol. 3
- Cignoni et al. (2010) Cignoni, M., Tosi, M., Sabbi, E., et al. 2010, ApJ, 712, L63
- Cignoni et al. (2011) Cignoni, M., Tosi, M., Sabbi, E., Nota, A., & Gallagher, J. S. 2011, AJ, 141, 31
- De Marchi et al. (2011) De Marchi, G., Paresce, F., Panagia, N., et al. 2011, ApJ, 739, 27
- De Marchi et al. (2014) De Marchi, G., Panagia, N., & Girardi, L. 2014, MNRAS, 438, 513
- De Marchi & Panagia (2014) De Marchi, G., & Panagia, N. 2014, MNRAS, 445, 93
- de Mink et al. (2012) de Mink, S. E., Brott, I., Cantiello, M., et al. 2012, Proceedings of a Scientific Meeting in Honor of Anthony F. J. Moffat, 465, 65
- Fitzpatrick & Savage (1984) Fitzpatrick, E. L., & Savage, B. D. 1984, ApJ, 279, 578
- Gouliermis et al. (2006) Gouliermis, D. A., Dolphin, A. E., Brandner, W., & Henning, T. 2006, ApJS, 166, 549
- Gouliermis (2012) Gouliermis, D. A. 2012, Space Sci. Rev., 169, 1
- Grebel & Chu (2000) Grebel, E.K., Chu, Y.-H., 2000, AJ, 111, 787
- Harris & Zaritsky (1999) Harris, J., & Zaritsky, D. 1999, AJ, 117, 2831
- Haschke et al. (2011) Haschke, R., Grebel, E. K., & Duffau, S. 2011, AJ, 141, 158
- Hénault-Brunet et al. (2012) Hénault-Brunet, V., Evans, C. J., Sana, H., et al. 2012, A&A, 546, AA73
- Hosokawa et al. (2011) Hosokawa, T., Offner, S. S. R., & Krumholz, M. R. 2011, ApJ, 738, 140
- Hyland et al. (1992) Hyland, A. R., Straw, S., Jones, T. J., & Gatley, I. 1992, MNRAS, 257, 391
- Hunter et al. (1995) Hunter, D. A., Shaya, E. J., Holtzman, J. A., et al. 1995, ApJ, 448, 179
- Hunter et al. (1996) Hunter, D. A., O’Neil, E. J., Jr., Lynds, R., et al. 1996, ApJ, 459, L27
- Kroupa (2001) Kroupa, P. 2001, MNRAS, 322, 231
- Kennicutt (1991) Kennicutt, R. C., Jr. 1991, The Magellanic Clouds, 148, 139
- Kennicutt (1998) Kennicutt, R. C., Jr. 1998, ApJ, 498, 541
- Larsen et al. (2011) Larsen, S. S., de Mink, S. E., Eldridge, J. J., et al. 2011, A&A, 532, A147
- Luck et al. (1998) Luck, R. E., Moffett, T. J., Barnes, T. G., III, & Gieren, W. P. 1998, AJ, 115, 605
- Macri et al. (2006) Macri, L. M., Stanek, K. Z., Bersier, D., Greenhill, L. J., & Reid, M. J. 2006, ApJ, 652, 1133
- Marigo et al. (2008) Marigo, P., Girardi, L., Bressan, A., et al. 2008, A&A, 482, 883
- Massey & Hunter (1998) Massey, P., & Hunter, D. A. 1998, ApJ, 493, 180
- Mandushev et al. (1991) Mandushev, G., Staneva, A., & Spasova, N. 1991, A&A, 252, 94
- Mayne (2010) Mayne, N. J. 2010, MNRAS, 408, 1409
- Ng et al. (2002) Ng, Y. K., Brogt, E., Chiosi, C., & Bertelli, G. 2002, A&A, 392, 1129
- Niederhofer et al. (2015) Niederhofer, F., Hilker, M., Bastian, N., & Silva-Villa, E. 2015, A&A, 575, A62
- Panagia et al. (1991) Panagia, N., Gilmozzi, R., Macchetto, F., Adorf, H.-M., & Kirshner, R. P. 1991, ApJ, 380, L23
- Pietrzyński et al. (2013) Pietrzyński, G., Graczyk, D., Gieren, W., et al. 2013, Nature, 495, 76
- Rubio et al. (1992) Rubio, M., Roth, M., & Garcia, J. 1992, A&A, 261, L29
- Rubio et al. (1998) Rubio, M., Barbá, R. H., Walborn, N. R., et al. 1998, AJ, 116, 1708
- Sabbi et al. (2012) Sabbi, E., Lennon, D. J., Gieles, M., et al. 2012, ApJ, 754, LL37
- Sana et al. (2013) Sana, H., de Koter, A., de Mink, S. E., et al. 2013, A&A, 550, AA107
- Schaefer (2008) Schaefer, B. E. 2008, AJ, 135, 1
- Selman et al. (1999) Selman, F., Melnick, J., Bosch, G., & Terlevich, R. 1999, A&A, 347, 532
- Siess et al. (2000) Siess, L., Dufour, E., & Forestini, M. 2000, A&A, 358, 593
- Sirianni et al. (2000) Sirianni, M., Nota, A., Leitherer, C., De Marchi, G., & Clampin, M. 2000, ApJ, 533, 203
- Small et al. (2013) Small, E. E., Bersier, D., & Salaris, M. 2013, MNRAS, 428, 763
- Soderblom et al. (2014) Soderblom, D. R., Hillenbrand, L. A., Jeffries, R. D., Mamajek, E. E., & Naylor, T. 2014, Protostars and Planets VI, 219
- Stauffer (1980) Stauffer, J. R. 1980, AJ, 85, 1341
- Stolte et al. (2004) Stolte, A., Brandner, W., Brandl, B., Zinnecker, H., & Grebel, E. K. 2004, AJ, 128, 765
- Tang et al. (2014) Tang, J., Bressan, A., Rosenfield, P., et al. 2014, MNRAS, 445, 4287
- Tognelli et al. (2011) Tognelli, E., Prada Moroni, P. G., & Degl’Innocenti, S. 2011, A&A, 533, 109
- Tolstoy et al. (2009) Tolstoy, E., Hill, V., & Tosi, M. 2009, ARA&A, 47, 371
- Tosi et al. (1991) Tosi, M., Greggio, L., Marconi, G., & Focardi, P. 1991, AJ, 102, 951
- Walborn & Blades (1997) Walborn, N. R., & Blades, J. C. 1997, ApJS, 112, 457
- Walborn et al. (1999) Walborn, N. R., Barbá, R. H., Brandner, W., et al. 1999, AJ, 117, 225
- Zaritsky (1999) Zaritsky, D. 1999, AJ, 118, 2824