Dust Formation in Milky Way-like Galaxies
Abstract
We introduce a dust model for cosmological simulations implemented in the moving-mesh code arepo and present a suite of cosmological hydrodynamical zoom-in simulations to study dust formation within galactic haloes. Our model accounts for the stellar production of dust, accretion of gas-phase metals onto existing grains, destruction of dust through local supernova activity, and dust driven by winds from star-forming regions. We find that accurate stellar and active galactic nuclei feedback is needed to reproduce the observed dust-metallicity relation and that dust growth largely dominates dust destruction. Our simulations predict a dust content of the interstellar medium which is consistent with observed scaling relations at , including scalings between dust-to-gas ratio and metallicity, dust mass and gas mass, dust-to-gas ratio and stellar mass, and dust-to-stellar mass ratio and gas fraction. We find that roughly two-thirds of dust at originated from Type II supernovae, with the contribution from asymptotic giant branch stars below 20 per cent for . While our suite of Milky Way-sized galaxies forms dust in good agreement with a number of key observables, it predicts a high dust-to-metal ratio in the circumgalactic medium, which motivates a more realistic treatment of thermal sputtering of grains and dust cooling channels.
keywords:
dust, extinction – galaxies: evolution1 Introduction
Dust in the interstellar medium (ISM) exists alongside gas-phase metals and alters the dynamic and spectroscopic properties of galaxies (Calzetti, Kinney & Storchi-Bergmann, 1994; Silva et al., 1998; Dey et al., 1999; Calzetti et al., 2000; Netzer et al., 2007; Spoon et al., 2007; Melbourne et al., 2012). The surfaces of dust grains play host to a range of chemical reactions that subsequently influence the behaviour of the ISM and impact star formation (Hollenbach & Salpeter, 1971; Mathis, 1990; Li & Draine, 2001; Draine, 2003). Additionally, observations suggest that dust is a significant contributor of metals in the circumgalactic medium (CGM; Bouché et al., 2007; Peeples et al., 2014; Peek, Ménard & Corrales, 2015). Understanding the life cycle of dust grains, including their production in asymptotic giant branch (AGB) stars and supernovae (SNe; Gehrz, 1989; Todini & Ferrara, 2001; Nozawa et al., 2003; Ferrarotti & Gail, 2006; Nozawa et al., 2007; Zhukovska, Gail & Trieloff, 2008; Nanni et al., 2013; Schneider et al., 2014), growth via accretion of gas particles in the ISM and coagulation with other dust particles (Draine, 1990; Dominik & Tielens, 1997; Dwek, 1998; Hirashita & Kuo, 2011), destruction via thermal sputtering, collisions with other dust grains, and SN shocks (Draine & Salpeter, 1979a, b; McKee, 1989; Jones, Tielens & Hollenbach, 1996; Bianchi & Ferrara, 2005; Yamasawa et al., 2011), and other physical processes, is important in accurately modelling dust evolution.
Even at high redshift, galaxies can form substantial masses of dust. Far-infrared and submillimeter observations show that some dust-rich radio galaxies and quasars out to have dust masses greater than (Fan et al., 2003; Bertoldi et al., 2003; Hughes, Dunlop & Rawlings, 1997; Venemans et al., 2012; Casey, Narayanan & Cooray, 2014; Riechers et al., 2014; Watson et al., 2015). Two notable examples are SDSS J1148+5251, a quasar with an inferred dust mass of (Valiante et al., 2009, 2011), and A1689-zD1, a galaxy with a dust mass of and a dust-to-gas ratio comparable to the Milky Way value (Watson et al., 2015). To produce such large dust masses at high redshift, average SNe must yield roughly of dust, a quantity larger than the amount of dust SNe have been observed to condense (Todini & Ferrara, 2001; Sugerman et al., 2006; Dwek, Galliano & Jones, 2007; Lau et al., 2015). However, these dusty examples may not be representative of typical high-redshift galaxies. There is recent evidence of actively star-forming galaxies at with little dust obscuration (Walter et al., 2012; Kanekar et al., 2013; Ouchi et al., 2013), and observations suggest that dust extinction is generally decreased in low luminosity and high redshift systems (Bouwens et al., 2012). Our current understanding of dust formation at high redshift is therefore still quite incomplete.
Significant variation in dust properties also exists at low redshift. The Galactic dust-to-gas ratio is roughly (Gilmore, Wyse & Kuijken, 1989; Sodroski et al., 1997; Zubko, Dwek & Arendt, 2004) and several times larger than the values observed for the Large and Small Magellanic Clouds (Pei, 1992; Gordon et al., 2014; Roman-Duval et al., 2014; Tchernyshyov et al., 2015). In contrast, the metal-poor local dwarf galaxy I Zwicky 18 has been estimated to have a dust mass of no more than and a corresponding dust-to-gas ratio in the range of , several orders of magnitude below the typical values expected for larger systems (Fisher et al., 2014). Additionally, observations and models of the ISM indicate that the nature of dust can differ among individual chemical species (Wilms, Allen & McCray, 2000; Kimura, Mann & Jessberger, 2003; Jenkins, 2009).
The current sample of galaxies with reliable dust estimates has grown in recent years, driven by programs like SINGS (Kennicutt et al., 2003; Draine et al., 2007), the Herschel Reference Survey (Boselli et al., 2010), the Herschel ATLAS (Eales et al., 2010), KINGFISH (Kennicutt et al., 2011), and the Dwarf Galaxy Survey (Madden et al., 2013). Various trends and scaling relations involving dust and host galaxy properties have been observed from this data. There is a positive correlation between dust-to-gas ratio and metallicity (Vladilo, 1998; Draine et al., 2007; Galametz et al., 2011; Rémy-Ruyer et al., 2014; Zahid et al., 2014). However, the detailed behaviour of the dust-metallicity relation is unclear. Observations indicate that the dust-to-gas ratio is reduced at low metallicity, possibly due to effects in the interstellar radiation field that limit dust growth and enhance destruction processes (Rémy-Ruyer et al., 2014). Even over small metallicity ranges, there is pronounced scatter in the dust-to-gas ratio.
The observed dust-metallicity relation implies a dust-to-metal ratio that is fairly constant across a range of galaxy morphologies and histories. However, the nature of the dust-to-metal ratio at high redshift and low metallicity is uncertain. Recent work using gamma ray bursts has yielded dust-to-metal ratios fairly consistent with the Local Group, even in low metallicity systems (Zafar & Watson, 2013; Sparre et al., 2014). This would require SNe to be efficient producers of dust or grains to grow rapidly in the ISM (Mattsson et al., 2014). Separate analysis of gamma ray burst damped Lyman-alpha absorbers suggests a non-universal dust-to-metal ratio, with low metallicity environments producing dust less efficiently than spiral galaxies (De Cia et al., 2013). Even in the Milky Way, observations of strong gas-phase depletion (Roche & Aitken, 1985; Sembach & Savage, 1996; Jenkins, 2004, 2009) contrast the expectation that dust destruction outpaces stellar injection of dust (Barlow, 1978; Draine & Salpeter, 1979a; McKee, 1989; Dwek & Scalo, 1980; Jones et al., 1994; Jones, Tielens & Hollenbach, 1996). Understanding the balance between gas-phase metals and dust in Milky Way-sized systems requires more work.
A number of other empirical scaling relations have emerged, tying observed dust masses to various galactic properties. These include relations between dust-to-stellar mass ratio and gas fraction (Cortese et al., 2012), dust-to-stellar mass ratio and redshift (Dunne et al., 2011), dust extinction and stellar mass (Zahid et al., 2014), dust mass and gas mass (Corbelli et al., 2012), dust mass and star formation rate (da Cunha et al., 2010), and dust surface density and radial distance (Ménard et al., 2010; Pappalardo et al., 2012). Observational data have also yielded initial estimates of the dust mass function for low and high redshift (Dunne et al., 2000, 2011). These scaling relations provide constraints on galaxy formation models that include a treatment of dust.
A variety of numerical models have been used in previous work to better understand how dust evolves in a galaxy. These include one- and two-zone models (Dwek, 1998; Lisenfeld & Ferrara, 1998; Hirashita & Ferrara, 2002; Inoue, 2003; Morgan & Edmunds, 2003; Calura, Pipino & Matteucci, 2008; Valiante et al., 2009; Gall, Andersen & Hjorth, 2011a; Yamasawa et al., 2011; Asano et al., 2013a; Zhukovska, 2014; Feldmann, 2015), semi-analytic methods (Somerville et al., 2012; Mancini et al., 2015), and more recently first smoothed-particle hydrodynamical simulations resolving local dust variations (Bekki, 2013, 2015a). These models include processes like the formation of dust during stellar evolution, dust growth and destruction in the ISM, radiation field effects, and dust-enhanced molecular formation. Many of these one-zone models have addressed the formation of dusty high-redshift quasars and have indicated that if dust is unable to condense efficiently in SNe, a high star formation or accretion efficiency is needed to produce large dust masses at (Morgan & Edmunds, 2003; Michałowski et al., 2010; Gall, Andersen & Hjorth, 2011b; Gall, Hjorth & Andersen, 2011; Michałowski, 2015).
Numerical dust models have also focused on the evolution of the dust-to-gas and dust-to-metal ratios, often used in observations to characterise galaxies. The dust-metallicity relation is reproduced in many one-zone models (Issa, MacLaren & Wolfendale, 1990; Lisenfeld & Ferrara, 1998). These models predict a dust-to-metal ratio that is independent of metallicity in galaxies where SNe are the primary producers of dust (Morgan & Edmunds, 2003) and whose radial gradient in galactic discs can be used to estimate interstellar dust growth (Mattsson, Andersen & Munkhammar, 2012). The evolution of the dust-to-metal ratio may vary significantly with time, with the dust-to-metal ratio at possibly just 20 per cent of the present value (Inoue, 2003). Interestingly, galaxies are predicted to switch from low to high dust-to-metal ratio when crossing a critical metallicity threshold that enables efficient ISM dust growth (Zhukovska, Gail & Trieloff, 2008; Inoue, 2011; Asano et al., 2013a; Feldmann, 2015). Previous one-zone dust models applied to the formation of a single galaxy show present day dust-to-metal ratios of roughly (Dwek, 1998) and (Calura, Pipino & Matteucci, 2008), with results significantly dependent on the strength of dust growth and destruction mechanisms in the ISM. These models also find depletion roughly constant across all chemical species. However, the biggest weakness of these one-zone models is their lack of spatial resolution, limiting their ability to make predictions about the distribution of dust within a galaxy.
Cosmological simulations provide a better means to understand how dusty systems can form at high redshift and how their dust content, both in the ISM and CGM, evolves in time. Additionally, simulations of full cosmological volumes can provide the sample size of galaxies needed to corroborate observed scaling relations involving dust. Recent cosmological hydrodynamical simulations have suggested that heavily dust-attenuated galaxies can form even at , with ultraviolet and optical colors consistent with a model having a dust-to-metal ratio of (Kimm & Cen, 2013). Motivated by the observed reddening of background quasars by foreground galaxies in Sloan Digital Sky Survey (SDSS) data (Ménard et al., 2010), smoothed-particle hydrodynamical simulations found that half of this reddening signal is attributable to dust more than from the closest massive galaxy (Zu et al., 2011). Radial gradients of the dust-to-gas ratio in galactic discs appear to be steeper for larger galaxies (Bekki, 2015a). Even in simulations where dust is not directly treated, radiative transfer post-processing can be used to infer dust extinction (Jonsson, 2006; Narayanan et al., 2010; Hayward et al., 2013; Yajima et al., 2014). The dynamics of grain sputtering in SN shocks can also be studied using tracer particles (Silvia, Smith & Shull, 2010). While some studies have investigated the impact of feedback mechanisms, such as winds driven by SNe, on the cosmological evolution of dust (Zu et al., 2011; Bekki, 2015a), much work still remains.
In this work, we incorporate essential dust physics into a moving-mesh simulation code and, for the first time in studies of dust, use a large sample of zoom-in cosmological initial conditions. Compared to previous dust models using one-zone methods and idealised initial conditions, our approach has the ability to resolve the structure of dust within a galaxy and the impact that local feedback processes have on dust evolution. While some smoothed-particle hydrodynamical simulations have treated dust without using zoom-in cosmological initial conditions, our highest resolution cosmological run offers improved mass resolution.
This paper is structured as follows. In Section 2, we discuss the theory and numerical implementation of our dust model in the context of a larger galaxy formation framework. Details of the cosmological initial conditions for our simulations are provided in Section 3. We analyse the importance of physical feedback processes, individual dust model components, and variations in simulation initial conditions in Section 4. Finally, in Section 5, we summarise our results and discuss the implications of our findings on future observations.
2 Methods
We employ cosmological simulations to track the evolution of dust and its effect on galaxy dynamics. We briefly review the core components of the galaxy formation model currently implemented in the moving-mesh code arepo (Springel, 2010), which have been detailed in prior work (Vogelsberger et al., 2013) and used for various cosmological studies (Vogelsberger et al., 2012; Genel et al., 2014; Torrey et al., 2014; Vogelsberger et al., 2014a, b), and then describe the new dust physics we have added. arepo uses a dynamic Voronoi tessellation to solve the equations of ideal hydrodynamics with a finite-volume method. A second-order Godunov scheme is used in conjunction with an exact Riemann solver to compute fluxes between cells. Additionally, gravitational and collisionless physics have been implemented using methods similar to the TreePM scheme in the smoothed-particle hydrodynamics code gadget (Springel, 2005).
2.1 Galaxy Formation and Feedback Mechanisms
The current galaxy formation model in arepo accounts for a number of physical processes, including primordial and metal-line gas cooling, stellar evolution and subsequent chemical enrichment of the ISM, black hole formation, and stellar and active galactic nuclei (AGN) feedback, which together yield a galaxy stellar mass function in good agreement with observations over (Torrey et al., 2014; Genel et al., 2014). The star formation prescription stochastically creates star particles in dense regions of ISM gas, with masses distributed according to a Chabrier (2003) initial mass function (IMF). As stars evolve off of the main sequence, mass is recycled to the neighboring ISM. This chemical enrichment routine follows nine elements (H, He, C, N, O, Ne, Mg, Si, and Fe). We adopt elemental mass yields and recycling fractions for AGB stars from Karakas (2010), SNe II from Portinari, Chiosi & Bressan (1998), and SNe Ia from Thielemann et al. (2003). We employ a stellar lifetime function from Portinari, Chiosi & Bressan (1998). Galactic outflows are modelled using wind particles launched from star-forming ISM gas and temporarily decoupled from hydrodynamics to emulate a galactic fountain driven by stellar feedback (Springel & Hernquist, 2003). We include the minor feedback modifications detailed in Marinacci, Pakmor & Springel (2014), which alter radio-mode AGN feedback and adopt warm galactic winds.
2.2 Dust Evolution
A wide variety of dust models have been used in recent galaxy formation simulations, though essentially all models track both the formation of dust during stellar evolution and its subsequent evolution in the ISM. The most simplistic of these models take a one-zone approach, solving a set of coupled ordinary differential equations for the time evolution of the total mass of gas, metals, and dust within a galaxy (Hirashita & Ferrara, 2002; Inoue, 2003; Morgan & Edmunds, 2003; Calura, Pipino & Matteucci, 2008; Valiante et al., 2009; Gall, Andersen & Hjorth, 2011a; Yamasawa et al., 2011; Asano et al., 2013a; Zhukovska, 2014; Feldmann, 2015). Other work assumes a two-component galaxy model, consisting of a bulge and disc region and allowing for local dust properties to be studied as a function of radial distance from the galactic center (Dwek, 1998). More recently, Bekki (2013, 2015a) has performed smoothed-particle hydrodynamical simulations that treat dust locally and offer improved spatial resolution.
In this work, we focus on the dominant dust production and evolution mechanisms. We leave additional processes, such as the catalysis of molecular hydrogen on dust grains and the effect of interstellar radiation fields, to future efforts. We track the mass of dust in each chemical species within individual gas cells. Dust is passively advected between gas cells when solving the hydrodynamic equations in each time step, in essence adopting a two-fluid approach with dust fully coupled to gas. However, dust is not implemented as a strictly passive tracer: as shown below, dust impacts metal-line cooling and in turn star formation and gas dynamics. Alternative treatments, including “live” dust particles decoupled from gas and subject to frictional or radiative forces (Kwok, 1975; Draine & Salpeter, 1979b; Barsella et al., 1989; Theis & Orlova, 2004; Bekki, 2015b), may be pursued in future work.
2.2.1 Dust Production via Stellar Evolution
During the stellar evolution process described in Section 2.1, a certain amount of the mass of species evolved by stars and returned to neighboring gas cells in some time step is assumed to condense into dust, with the exception of H, He, N, and Ne. The remaining metal mass exists in the gas phase. In the framework below, we follow the approach used by Dwek (1998) and other subsequent works that track individual chemical elements. Most notably, we adopt a different functional form for the amount of dust produced during mass return from AGB stars than from SNe. Additionally, we make a distinction between AGB stars with in their stellar envelope, which are expected to produce carbonaceous solids (e.g. graphite or amorphous carbon), and those with , which are thought to form primarily silicate dust (Draine, 1990). In essence, the equations below describe elemental mass yields for dust, computed as a function of the yields for overall metals returned by stars.
For AGB stars with a carbon-to-oxygen ratio of in their returned mass, the amount of species dust produced is given by
| (1) |
where is the carbon condensation efficiency for AGB stars with , discussed below in more detail. Similarly, for AGB mass return with , the mass of species dust formed is
| (2) |
where is the mass in amu and is the condensation efficiency for species in AGB stars with . Finally, the mass of dust for element produced via SNe ejecta is
| (3) |
where the dust condensation efficiency of element for SNe is , which may differ from the corresponding efficiency for AGB stars. Equation (3) and its condensation efficiencies are used for both SNe Ia and II, consistent with all aforementioned models. Additionally, we note that the numerical prefactor for the calculation of in Equations (2) and (3) is slightly reduced from that given in Dwek (1998). We have found that this minor modification is necessary for oxygen, whose dust production is tied to the ejecta of heavier elements, in order to avoid the formation of more oxygen dust than total oxygen mass returned. We use different stellar nucleosynthesis yields than in Dwek (1998), and even though there is considerable uncertainty in the condensation efficiencies, we demonstrate in Section 4.3 that our results are insensitive to moderate changes in these prefactors. The range of condensation efficiencies that we explore is described in Section 3.2.
Within each gas cell, we separately track the mass of dust produced by AGB stars, SNe Ia, and SNe II, motivated by a desire to understand the dominant channels of dust production at high redshift. Additionally, we refer to carbon grains as graphite dust, and the dust in remaining species as silicate dust. While a simplification that fails to distinguish the full diversity of compounds that comprise dust grains, including polycyclic aromatic hydrocarbons, this division has been adopted in similar studies and is a step towards analysing the underlying ISM chemistry (Tielens & Allamandola, 1987; Dwek, 1998; Weingartner & Draine, 2001).
2.2.2 Interstellar Dust Growth
The mass of dust in the ISM may increase over time, as gas-phase elements collide with existing grains (Draine, 1990). To model the accretion of dust grains in the ISM, we follow the prescription of Dwek (1998) and Hirashita (1999) and in every time step compute each cell’s instantaneous dust growth rate
| (4) |
where is the cell’s mass of species dust, summed over components originating from AGB stars, SNe Ia, and SNe II, is the corresponding species metal mass, and is a characteristic growth timescale. Note that the first factor in parentheses induces a growth rate that depends on the local dust-to-metal ratio and slows the accretion rate as gas-phase metals are condensed into dust (Dwek & Scalo, 1980; McKee, 1989).
Previous studies have explored accretion timescales dependent upon local gas density and temperature (Yozin & Bekki, 2014; Zhukovska, 2014; Bekki, 2015a) as well as metallicity (Inoue, 2003; Asano et al., 2013a) in an attempt to better match the observed dust-metallicity relation. Following these prescriptions, for each gas cell we compute the local dust growth timescale
| (5) |
where and are the density and temperature of the gas cell, and are reference values for density and temperature in molecular clouds, and is an overall normalisation influenced by factors like atom-grain collision sticking efficiency and grain cross section (see Section 2.2 of Hirashita (2000) for a detailed derivation). We take to be and . This growth timescale is shortest in dense gas where collisions are more frequent than in the diffuse halo. Future efforts will need to more accurately model atom-grain collisions, taking into account a possibly temperature-dependent collision sticking efficiency and a realistic grain size distribution (Weingartner & Draine, 2001; Li & Draine, 2001).
2.2.3 Grain Destruction
Dust grains that have formed in the ISM can subsequently be destroyed through a number of processes, including shocks from SN remnants (Seab & Shull, 1983; Seab, 1987; Jones et al., 1994), thermal and nonthermal sputtering (Draine & Salpeter, 1979b; Tielens et al., 1994; Caselli, Hartquist & Havnes, 1997), and grain-grain collisions (Draine & Salpeter, 1979a; Jones, Tielens & Hollenbach, 1996). In particular, shocks reduce the net efficiency of dust formation in SNe, expected to be the primary producers of dust at high redshift. The mass of grains destroyed in such a manner is thought to be proportional to the energy of the shocks (McKee, 1989).
Paralleling Equation (4), for every active cell we can estimate the local dust destruction rate for species as
| (6) |
where is a characteristic destruction timescale (McKee, 1989; Draine, 1990; Jones & Nuth, 2011) and again the dust mass is computed by summing its components originating from AGB stars, SNe Ia, and SNe II. While we could tie to the galaxy-wide SN rate (Hirashita & Ferrara, 2002) or the radially-dependent gas surface density and SN rate (Calura, Pipino & Matteucci, 2008), we instead estimate a dust destruction timescale on a cell-by-cell basis, given by
| (7) |
where is the gas mass within a cell, denotes the efficiency with which grains are destroyed in SN shocks, is the local Type II SN rate, and is the mass of gas shocked to at least km s-1 (Dwek & Scalo, 1980; Seab & Shull, 1983; McKee, 1989). We take , though there is a range of physically plausible values used in previous work. Applying the Sedov-Taylor solution to a homogeneous environment yields
| (8) |
where is the energy released by a Type II SN in units of , and km s-1 is the shock velocity (McKee, 1989). Equation 8 implicitly assumes SN shock expansion into a homogeneous medium of , corresponding to the star formation density threshold in our model. We employ a fixed ISM density when calculating because the detailed ISM multi-phase structure and, in particular, the ambient gas density around each SN are not resolved in our simulations. In any case, we caution that this destruction prescription neglects thermal sputtering and grain-grain collisions in the CGM and thus may overdeplete gas-phase metals in the diffuse halo.
During every time step, the net dust growth rate in every active gas cell is computed by combining Equations (4) and (6), and this rate is used to update the local dust mass. When performing this update, we keep the relative proportions of dust mass originating from AGB stars, SNe Ia, and SNe II constant.
Additionally, the amount of dust in the ISM is reduced when star particles are created. We assume that dust and gas-phase metals are distributed uniformly within each gas cell, so that each star particle’s metals come from gas-phase and dust sources in the same proportion as in the ISM. For example, if a star particle is created from a cell in which 25 per cent of oxygen exists as dust and 75 per cent exists in the gas phase, then the amount of gas-phase oxygen lost by the cell is three times greater than the amount of oxygen dust lost. Other schemes to consume dust during star formation may be possible but more challenging to implement.
2.2.4 Dust Effects on Cooling
The galaxy formation model highlighted in Section 2.1 calculates gas cooling rates using contributions from primordial species, metals, and Compton cooling. In particular, the metal-line cooling rate is assumed to scale linearly with the gas-phase metallicity (see Equation (12) in Vogelsberger et al., 2013). The depletion of metals onto dust grains will decrease the gas-phase metallicity of the ISM and therefore reduce metal-line cooling.
Observations suggest that dust cooling channels can explain the formation of very metal poor stars (Caffau et al., 2011; Klessen, Glover & Clark, 2012), and modelling finds that cooling-induced fragmentation of dust impacts low-metallicity star formation (Schneider et al., 2006; Tsuribe & Omukai, 2006; Dopcke et al., 2013). In numerical work, the temperature of dust grains can be computed via thermal equilibrium calculations accounting for atomic line emission, grain photoelectric effect heating, heating of dust through external radiation fields, and dust cooling through thermal emission (Krumholz, Leroy & McKee, 2011). Dust may affect cooling rates computed in cosmological simulations using local ionising radiation (Cantalupo, 2010; Gnedin & Hollon, 2012; Kannan et al., 2014). In hot gas with temperatures above , cooling from ion-grain collisions is expected to be strong (Ostriker & Silk, 1973). For simplicity of our model, we neglect dust cooling channels in this first study.
While our model does not currently implement any specific dust cooling processes, metal-line cooling will be reduced in comparison with previous simulations involving arepo’s galaxy formation physics. Decreased cooling will in turn have a dynamical effect on galaxy formation, lowering the star formation rate (SFR). Future inclusion of dust cooling channels may weaken some of the dynamical effects seen in this work.
2.2.5 Winds from Stellar Feedback
We employ the non-local stellar feedback implementation from Vogelsberger et al. (2013) with some modification for dust. In this feedback prescription, gas cells in star-forming regions of the ISM are stochastically converted into wind particles, given a velocity
| (9) |
where is a dimensionless scale and is the local one-dimensional dark matter velocity dispersion, and allowed to move without hydrodynamic constraints.
When wind particles recouple to the gas, they deposit their metals, both gas-phase and dust, in the same proportion as the ISM from which they were launched. Thus, these stellar winds help carry metals and drive outflows away from dense regions of the ISM. In Section 4.2, we investigate the importance of these winds and their strength in distributing dust throughout a galaxy.
3 Cosmological Runs
3.1 Initial Conditions
The initial conditions for our runs consist of the Aquarius suite of haloes, previously used for high-resolution cosmological studies of Milky Way-sized structure (Springel et al., 2008). All runs adopt the CDM cosmological parameters , , , , , and Hubble constant , which were employed in the Millennium and Millennium-II suites of simulations (Springel et al., 2005; Boylan-Kolchin et al., 2009). Though recent results from the Wilkinson Anisotropy Microwave Probe (Hinshaw et al., 2013) and Planck satellite (Planck Collaboration et al., 2014) suggest, for example, a value of , we choose to adopt these parameters in part to remain consistent with recent hydrodynamical simulations also utilising the Aquarius suite of haloes in arepo (Marinacci, Pakmor & Springel, 2014).
The Aquarius haloes are labelled with the letters A through H, and each is simulated in a periodic box of side length . In Aquarius nomenclature, our main simulations were performed using level 5 initial conditions. In addition, we simulated the Aquarius C halo using higher and lower resolution initial conditions, levels 4 and 6, respectively, in order to study the convergence properties of the fiducial dust model. We have found our dust model to be well-converged and use the highest resolution initial conditions for some visualisations in this work. The Aquarius C halo, which we also use to study variations in dust and feedback physics, was adopted in the Aquila comparison project (Scannapieco et al., 2012) to analyse the results of a wide range of cosmological hydrodynamical codes. This halo has a fairly quiescent merger history, especially at low redshift (Wang et al., 2011). We also note that Marinacci, Pakmor & Springel (2014) applied this galaxy formation model without dust to the Aquarius haloes and found robust convergence over these same resolution levels.
The same gravitational softening length was used for gas, dark matter, and stars, and it was kept constant in comoving units until , with a maximum value in physical units of for the high-resolution region using level 5 initial conditions. The maximum values for level 4 and 6 initial conditions were factors of two lower and higher, respectively. The softening length was then used down to . We employ the subfind algorithm (Springel et al., 2001) for determining gravitationally-bound structure and substructure.
| Run | ||||||||||
| A5:FI | 237.5 | 11.62 | 182.29 | 5.61 | 4.52 | 3.79 | 211527 | 690478 | 5.03 | 26.40 |
| B5:FI | 183.0 | 4.22 | 78.18 | 3.48 | 1.37 | 1.82 | 119386 | 518981 | 3.35 | 17.59 |
| C5:FI | 233.5 | 11.11 | 175.93 | 5.98 | 3.47 | 3.47 | 253836 | 814834 | 4.11 | 21.59 |
| D5:FI | 240.7 | 15.18 | 195.56 | 12.20 | 6.12 | 7.66 | 319074 | 846419 | 4.40 | 23.10 |
| E5:FI | 206.7 | 6.14 | 114.16 | 5.35 | 1.09 | 1.00 | 179039 | 652270 | 3.33 | 17.50 |
| F5:FI | 208.0 | 9.26 | 113.67 | 9.48 | 3.58 | 5.55 | 375068 | 942365 | 2.30 | 12.06 |
| G5:FI | 201.9 | 9.94 | 95.99 | 7.78 | 5.20 | 5.74 | 317798 | 769854 | 2.83 | 14.88 |
| H5:FI | 180.1 | 2.61 | 76.24 | 1.67 | 0.20 | 0.34 | 87369 | 588050 | 2.96 | 15.56 |
| C4:FI | 232.5 | 6.82 | 159.19 | 3.89 | 1.44 | 1.76 | 1265814 | 5898234 | 0.51 | 2.70 |
| C6:FI | 235.6 | 13.92 | 179.84 | 6.91 | 4.97 | 4.54 | 39592 | 104118 | 32.90 | 172.73 |
In Table 1, we provide basic statistics on these haloes, computed at using the fiducial model described below. We provide two computations of the gas and dust masses: and , which are summed over all cells in the halo, and and , which include contributions only from dense ISM gas cells and estimate the gas and dust content of the galactic disc. We isolate ISM gas by filtering cells according to temperature and density using the relation
| (10) |
which has been shown to remove cells in the hot halo (see Equation (1) in Torrey et al., 2012). Additionally, Table 1 indicates the number and mass resolution of gas and dark matter cells in each halo.
3.2 Fiducial Parameters
| Variable | Fiducial Value | Description |
|---|---|---|
|
for ,
for |
dust condensation efficiency for species
in AGB stars with in ejecta |
|
|
for ,
for |
dust condensation efficiency for species
in AGB stars with in ejecta |
|
|
for ,
for , for |
dust condensation efficiency for species in SNe | |
| 0.2 | reference dust growth timescale, in units of | |
| 1.09 | available energy per SN II, in units of |
| 2 | 0.065 | 0.025 | 0.009 |
|---|---|---|---|
| 4 | 0.003 | 0.006 | 0.015 |
| 6 | 0.006 | 0.011 | 0.029 |
| 12 | 0.392 | 0.381 | 0.365 |
| 20 | 0.780 | 0.781 | 0.780 |
In Table 2, we present the set of parameter values that comprise our fiducial dust model. The fiducial feedback parameters are similar to those used in Vogelsberger et al. (2013), with and , and we did not retune the feedback model after including dust. Given that dust depletion will affect cooling rates and star formation, future feedback modifications may be required. This highlights the need to include dust in detailed galaxy formation models.
The fiducial dust condensation efficiencies follow those from Dwek (1998) and assume that a certain fraction of ejecta from an AGB star or SN exists as dust, with the remainder occupying the gas phase. These efficiencies are allowed to vary among species, since AGB stars and SNe are thought to produce dust of differing compositions (Ferrarotti & Gail, 2006; Zhukovska, Gail & Trieloff, 2008). For example, the high and low values of and , respectively, are motivated by the idea that carbon-rich AGB stars are the dominant producers of carbonaceous grains. We caution that the condensation efficiencies used for SNe Ia are high given recent observations and modelling work that suggest dust forms inefficiently in SNe Ia (Nozawa et al., 2011; Gomez et al., 2012). However, as shown in Section 4, SNe Ia produce only about 10 per cent of the dust in a galaxy, and so our results are not very sensitive to the condensation efficiencies for SNe Ia.
While condensation efficiencies of the form described in Section 2.2.1 have also been adopted in more recent simulations (Calura, Pipino & Matteucci, 2008; Bekki, 2013), stellar models have begun to analyse the composition of ejected dust as a function of a star’s mass and metallicity (Ferrarotti & Gail, 2006; Bianchi & Schneider, 2007; Zhukovska, Gail & Trieloff, 2008; Nanni et al., 2013; Schneider et al., 2014). For example, low-metallicity AGB stars are thought to produce very low amounts of silicate grains (Ferrarotti & Gail, 2006). Also, some of these recent models track dust grains for SiC, Al2O3, or other compounds that do not map neatly onto our chemical evolution model. While we do not adopt condensation efficiencies that vary with mass or metallicity, we can still compare the dust masses predicted by our stellar yield tables and condensation efficiencies with those from more detailed stellar models. In Table 3, we calculate the total dust masses condensed in our model for various choices of stellar mass and metallicity. We note that AGB stars produce total dust masses around with no strong metallicity dependence, fairly consistent with stellar models (Zhukovska, Gail & Trieloff, 2008; Nanni et al., 2013).
We can also compare the results of Table 3 to predictions of dust masses condensed in SNe II, although we caution that this subject is debated in the literature. For SNe II with masses of and , we calculate condensed dust masses of roughly and , respectively. In comparison, Todini & Ferrara (2001) predicted about and of dust for these choices of stellar mass. Our results are consistent with the estimate that between 2 per cent and 5 per cent of a progenitor’s mass becomes dust in SNe II in the range (Nozawa et al., 2003). However, there is some tension with observations: SN 2003gd, for example, was determined to have no more than of dust (Sugerman et al., 2006; Meikle et al., 2007), and other SNe have failed to produce the amount of dust expected from models (Rho et al., 2008, 2009). As stellar models begin to implement more complex chemical reaction networks (e.g. Cherchneff, 2010) and more observations are gathered, better constraints can be placed on the dust masses condensed in core-collapse SNe.
In the ISM, refractory grains are estimated to have destruction timescales of , lower than the typical injection time of dust from stellar sources (Barlow, 1978; Draine & Salpeter, 1979a; Dwek & Scalo, 1980; McKee, 1989). Mechanisms that allow metals to recondense in the ISM and counter the destruction-injection imbalance are needed to regulate gas-phase abundances. The growth timescale characterises dust growth in molecular clouds and the associated probability that a gas-phase metal atom will collide and stick to an existing grain (Draine, 1990; Hirashita, 2000). Just as we tie the dust destruction timescale in each cell to its local SN rate, we adopt a growth timescale dependent on local gas density and temperature that enables dust to grow more quickly in dense ISM gas. There is evidence that dust growth is particularly dominant over stellar dust production in galaxies above a certain critical metallicity (Inoue, 2011; Asano et al., 2013a; Mancini et al., 2015), and other models have begun to explore the effect of density, temperature, and metallicity variations on local growth timescales (Inoue, 2003; Bekki, 2015a). While models that employ variable growth timescales sometimes assume a characteristic grain size, grain density, and atom collision sticking efficiency, increasing the number of estimated parameters, in this work we fixed such parameters at typical Galactic values in a manner similar to Equation (12) in Hirashita (2000) in order to capture the essential density and temperature dependence in the growth timescale. The resulting estimated reference timescale is shown in Table 2.
| Name | Abbreviation | Physics |
| fiducial | FI | fiducial dust parameters from Table 2, , includes AGN feedback |
| no feedback | NF | no stellar or AGN feedback |
| AGN feedback | AF | only AGN feedback |
| slow winds | SW | |
| fast winds | FW | |
| constant growth timescale | CG | uses growth timescale of , ignores local density and temperature |
| constant destruction timescale | CD | uses destruction timescale of , ignores local SN rate |
| low production | LP | all condensation efficiencies from Table 2 halved |
| no growth | NG | no growth mechanism |
| no destruction | ND | no destruction mechanism |
| production only | PO | no growth or destruction mechanisms |
| without dust | WD | no dust tracking, all metals exist in gas phase |
Table 4 lists the range of model variations that we consider in addition to the fiducial setting. These variations are divided into two categories: those that apply the fiducial dust model and vary the underlying feedback mechanisms, and those that adopt the fiducial feedback settings and explore the impact of the various dust processes. We also explore the fiducial feedback model without dust tracking. In this last model, all metals are assumed to exist in the gas phase and contribute to metal-line cooling. This model without dust is expected to produce larger star formation rates and gas-phase metallicities.
These feedback and dust model variations, together with the range of Aquarius haloes used as initial conditions, provide a suitable starting point for understanding the impact of dust on cosmological galaxy formation simulations.
In the remainder of this paper, we refer to our runs using four-character identifiers: the first refers to the Aquarius halo chosen (i.e. one of A through H), the second denotes the resolution level of the initial conditions (i.e. 4, 5, or 6), and the last two indicate the underlying physical model using the abbreviations in Table 4. For example, C5:ND is shorthand for the simulation of the Aquarius C halo using level 5 initial conditions with no dust destruction mechanism.
4 Results
4.1 Distribution of Dust in the Fiducial Model
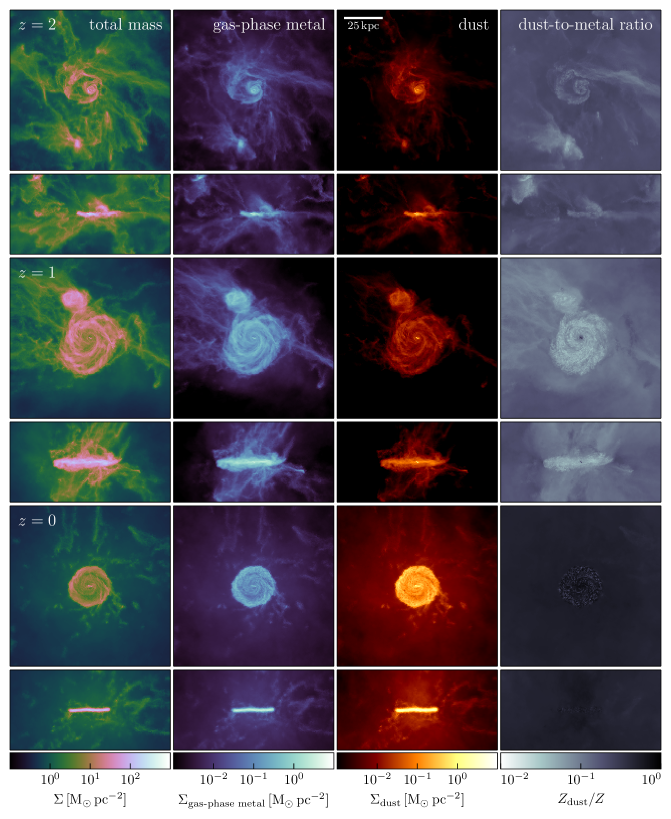
We first use our highest resolution simulation of the Aquarius C halo with fiducial dust and feedback physics to analyse the distribution of gas-phase metals and dust within the central halo and surrounding CGM. This is motivated by observations of significant amounts of dust in the CGM (Ménard et al., 2010; Peeples et al., 2014; Peek, Ménard & Corrales, 2015) and the fact that gas-phase metals may condense into dust in regions of low star formation. In Figure 1, we show surface densities of baryons (), gas-phase metals (), and dust () for face-on and edge-on views of the galactic disc at , , and . We also display the projected dust-to-metal ratio () at these redshifts, where denotes the mass fraction of dust and is the usual metallicity, including gas-phase metals and dust. This halo does not undergo any major mergers below (Wang et al., 2011), and so these images capture the quiescent formation of a disc of diameter roughly .
At , dust is most concentrated in the galactic center, with a surface density roughly an order of magnitude larger than that outside the disc. The surface densities of gas-phase metals and dust evolve in a similar fashion from to and largely trace the distribution of baryons. By , extends out to around as dust grows on the edges of the galactic disc. The surface density of gas-phase metals in the CGM is largely unchanged from to , with a dust-to-metal ratio below . The dust-to-metal ratio is largest near the galactic center and several times higher than the typical value away from the disc. By , there is less variation between gas-phase metals and dust. The central disc, roughly across, has , and the dust-to-metal ratio remains highest in the star-forming central core where dust is produced. We caution that the absence of thermal sputtering in the diffuse halo may artificially cause dust-to-metal ratios to rise in the CGM.
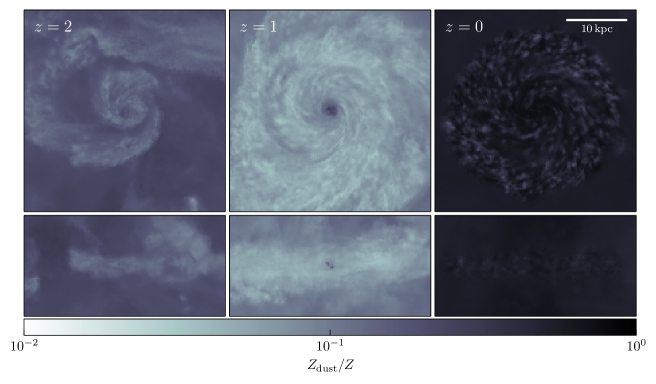
These results indicate that dust depletion can affect the distribution of gas-phase metals, especially in regions where high star formation activity produces the most dust. To highlight the dust evolution in the inner galactic disc, in Figure 2 we display zoomed-in projections of the dust-to-metal ratio for the face-on images from Figure 1. At each of , , and , the dust-to-metal ratio is largest near the galactic center. However, by , the spatial variation in dust-to-metal ratio that is prominent at diminishes, although there are small pockets of low dust-to-metal ratio in the outer disc. In conjunction with Figure 1, this suggests that observations of galaxies should see dust-to-metal ratios that are highest near galactic cores and vary with redshift.
4.2 Impact of Feedback
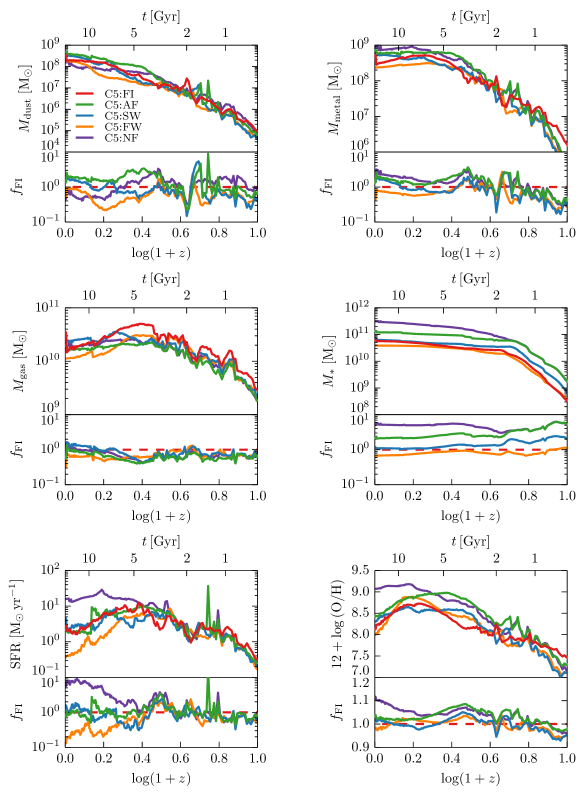
While some previous cosmological simulations treating dust have investigated the effect of galactic winds (Zu et al., 2011) and SN feedback (Bekki, 2015a), there has been no comprehensive analysis of feedback physics on dust evolution. In Figure 3, we show the total dust, metal, gas, and stellar masses as a function of redshift for each of the feedback variations detailed in Table 4 applied to the Aquarius C galaxy. We also plot the SFR and gas-phase metallicity, two dynamical quantities that will be impacted by the presence of dust.
Until , the no feedback and AGN-only feedback models are very similar, producing stellar masses several times larger than those seen in the fiducial, slow winds, and fast winds models with stellar feedback enabled. This is consistent with the SFR plot, which shows that the no feedback and AGN-only feedback runs have similar behaviour at high redshift. All runs yielded dust masses at high redshift more than an order of magnitude smaller than the several and above of dust observed for SDSS J1148+5251 and A1689-zD1 at and higher (Valiante et al., 2009, 2011; Watson et al., 2015). This is not too surprising since simulations of haloes larger than those in the Aquarius suite seem to be required to produce such dusty systems at high redshift.
At low redshift, AGN feedback strongly suppresses the SFR in the Aquarius C galaxy. The reduction in SFR provides more opportunity for gas-phase metals in the ISM to condense into dust, leading to a decline in gas-phase metallicity relative to the no feedback model. The runs with stellar feedback see a similar suppression of gas-phase metallicity below . This effect is most pronounced for the fast winds model, which is most efficient at driving gas-phase metals away from star-forming regions and has the lowest stellar mass. In the absence of SN activity, these gas-phase metals can accrete onto dust grains more rapidly. The fast winds run sees a drop in gas-phase metallicity of roughly from to . We note that the gas-phase metallicities shown in Figure 3 correspond to the dense galactic disc and that the hot halo sees less metal enrichment. The fiducial and slow winds models do not experience such severe declines in gas-phase metallicity and are more similar to the AGN-only feedback run at than the extreme no feedback model.
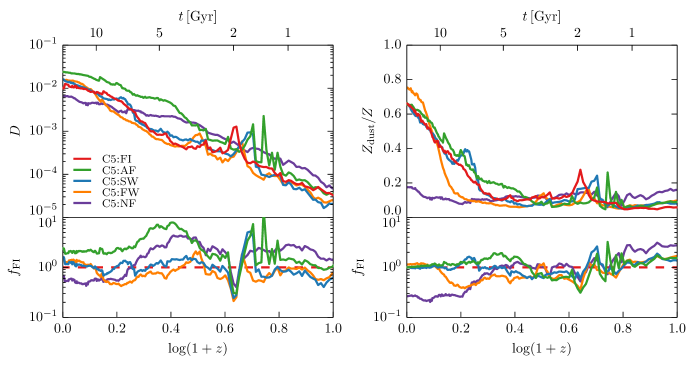
Figure 4 shows the evolution of the dust-to-gas ratio and dust-to-metal ratio for the same feedback variations. The fiducial model for this Milky Way-sized galaxy yields , consistent with estimates of the Galactic value (Gilmore, Wyse & Kuijken, 1989; Sodroski et al., 1997; Zubko, Dwek & Arendt, 2004). The feedback variations also yield dust-to-gas ratios within a factor of several of the fiducial value. The dust-to-gas ratio increases by roughly from to for the fiducial, slow winds, and fast winds runs. Above, we noted that the fast winds model promotes gas-phase depletion of metals, and so one might expect a high dust-to-gas ratio. However, because star formation is so strongly suppressed in this model, the total amount of dust is roughly half that of the fiducial run. As a result, the fast winds model has a dust-to-gas ratio comparable to the fiducial value. On the other hand, the fast winds dust-to-metal ratio is the largest of all models, at nearly . This is slightly below the fiducial model’s dust-to-metal ratio of near , which is still above but closer to estimates of the Galactic value. The no feedback run with more star formation was more effective at regulating the dust-to-metal ratio and returning dust to the gas phase.
The dust-to-metal ratio is expected to increase significantly at low redshift: previous modelling predicts at , , and to be , , and per cent of the value (Inoue, 2003). While the feedback variations do not reproduce these precise numbers, there is a noticeable increase towards low redshift. This increase is present across all feedback variations, even though the dust-to-metal ratios range from for the no feedback model to over for the fast winds model. The presence of feedback affects the normalisation of the dust-to-metal ratio but does not strongly alter the shape of its evolution.
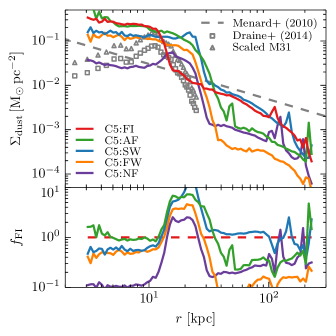
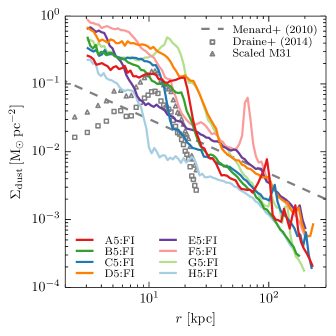
While the dust-to-metal ratio was strongly affected by variations in feedback, other quantities, like surface density of dust projected onto the galactic plane, are less sensitive. In Figure 5, we show the dust surface density versus radial distance at for each feedback model. Outside of the galactic disc, we compare with the scaling observed in SDSS data (Ménard et al., 2010). Additionally, since the Aquarius suite of haloes forms Milky Way-sized galaxies, we overlay recent observations of the dust surface density in the inner disc of M31, which has an estimated dust mass of (Draine et al., 2014). In contrast to previous figures, all feedback variations yield similar results, with the surface density profiles peaking around for . These surface densities display moderate increases from to , consistent with the growth in dust mass from Figure 3. All feedback runs experience a drop in dust surface density of roughly one order of magnitude or more when leaving the galactic disc, with normalisations and shapes in broad agreement with M31 data. These models also all predict scalings out to more than that are fairly consistent with SDSS observations. However, cosmological simulations of larger galaxy populations will be needed to confirm this trend on the scales detailed in Ménard et al. (2010). Such simulations will also be able to investigate predictions about the dust content of the intergalactic medium (Aguirre, 1999; Inoue & Kamaya, 2003; Petric et al., 2006; Dijkstra & Loeb, 2009; Corrales & Paerels, 2012).
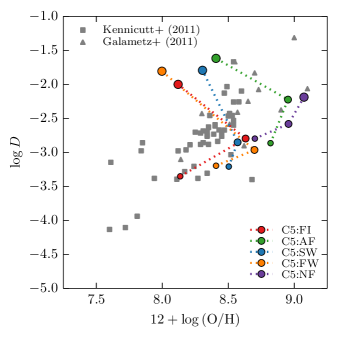
Figure 6 displays the dust-metallicity relation for these feedback runs, plotting dust-to-gas ratio versus gas-phase metallicity at , , and . We also display observations from Kennicutt et al. (2011) and Galametz et al. (2011), which cover roughly a range in oxygen abundance. To facilitate comparison with these data, we compute the dust-to-gas ratio and gas-phase metallicity using only dense gas in the galactic disc, as determined by the temperature-density phase space cut in Equation (10). We use this temperature-density cut in all subsequent plots involving comparison to observational data.
Variations in feedback affect both the gas-phase metallicity and the dust-to-gas ratio, particularly at low redshift. All models except the no feedback model see a decline in gas-phase metallicity from to , with the effect most pronounced for the fast winds run. The fiducial model is most similar to the runs with fast and slow winds, consistent with the results in previous figures. Although these stellar feedback models lie above the dust-metallicity relation at , the fits at and are much more reasonable. The no feedback model has a high gas-phase metallicity at all redshifts and thus lies slightly below the dust-metallicity observations. These results indicate that the inclusion of feedback in our dust model can affect the dust-metallicity evolution of galaxies and help limit high-redshift metallicities.
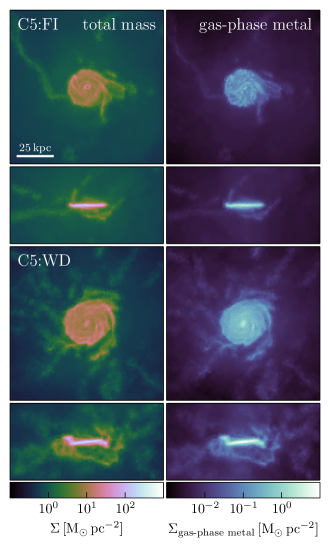
Because heavy elements trapped in dust grains do not contribute to metal-line cooling in our model, we expect star formation to decrease as gas-phase metals accrete onto dust. This qualitative effect is shown in Figure 7, which compares the projected baryon and gas-phase metal densities for our fiducial model as well as a model with all dust physics disabled. In this latter model, all metals outside of stars are considered to be in the gas phase. The run without dust produces a slightly larger galactic disc at , while the run with dust slightly reduces the density of gas-phase metals in the CGM. While we caution that our fiducial dust model ignores dust sputtering and may overdeplete gas-phase metals in the halo, these results suggest that the presence of dust affects how galaxies evolve in simulations, even if feedback settings are unaltered.
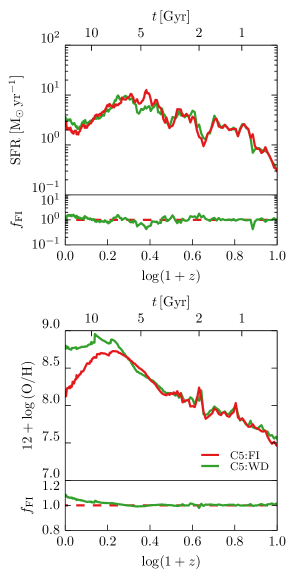
To analyse this effect quantitatively, in Figure 8 we plot the SFR and gas-phase metallicity versus redshift for our fiducial model as well as our model without dust. Differences in these models are most noticeable beginning at . While both models produce similar SFRs, the deviation in gas-phase metallicity from to is more pronounced. Without dust, the gas-phase metallicity increases and plateaus, whereas the model with dust sees a decline of roughly . At low redshift, even the fiducial feedback settings are sensitive to whether dust is included or not.
In the analysis above, the fiducial feedback model produced dust-to-gas and dust-to-metal ratios in rough agreement with the Galactic values. While its location on the observed dust-metallicity relation was in tension with observations at , the fiducial run at higher redshift yielded more accurate results. The no feedback model, already known to overproduce high stellar mass galaxies (Vogelsberger et al., 2013), has the highest SFR and lowest dust-to-metal ratio of the various models. Fast winds strongly suppress star formation and dust production, carrying metals to galactic regions where dust destruction is less effective. This resulted in a poor dust-metallicity fit, owing to low redshift gas-phase depletion. While the models with slow winds and AGN-only feedback do not suffer such extreme problems, they offer no advantage over the fiducial feedback model. Previous studies have shown that in the absence of winds, the dust-to-metal ratio required to match observed intergalactic reddening is unphysical (Zu et al., 2011). We note that variations in stellar wind feedback affect our dust-metallicity relation more strongly than in Bekki (2015a), though in both cases stronger feedback suppresses the dust-to-gas ratio and gas-phase metallicity. In the remainder of this paper, we adopt the fiducial feedback parameters.
4.3 Variations of the Dust Model
Motivated by observations of high-redshift dusty galaxies, previous one-zone dust models have studied the importance of dust growth in the ISM relative to contributions from stellar sources. Dust growth appears to be dominant in galaxies above a critical metallicity, and galaxies with a shorter star formation timescale reach this critical metallicity more quickly (Inoue, 2011; Asano et al., 2013a). The carbon-to-silicate dust mass ratio changes significantly as dust growth overtakes stellar injection, and dust growth in the ISM can be important even in dwarf galaxies (Zhukovska, 2014). While we do not investigate it in this paper, we acknowledge that variations in the IMF can affect dust model results, particularly in low mass galaxies (Gall, Andersen & Hjorth, 2011a). Top-heavy IMFs may also strengthen dust production from SNe, despite leading to increased grain destruction (Dunne et al., 2011). It is therefore natural to consider how the various components of our dust model impact galaxy evolution. This will help to determine which aspects of dust physics are most important and worthy of more detailed modelling in future work.
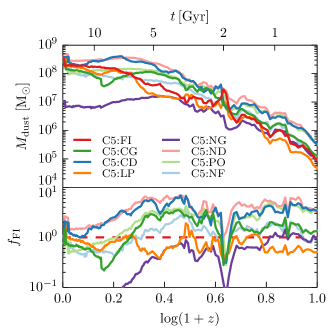
In Figure 9, we plot the redshift evolution of dust mass in the Aquarius C galaxy for each of the dust model variations listed in Table 4. We also show how each variation compares to the fiducial result. Because dust was shown to have a dynamical effect on star formation in Section 4.2, the total metal masses for each run show minor differences. The dust mass evolution of the fiducial model was most similar to that of the model with decreased dust condensation efficiencies, enabling more mass to be ejected in the gas phase. In fact, their dust masses were almost identical, while at the fiducial model produced about twice as much dust. This perhaps reduces the effect of large uncertainties in dust condensation efficiencies, especially for results at low redshift. For modelling at high redshift, metallicity-dependent condensation efficiencies (as in the one-zone model of Zhukovska, Gail & Trieloff, 2008) may have more of an impact.
In contrast, the model without dust growth deviated significantly from the fiducial run, and the dust mass increased by only a factor of four from to . The fiducial model and other models with growth enabled saw an increase in dust mass closer to one order of magnitude. This corroborates findings from earlier one-zone models and highlights the importance of dust growth at low redshift. We caution that more detailed growth mechanisms following one-zone models that take into account variations in dust grain sizes (Hirashita & Kuo, 2011; Asano et al., 2013b; Nozawa et al., 2015) and their impact on grain collision rates will offer a better assessment of the role dust growth plays in the ISM. Before , the difference between a model employing only stellar dust production and a model with both stellar production and ISM dust growth is minor, while both models yield more dust than in the fiducial run with destruction. However, by , the model lacking growth and destruction sees a final dust mass approximately two times smaller than that obtained by the model with growth but without destruction. Grain growth becomes increasingly important towards low redshift. This is consistent with the hypothesis that galaxies pass through a critical metallicity at which dust growth in the ISM dominates stellar production.
The run adopting a constant destruction timescale of for dust destruction, rather than the fiducial timescale computed locally using SN activity, behaves more like the model lacking any destruction whatsoever and overproduces dust at high redshift relative to the fiducial model. By , the constant destruction timescale run agrees well with the fiducial run. Dust models that globally adopt (e.g. the fiducial runs in Bekki, 2015a) may be overestimating a galaxy’s dust content by a factor of several at high redshift.
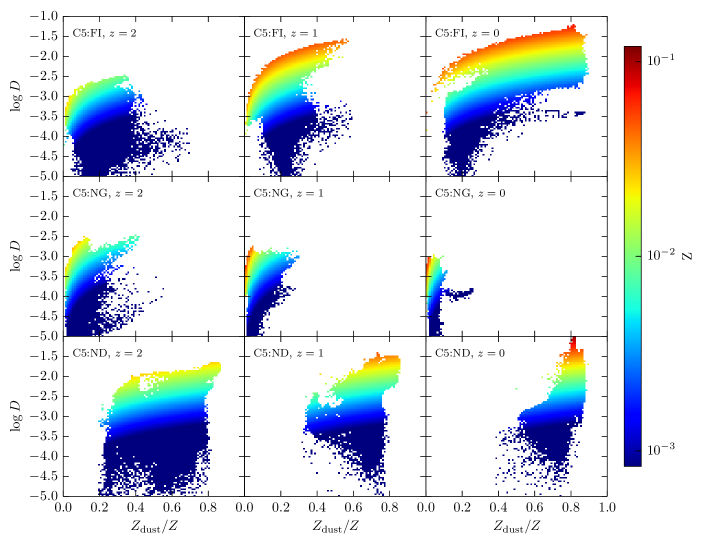
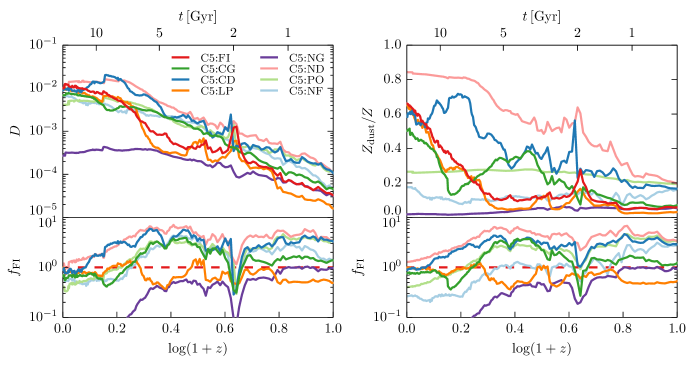
Figure 10 shows the dust-to-gas and dust-to-metal ratios for these dust model runs, using contributions from cells within the disc of the Aquarius C galaxy. Nearly all dust variations yield a dust-to-gas ratio within a factor of two of the fiducial value of . At high redshift, models without dust destruction display an increased dust-to-gas ratio. A dust model without growth results in a late time dust-to-gas ratio suppressed by over relative to the fiducial run. Without growth, the dust-to-gas ratio shows little evolution from its value at . The effect of limiting dust growth is much more severe than that of limiting grain destruction. Modelling work motivated by observations of SINGS galaxies and high redshift quasars has similarly predicted that dust growth and non-stellar dust production can have a pronounced impact on a galaxy’s dust content, while dust destruction is less influential (Draine, 2009; Michałowski et al., 2010; Valiante et al., 2011; Mattsson, Andersen & Munkhammar, 2012; Zafar & Watson, 2013; Rowlands et al., 2014).
Models without growth and without destruction produced the lowest and highest dust-to-metal ratios for , respectively. While the dust-to-metal ratio predicted by only allowing stellar production of dust is roughly and physically acceptable, it is nearly constant and displays little evolution. In contrast, both growth and destruction mechanisms are needed to capture the increase in dust-to-metal ratio expected at low redshift (Inoue, 2003), as in our fiducial model and the run with low dust condensation efficiencies. The extent to which the dust-to-metal ratio varies within a galaxy and among different galaxies is unclear (Mattsson, Andersen & Munkhammar, 2012), so it is difficult to assess whether our fiducial dust model yields a typical dust-to-metal ratio. In any case, from Figure 10 we can conclude that varying dust condensation efficiencies makes little difference to the dust-to-metal ratio evolution, and while adopting a constant destruction timescale instead of using local SNe-driven destruction leads to a higher dust-to-metal ratio at high redshift, the effect is nowhere near as severe as limiting dust growth or destruction.
In Figure 11 we plot the dust-to-gas ratio versus dust-to-metal ratio at , , and for every gas cell in the halo using the fiducial run, a model without dust growth, and a model without dust destruction. Given the importance of metallicity in regulating the transition between stellar production-dominated dust evolution and ISM-led dust growth, we also compute the mean metallicity for each region of dust-to-gas and dust-to-metal ratios. While the Aquarius C halo is fairly quiescent over this redshift range, we see qualitative differences between these three dust models with slight evolution over time.
At all redshifts, the fiducial model contains cells across a wide range of dust-to-metal ratio. Regions of larger dust-to-gas ratio tended to be more metal-rich, with the peak dust-to-gas ratio and metallicity increasing by roughly and , respectively, from to . In the fiducial model, low dust-to-gas ratios at were concentrated in cells with low dust-to-metal ratio. While one-zone dust models are incapable of producing such phase space plots, previous smoothed-particle hydrodynamical simulations have explored the relation between dust-to-gas and dust-to-metal ratios for fiducial dust parameters (Bekki, 2015a). While our results reproduce the overall increase in dust-to-gas ratio from to and roughly scatter in typical dust-to-gas ratio at , previous work finds nearly all gas cells concentrated in a narrow band of dust-to-metal ratio. We find moderate variation in the dust-to-metal ratio within the galaxy, results consistent with the visualisations in Figures 1 and 2.
In comparison, the models lacking growth and destruction mechanisms see less diversity among gas cells. The no growth model has for essentially every cell, with the typical dust-to-metal ratio decreasing towards . Conversely, the no destruction model sees for nearly all gas cells at and . Additionally, by , the model without destruction witnesses a peak dust-to-gas ratio roughly above that obtained in the no growth model. These results suggest that the presence of both growth and destruction mechanisms leads to more variation in the simulated dust content of galaxies.
4.4 Variations in the Initial Conditions
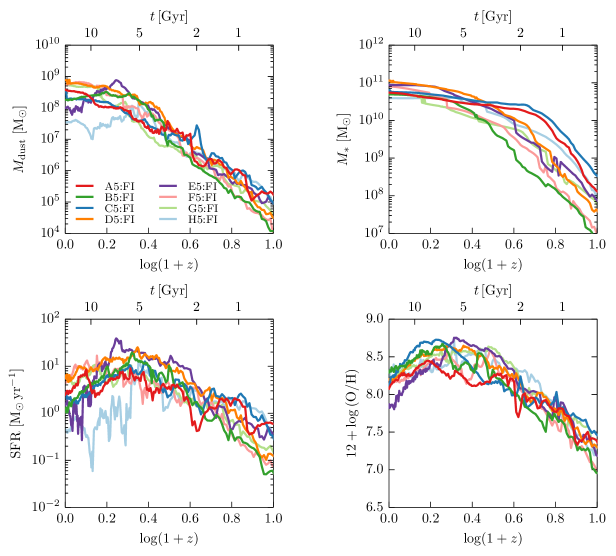
In the remainder of this work, we use the fiducial feedback and dust models to investigate the evolution of dust within our sample of eight Aquarius galaxies. Figure 12 shows the dust mass, stellar mass, SFR, and gas-phase metallicity for each of these galaxies as a function of redshift. These quantities exclude contributions from cells in the hot halo. The variation in galactic dust mass is largest at low redshift, with galaxies D and H producing dust masses of and , respectively, at . Changes in the dust content largely trace changes in the overall metal mass. We note that two of the galaxies with the largest dust and metal masses at high redshift, A and C, are known to have progenitors that assemble their mass more rapidly than the others (Wang et al., 2011). The SFRs for these galaxies cover the range at , and the galaxy that experiences the largest drop in SFR from to , galaxy E, also sees the largest decline in gas-phase metallicity. While decreased star formation produces fewer dust grains in the ISM, it also weakens SN-based grain destruction, ultimately enabling gas-phase depletion.
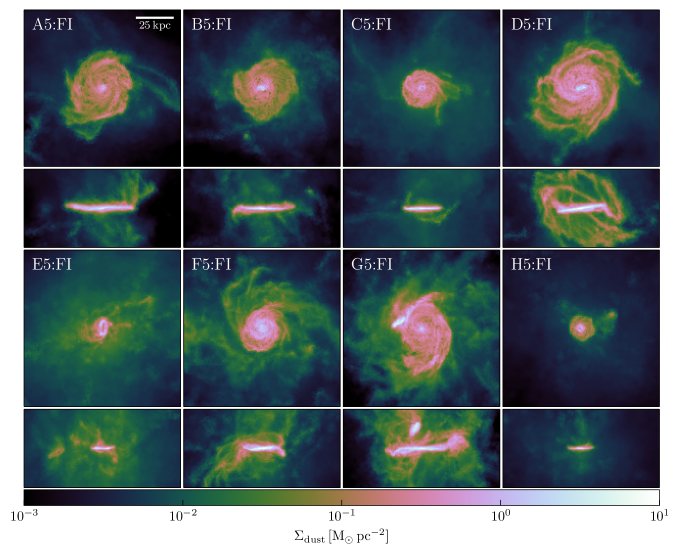
To further contrast these haloes, in Figure 13 we display face-on and edge-on dust surface density projections for the Aquarius sample at . These haloes are at various stages of galactic disc formation. In some cases, as for halo C, a quiescent disc of dust has formed with an abrupt drop in dust surface density when moving to the CGM. Other haloes, including D, F, and G, display much more spatial variation, especially off of the disc plane. In particular, halo G is perturbed by a satellite galaxy at (Marinacci, Pakmor & Springel, 2014). A dusty disc of comparable size was found in recent smoothed-particle hydrodynamical simulations of a halo (Bekki, 2015a), resembling our results for halo C. Furthermore, the diversity of dust surface densities that we see could impact the creation of synthetic galaxy images and spectra using spectral energy distribution modelling (Silva et al., 1998; Jonsson, 2006; Bernyk et al., 2014; Snyder et al., 2015; Torrey et al., 2015).
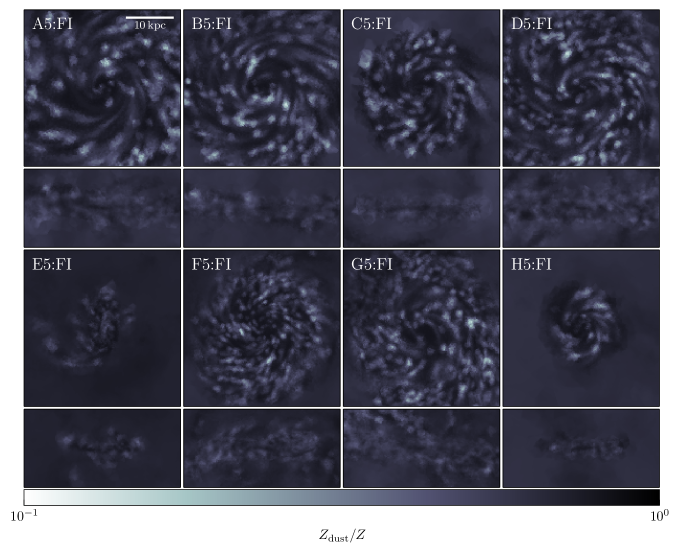
Figure 14 shows the projected dust-to-metal ratio of these haloes at and indicates that the dust-to-metal ratio exhibits fluctuations within the galactic disc. Analytical arguments suggest that dust-to-metal gradients can be used to estimate the relative strength of dust growth and destruction in the ISM, with flat dust-to-metal profiles expected in the absence of dust growth and destruction (Mattsson, Andersen & Munkhammar, 2012). Rather compact galaxies, as in haloes E and H, see less spatial variation in the dust-to-metal ratio than the larger galactic discs in Figure 13, which tend to have more pockets of low and high dust-to-metal ratio. Stellar density projections for the Aquarius suite have previously been made using the same physical model without dust (Marinacci, Pakmor & Springel, 2014) and show that depressions in dust-to-metal ratio are similar in size to regions of high stellar density. In particular, haloes A, C, F, and G have some of the largest stellar discs and also some of the most variation in dust-to-metal ratio. While our dust model does not properly account for thermal sputtering and grain-grain collisions in hot regions of the CGM, Figure 14 suggests the presence of noticeable dust-to-metal ratio fluctuations in Milky Way-mass galactic discs that trace stellar structure.
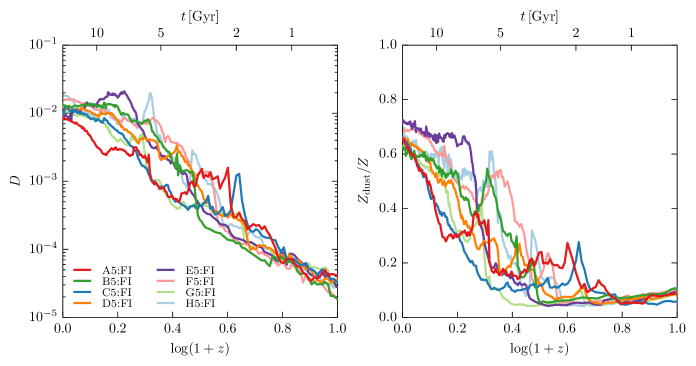
To investigate the dust-to-metal ratio evolution more quantitatively, in Figure 15 we plot the dust-to-gas and dust-to-metal ratios as a function of redshift for these galaxies. The dust-to-gas ratios tend to evolve in similar fashion, reaching Milky Way-like values of by . At , where A1689-zD1 has been observed to have a near-Galactic dust-to-gas ratio (Watson et al., 2015), the Aquarius suite of galaxies sees dust-to-gas ratios slightly under . Our results suggest that A1689-zD1 and other dusty high-redshift galaxies do not arise from Milky Way-like progenitors and motivate further study of the dust-to-gas ratio over a range of halo masses. Recent models predict that larger haloes see more dramatic growth in the dust-to-gas ratio towards low redshift and that smaller systems have less dynamic dust-to-gas ratios (Bekki, 2015a). A larger statistical sample of galaxies would also enable comparison to observed dust mass functions (Dunne et al., 2000, 2011).
The dust-to-metal ratios in Figure 15 display more diversity, with values ranging from roughly to . While high depletion has been observed for some elements, including Si, Mg, and Fe, in the local interstellar cloud (Kimura, Mann & Jessberger, 2003), this wouldn’t greatly change the overall dust-to-metal ratio. Estimates of the dust-to-metal ratio for typical galaxies, including the Milky Way and Magellanic Clouds, lie closer to (Aguirre, 1999; De Cia et al., 2013). All show an increase in dust-to-metal ratio from to , expected of galaxies (Inoue, 2003). Before , about half of galaxies display a flat dust-to-metal ratio near . However, there is some variation in when the Aquarius galaxies see the most growth in dust-to-metal ratio. Galaxies A and C, which assemble the majority of their mass more quickly than the others (Wang et al., 2011), show some of the earliest growth in dust-to-metal ratio, suggesting that accretion history may influence dust-to-metal ratio evolution.
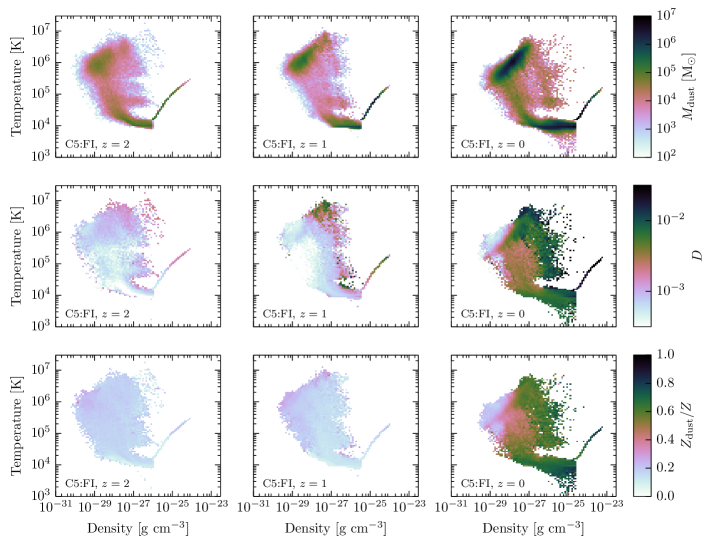
In Figure 16, we construct temperature-density phase diagrams for all gas cells within halo C at , , and . We analyze gas cells in three different ways: by total dust mass, by mass-weighted dust-to-gas ratio, and by mass-weighted dust-to-metal ratio. We note that from to dust mass becomes increasingly concentrated in hot, diffuse halo gas with and dense, star-forming ISM gas with near the equation of state transition. By contrast, the phase diagram region with has a total dust mass largely unchanged with redshift. While SDSS data do suggest that the dust masses of galactic haloes are similar to those found in galactic discs (Ménard et al., 2010), the results in Figure 16 also motivate better modelling of dust evolution in the diffuse halo where grains may travel at higher velocities, have lower sticking efficiencies when impacting gas-phase metals, and undergo grain-grain collisions. Thus, it is likely that the halo dust mass is overstated, especially at , but we still expect the presence of dust beyond the galactic disc.
Dust-to-gas ratios tend to increase from to most rapidly in high-density regions. Gas density correlates more strongly with average dust-to-gas ratio than does temperature. We see a similar trend in dust-to-metal ratio, as dense gas above the equation of state transition sees its dust-to-metal ratio increase from roughly to over this redshift range. In contrast, low-density gas with barely changes in dust-to-metal ratio. This result is physically justified, since the dust growth timescale is shortest in high-density gas, and agrees with observations of elemental depletions increasing with gas density (Jenkins, 2009).
In Figure 17, we display the radial dust surface density profiles for each of the Aquarius haloes at . There is fairly little evolution from to , although the growth in virial radius causes out to by . These Milky Way-sized haloes have dust profiles fairly consistent with observations of M31, with higher normalisations in the inner disc. The Aquarius haloes tend to show rather sharp drops in dust surface density when moving outside of the galactic disc: for example, halo C witnesses a decline of almost an order of magnitude in near , although it is not as sharp as the drop seen for M31. The Aquarius haloes have dust profiles that decay from to in rough agreement with the observed scaling seen in SDSS data (Ménard et al., 2010).
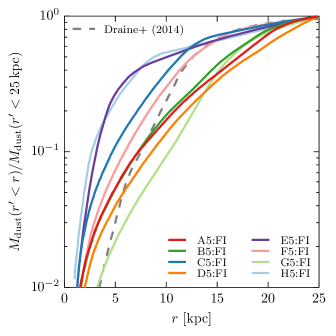
In Figure 18 we compare the cumulative dust mass distributions for the Aquarius galaxies with the observed distribution for M31 (Draine et al., 2014), normalising to the total dust mass within a radial distance of from galactic center. We do not necessarily expect the Aquarius suite to have cumulative dust mass distributions identical to that of M31 but use these observational data for guiding purposes. The Aquarius haloes witness a slightly steeper enclosed dust mass distribution for than is observed for M31, but the simulated and observed distributions are in rough agreement. In particular, we find in the Aquarius sample that the dust masses enclosed within are between 9 and 54 per cent of the total dust mass within . For comparison, the observed value for M31 is about 25 per cent (Draine et al., 2014) and recent smoothed-particle hydrodynamical simulations using a Milky Way-sized halo with dust growth mechanism similar to ours found that roughly 18 per cent of the dust mass inside of is contained within the innermost (Bekki, 2015a).
4.5 Scaling Relations
To better understand how realistically our sample of eight Aquarius galaxies produce dust, we compare against a number of empirical scaling relations seen in recent observations (Draine et al., 2007; Galametz et al., 2011; Kennicutt et al., 2011; Corbelli et al., 2012; Cortese et al., 2012; Rémy-Ruyer et al., 2014). These scalings enable valuable predictions about the dust content in very metal-poor galaxies (Fisher et al., 2014) and high-redshift, dusty quasars (Fan et al., 2003; Bertoldi et al., 2003; Valiante et al., 2009). Also, these relations help determine the quantities that most effectively trace the presence of dust in galaxies. One of the most prominent of these scalings is the dust-metallicity relation, which finds a dust-to-gas ratio that scales fairly linearly with metallicity (Draine et al., 2007; Galametz et al., 2011; Kennicutt et al., 2011; Rémy-Ruyer et al., 2014) and is often used to estimate the dust mass within a galaxy. It is therefore interesting to consider such scaling relations and to investigate any variations in our Aquarius sample. In the observational comparisons below, we compute all quantities using dense ISM gas, as determined by the cut in temperature-density phase space of all gas cells belonging to the main halo group given by Equation (10). This cut isolates the galactic disc and thus ignores the effect of dust growth in the CGM that is possibly too strong.
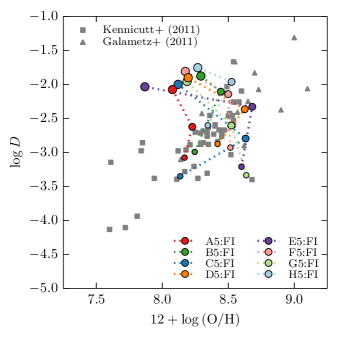
We first show the dust-metallicity relation for the Aquarius galaxies in Figure 19, plotting dust-to-gas ratio versus gas-phase metallicity at , , and , with the gas-phase metallicity calculated from oxygen and hydrogen abundances. As in Figure 6, we compare against observational data from Kennicutt et al. (2011) and Galametz et al. (2011). Previous models have been fairly successful at reproducing the dust-metallicity relation (Dwek, 1998; Lisenfeld & Ferrara, 1998; Calura, Pipino & Matteucci, 2008; Bekki, 2015a; Feldmann, 2015) and have investigated the nature and scatter of this relation at low metallicity (Rémy-Ruyer et al., 2014). In comparison to several models that see a strictly monotonic increase in dust-to-gas ratio and gas-phase metallicity towards low redshift (Lisenfeld & Ferrara, 1998; Bekki, 2015a; Feldmann, 2015), the Aquarius haloes display more diverse redshift evolution while remaining in agreement with the observed dust-metallicity relation at and . While the data for capture the positive correlation between dust-to-gas ratio and gas-phase metallicity, they tend to lie above the observed relation, as in Figure 6.
While some haloes, like A and B, display small drops in gas-phase metallicity from to , others show much more pronounced behaviour. In particular, haloes C and E have some of the largest declines in SFR from to in our sample, weakening grain destruction and enhancing depletion of gas-phase metals. Given that the temperature-density cut used to isolate dense gas in the galactic disc will minimise the influence of dust in the CGM, Figure 19 suggests that the dust-metallicity relation can evolve in a non-monotonic fashion even near the galactic center. However, the behaviour at together with fairly high dust-to-metal ratios in Figure 15 indicate that gas-phase metals may be too heavily depleted at low redshift. Additionally, while there is evidence for a dust-metallicity relation that is less steep for metallicities below 8.0 (Rémy-Ruyer et al., 2014), suggesting that the global dust-metallicity trend cannot be fit by a single power law, the Aquarius galactic disc gas-phase metallicities lie above this region. Future simulations of full cosmological volumes will allow us to explore the dust-metallicity scaling at low metallicity.
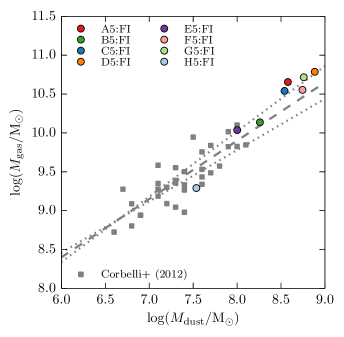
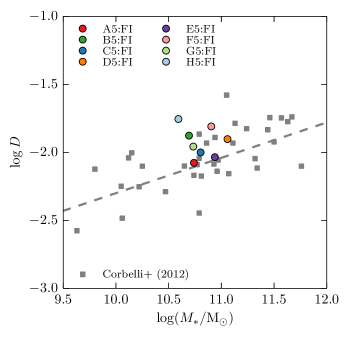
In Figure 20, we compare the dust mass-gas mass scaling seen for our Aquarius suite with observations of metal-rich galaxies from the Herschel Virgo Cluster Survey (Corbelli et al., 2012). These observational data found the best fit scaling , suggesting that the dust-to-gas ratio increases weakly with gas mass. That is, the presence of additional gas leads to increased star formation, which in turn produces enough dust to cause the dust-to-gas ratio to rise. We find that the Aquarius data obey a slightly steeper scaling of gas mass with dust mass, consistent with the results in Figure 15 showing fairly little variation in the dust-to-gas ratio in our sample. However, the Aquarius haloes tend to be more gas- and dust-rich than those from the Herschel Virgo Cluster Survey, and future work should investigate whether our observed scaling holds for lower mass systems.
The Herschel Virgo Cluster Survey also investigated the relationship between dust-to-gas ratio and stellar mass, observing the weak scaling . This scaling is possibly weak because increased star formation injects more dust into the ISM through stellar production but also leads to SNe destroying dust more rapidly. In Figure 21, we compare the data from the Aquarius suite with the Herschel scaling and find the Aquarius data to lie close to the observed best fit. While the Aquarius haloes show a scatter in dust-to-gas ratio that roughly matches that seen in the Herschel data, our haloes do not cover the full range of stellar masses observed by Herschel.
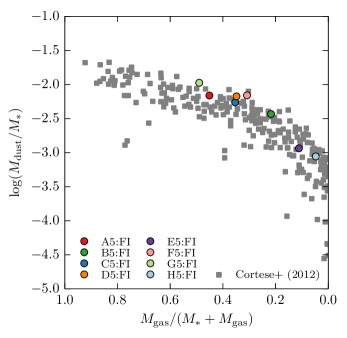
In Figure 22, we compare the observed scaling between dust-to-stellar mass ratio and gas fraction () seen in Herschel Reference Survey data (Cortese et al., 2012) with results from our Aquarius sample. The dust-to-stellar mass ratio is expected to anti-correlate with stellar mass and decrease from late- to early-type galaxies (Cortese et al., 2012). Late-type galaxies with high gas fraction see more efficient stellar injection of dust, while early-type galaxies are more influenced by grain destruction. The Aquarius suite is in good agreement with the observed dust-to-stellar mass ratio scaling, covering a range of gas fractions from less than to .
While the Aquarius haloes compare favorably to these dust scaling relations at , in the future we would like to perform similar analyses for multiple epochs. There are estimates of the dust mass function for (Dunne et al., 2011) and for high-redshift submillimetre sources (Dunne, Eales & Edmunds, 2003). The relation between dust mass, SFR, and stellar mass has also been studied out to (Santini et al., 2014). These scalings would be interesting in part because our Aquarius haloes displayed more diversity at high redshift than at .
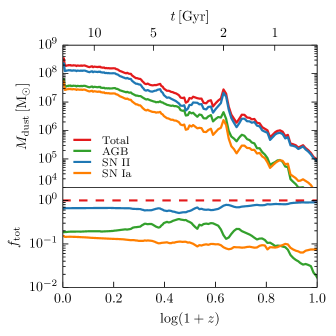
Especially at high redshift, it is important to understand the relative dust production strengths of SNe and AGB stars, since this helps determine whether dusty galaxies and quasars could have dust content driven by stellar sources as opposed to interstellar dust growth. Chemical evolution models suggest that AGB stars played an important role in forming the large dust mass of SDSS J1148+5251 at , possibly contributing over half of the observed dust (Valiante et al., 2009). Observations of dust in the ejecta of SNe fall short of the or more a SN needs to produce in order to explain the dust content of SDSS J1148+5251 (Todini & Ferrara, 2001; Sugerman et al., 2006; Dwek, Galliano & Jones, 2007; Lau et al., 2015), and if SNe are not dominant producers of dust, high SFRs might be needed to form dusty galaxies (Morgan & Edmunds, 2003; Santini et al., 2014). Given that the progenitors of AGB stars take longer to evolve off of the main sequence than SNe, it is unclear whether AGB stars can have a large impact at high redshift. In Figure 23, we compare the dust mass contributions of SNe Ia, SNe II, and AGB stars for the Aquarius C galaxy as a function of redshift. We see that 80 per cent or more of dust originated in SNe II for , with the contribution from AGB stars peaking at roughly 40 per cent for . Recent investigation of the Small Magellanic Cloud suggests that even at low redshift AGB stars are not dominant producers of dust (Boyer et al., 2012). In this Aquarius galaxy, we see that by about 20 per cent of dust has its origins in AGB stars. While future work is needed to investigate how these stellar contributions vary with galaxy stellar mass and metallicity, in our sample of Milky Way-sized galaxies we find SNe to be the dominant producers of dust.
5 Discussion and Conclusions
We have implemented a first very basic dust model in the moving-mesh code arepo, adding to the existing galaxy formation physics. Our dust model accounts for local stellar production of dust, growth in the ISM due to accretion of gas-phase metals, destruction via SN shocks, and dust driven by stellar feedback winds. Dust is also passively advected between gas cells. We track dust in individual chemical species as well as follow contributions from AGB stars, SNe Ia, and SNe II.
Using this dust model, we performed cosmological zoom-in simulations of the Aquarius suite of eight haloes with the goal of understanding how dust forms in Milky Way-sized systems. After investigating the effect of feedback and the strength of various dust model components, we used the full sample of Aquarius haloes to compare to a range of dust observations at low redshift. We summarise our main findings as follows.
-
1.
Variations in stellar and AGN feedback impact the predictions made by our dust model. The absence of any feedback led to a dust-to-metal ratio of for one Aquarius galaxy, roughly a factor of three lower than the value predicted by our fiducial feedback model. Excluding feedback led to high star formation and more efficient supernova-based dust destruction. On the other hand, a model with fast stellar feedback-driven winds helped sweep dust away from the galactic center and enhance depletion of gas-phase metals due to weakened star formation, raising the halo-wide dust-to-metal ratio to over .
-
2.
Allowing gas-phase metals to deplete onto dust grains and not contribute to metal-line cooling has the potential to affect gas-phase metallicity. We see a difference in halo gas-phase metallicity between runs with and without dust of roughly at . This result also motivates the future inclusion of dust cooling channels.
-
3.
In the absence of dust growth, dust-to-gas and dust-to-metal ratios are suppressed by more than an order of magnitude at from the values predicted by our fiducial model with dust growth and destruction mechanisms. Without growth, we obtain a dust-to-gas ratio of for one Milky Way-like galaxy, below the Galactic value of roughly , and a dust-to-metal ratio . The differences between the fiducial model and no dust growth model are noticeable for .
-
4.
For , the dust mass and dust-to-gas ratio produced by a model adopting a constant dust destruction timescale of are largely indistinguishable from those produced by a model with no dust destruction. By , the constant destruction timescale model yields results similar to those from the fiducial model with local SNe-based dust destruction. At , the model with constant destruction timescale produces a dust mass in the galactic disc with a dust-to-gas ratio .
-
5.
The Aquarius haloes form dusty galactic discs with typical surface densities . The inclusion of thermal sputtering and grain-grain collisions would likely reduce the dust-to-metal ratios seen in the CGM. Dust-to-gas ratios for these Milky Way-like galaxies increase by roughly an order of magnitude from to and cover the range at .
-
6.
The predicted ISM dust content of the Aquarius haloes is consistent with a number of observed scaling relations at , including scalings between dust mass and gas mass, dust-to-gas ratio and stellar mass, and dust-to-stellar mass ratio and gas fraction. While the overall trend of the dust-metallicity relation is reproduced over at and , the Aquarius galaxies do not evolve along strictly monotonic tracks from to .
-
7.
Our dust model tracks contributions from individual chemical species, but additional physics is needed to capture differences between silicate and graphite grain types. As shown in Figure 24, currently silicate and graphite grains are distributed in essentially the same manner. While we may expect slight variations, given that AGB stars and SNe produce dust of different compositions and the dust originating from SNe may be more readily destroyed in SN shocks, future work should include starlight-driven radiation pressure on dust grains. Given that the dust composition will impact the grain size distribution (Mathis, Rumpl & Nordsieck, 1977; Kim, Martin & Hendry, 1994) and radiation pressure is suggested to be important in simulations treating dust (Murray, Quataert & Thompson, 2005; Bekki, 2015b), this physics may help differentiate between silicate and graphite grains.
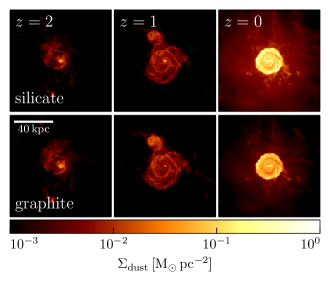
While our current dust model is fairly passive and simplistic, it reproduces a number of observed dust scaling relations surprisingly well at low redshift and is a step towards a more complete treatment of dust in cosmological galaxy formation simulations. In the future, we can explore a live dust model that includes dust-gas interactions more directly, enables dust cooling channels, and allows for radiative forces to affect the motion of grains. Together with simulations of full cosmological volumes, this work will lead to a better understanding of the full diversity of dust seen in the Universe.
Acknowledgements
We thank Lia Corrales, Christopher Hayward, Alexander Ji, Rahul Kannan, Federico Marinacci, Diego Muñoz, and Gregory Snyder for helpful discussion and Volker Springel for making arepo available. We are also grateful to the anonymous referee for comments that improved this manuscript.
The simulations were performed on the joint MIT-Harvard computing cluster supported by MKI and FAS. RM acknowledges support from the DOE CSGF under grant number DE-FG02-97ER25308. MV acknowledges support through an MIT RSC award.
References
- Aguirre (1999) Aguirre A., 1999, ApJ, 525, 583
- Asano et al. (2013a) Asano R. S., Takeuchi T. T., Hirashita H., Inoue A. K., 2013a, Earth, Planets, and Space, 65, 213
- Asano et al. (2013b) Asano R. S., Takeuchi T. T., Hirashita H., Nozawa T., 2013b, MNRAS, 432, 637
- Barlow (1978) Barlow M. J., 1978, MNRAS, 183, 367
- Barsella et al. (1989) Barsella B., Ferrini F., Greenberg J. M., Aiello S., 1989, A&A, 209, 349
- Bekki (2013) Bekki K., 2013, MNRAS, 432, 2298
- Bekki (2015a) Bekki K., 2015a, ApJ, 799, 166
- Bekki (2015b) Bekki K., 2015b, MNRAS, 449, 1625
- Bernyk et al. (2014) Bernyk M. et al., 2014, ArXiv e-prints, 1403.5270
- Bertoldi et al. (2003) Bertoldi F., Carilli C. L., Cox P., Fan X., Strauss M. A., Beelen A., Omont A., Zylka R., 2003, A&A, 406, L55
- Bianchi & Ferrara (2005) Bianchi S., Ferrara A., 2005, MNRAS, 358, 379
- Bianchi & Schneider (2007) Bianchi S., Schneider R., 2007, MNRAS, 378, 973
- Boselli et al. (2010) Boselli A. et al., 2010, PASP, 122, 261
- Bouché et al. (2007) Bouché N., Lehnert M. D., Aguirre A., Péroux C., Bergeron J., 2007, MNRAS, 378, 525
- Bouwens et al. (2012) Bouwens R. J. et al., 2012, ApJ, 754, 83
- Boyer et al. (2012) Boyer M. L. et al., 2012, ApJ, 748, 40
- Boylan-Kolchin et al. (2009) Boylan-Kolchin M., Springel V., White S. D. M., Jenkins A., Lemson G., 2009, MNRAS, 398, 1150
- Caffau et al. (2011) Caffau E. et al., 2011, Nature, 477, 67
- Calura, Pipino & Matteucci (2008) Calura F., Pipino A., Matteucci F., 2008, A&A, 479, 669
- Calzetti et al. (2000) Calzetti D., Armus L., Bohlin R. C., Kinney A. L., Koornneef J., Storchi-Bergmann T., 2000, ApJ, 533, 682
- Calzetti, Kinney & Storchi-Bergmann (1994) Calzetti D., Kinney A. L., Storchi-Bergmann T., 1994, ApJ, 429, 582
- Cantalupo (2010) Cantalupo S., 2010, MNRAS, 403, L16
- Caselli, Hartquist & Havnes (1997) Caselli P., Hartquist T. W., Havnes O., 1997, A&A, 322, 296
- Casey, Narayanan & Cooray (2014) Casey C. M., Narayanan D., Cooray A., 2014, Phys. Rep., 541, 45
- Chabrier (2003) Chabrier G., 2003, PASP, 115, 763
- Cherchneff (2010) Cherchneff I., 2010, in Astronomical Society of the Pacific Conference Series, Vol. 425, Hot and Cool: Bridging Gaps in Massive Star Evolution, Leitherer C., Bennett P. D., Morris P. W., Van Loon J. T., eds., p. 237
- Corbelli et al. (2012) Corbelli E. et al., 2012, A&A, 542, A32
- Corrales & Paerels (2012) Corrales L., Paerels F., 2012, ApJ, 751, 93
- Cortese et al. (2012) Cortese L. et al., 2012, A&A, 540, A52
- da Cunha et al. (2010) da Cunha E., Eminian C., Charlot S., Blaizot J., 2010, MNRAS, 403, 1894
- De Cia et al. (2013) De Cia A., Ledoux C., Savaglio S., Schady P., Vreeswijk P. M., 2013, A&A, 560, A88
- Dey et al. (1999) Dey A., Graham J. R., Ivison R. J., Smail I., Wright G. S., Liu M. C., 1999, ApJ, 519, 610
- Dijkstra & Loeb (2009) Dijkstra M., Loeb A., 2009, MNRAS, 397, 1976
- Dominik & Tielens (1997) Dominik C., Tielens A. G. G. M., 1997, ApJ, 480, 647
- Dopcke et al. (2013) Dopcke G., Glover S. C. O., Clark P. C., Klessen R. S., 2013, ApJ, 766, 103
- Draine (1990) Draine B. T., 1990, in Astronomical Society of the Pacific Conference Series, Vol. 12, The Evolution of the Interstellar Medium, Blitz L., ed., pp. 193–205
- Draine (2003) Draine B. T., 2003, ARA&A, 41, 241
- Draine (2009) Draine B. T., 2009, in Astronomical Society of the Pacific Conference Series, Vol. 414, Cosmic Dust - Near and Far, Henning T., Grün E., Steinacker J., eds., p. 453
- Draine et al. (2014) Draine B. T. et al., 2014, ApJ, 780, 172
- Draine et al. (2007) Draine B. T. et al., 2007, ApJ, 663, 866
- Draine & Salpeter (1979a) Draine B. T., Salpeter E. E., 1979a, ApJ, 231, 438
- Draine & Salpeter (1979b) Draine B. T., Salpeter E. E., 1979b, ApJ, 231, 77
- Dunne et al. (2000) Dunne L., Eales S., Edmunds M., Ivison R., Alexander P., Clements D. L., 2000, MNRAS, 315, 115
- Dunne, Eales & Edmunds (2003) Dunne L., Eales S. A., Edmunds M. G., 2003, MNRAS, 341, 589
- Dunne et al. (2011) Dunne L. et al., 2011, MNRAS, 417, 1510
- Dwek (1998) Dwek E., 1998, ApJ, 501, 643
- Dwek, Galliano & Jones (2007) Dwek E., Galliano F., Jones A. P., 2007, ApJ, 662, 927
- Dwek & Scalo (1980) Dwek E., Scalo J. M., 1980, ApJ, 239, 193
- Eales et al. (2010) Eales S. et al., 2010, PASP, 122, 499
- Fan et al. (2003) Fan X. et al., 2003, AJ, 125, 1649
- Feldmann (2015) Feldmann R., 2015, MNRAS, 449, 3274
- Ferrarotti & Gail (2006) Ferrarotti A. S., Gail H.-P., 2006, A&A, 447, 553
- Fisher et al. (2014) Fisher D. B. et al., 2014, Nature, 505, 186
- Galametz et al. (2011) Galametz M., Madden S. C., Galliano F., Hony S., Bendo G. J., Sauvage M., 2011, A&A, 532, A56
- Gall, Andersen & Hjorth (2011a) Gall C., Andersen A. C., Hjorth J., 2011a, A&A, 528, A13
- Gall, Andersen & Hjorth (2011b) Gall C., Andersen A. C., Hjorth J., 2011b, A&A, 528, A14
- Gall, Hjorth & Andersen (2011) Gall C., Hjorth J., Andersen A. C., 2011, A&ARv, 19, 43
- Gehrz (1989) Gehrz R., 1989, in IAU Symposium, Vol. 135, Interstellar Dust, Allamandola L. J., Tielens A. G. G. M., eds., p. 445
- Genel et al. (2014) Genel S. et al., 2014, MNRAS, 445, 175
- Gilmore, Wyse & Kuijken (1989) Gilmore G., Wyse R. F. G., Kuijken K., 1989, ARA&A, 27, 555
- Gnedin & Hollon (2012) Gnedin N. Y., Hollon N., 2012, ApJS, 202, 13
- Gomez et al. (2012) Gomez H. L. et al., 2012, MNRAS, 420, 3557
- Gordon et al. (2014) Gordon K. D. et al., 2014, ApJ, 797, 85
- Hayward et al. (2013) Hayward C. C., Narayanan D., Kereš D., Jonsson P., Hopkins P. F., Cox T. J., Hernquist L., 2013, MNRAS, 428, 2529
- Hinshaw et al. (2013) Hinshaw G. et al., 2013, ApJS, 208, 19
- Hirashita (1999) Hirashita H., 1999, A&A, 344, L87
- Hirashita (2000) Hirashita H., 2000, PASJ, 52, 585
- Hirashita & Ferrara (2002) Hirashita H., Ferrara A., 2002, MNRAS, 337, 921
- Hirashita & Kuo (2011) Hirashita H., Kuo T.-M., 2011, MNRAS, 416, 1340
- Hollenbach & Salpeter (1971) Hollenbach D., Salpeter E. E., 1971, ApJ, 163, 155
- Hughes, Dunlop & Rawlings (1997) Hughes D. H., Dunlop J. S., Rawlings S., 1997, MNRAS, 289, 766
- Inoue (2003) Inoue A. K., 2003, PASJ, 55, 901
- Inoue (2011) Inoue A. K., 2011, Earth, Planets, and Space, 63, 1027
- Inoue & Kamaya (2003) Inoue A. K., Kamaya H., 2003, MNRAS, 341, L7
- Issa, MacLaren & Wolfendale (1990) Issa M. R., MacLaren I., Wolfendale A. W., 1990, A&A, 236, 237
- Jenkins (2004) Jenkins E. B., 2004, Origin and Evolution of the Elements, 336
- Jenkins (2009) Jenkins E. B., 2009, ApJ, 700, 1299
- Jones & Nuth (2011) Jones A. P., Nuth J. A., 2011, A&A, 530, A44
- Jones, Tielens & Hollenbach (1996) Jones A. P., Tielens A. G. G. M., Hollenbach D. J., 1996, ApJ, 469, 740
- Jones et al. (1994) Jones A. P., Tielens A. G. G. M., Hollenbach D. J., McKee C. F., 1994, ApJ, 433, 797
- Jonsson (2006) Jonsson P., 2006, MNRAS, 372, 2
- Kanekar et al. (2013) Kanekar N., Wagg J., Ram Chary R., Carilli C. L., 2013, ApJL, 771, L20
- Kannan et al. (2014) Kannan R. et al., 2014, MNRAS, 437, 2882
- Karakas (2010) Karakas A. I., 2010, MNRAS, 403, 1413
- Kennicutt et al. (2011) Kennicutt R. C. et al., 2011, PASP, 123, 1347
- Kennicutt et al. (2003) Kennicutt, Jr. R. C. et al., 2003, PASP, 115, 928
- Kim, Martin & Hendry (1994) Kim S.-H., Martin P. G., Hendry P. D., 1994, ApJ, 422, 164
- Kimm & Cen (2013) Kimm T., Cen R., 2013, ApJ, 776, 35
- Kimura, Mann & Jessberger (2003) Kimura H., Mann I., Jessberger E. K., 2003, ApJ, 582, 846
- Klessen, Glover & Clark (2012) Klessen R. S., Glover S. C. O., Clark P. C., 2012, MNRAS, 421, 3217
- Krumholz, Leroy & McKee (2011) Krumholz M. R., Leroy A. K., McKee C. F., 2011, ApJ, 731, 25
- Kwok (1975) Kwok S., 1975, ApJ, 198, 583
- Lau et al. (2015) Lau R. M., Herter T. L., Morris M. R., Li Z., Adams J. D., 2015, Science, 348, 413
- Li & Draine (2001) Li A., Draine B. T., 2001, ApJ, 554, 778
- Lisenfeld & Ferrara (1998) Lisenfeld U., Ferrara A., 1998, ApJ, 496, 145
- Madden et al. (2013) Madden S. C. et al., 2013, PASP, 125, 600
- Mancini et al. (2015) Mancini M., Schneider R., Graziani L., Valiante R., Dayal P., Maio U., Ciardi B., Hunt L. K., 2015, MNRAS, 451, L70
- Marinacci, Pakmor & Springel (2014) Marinacci F., Pakmor R., Springel V., 2014, MNRAS, 437, 1750
- Mathis (1990) Mathis J. S., 1990, ARA&A, 28, 37
- Mathis, Rumpl & Nordsieck (1977) Mathis J. S., Rumpl W., Nordsieck K. H., 1977, ApJ, 217, 425
- Mattsson, Andersen & Munkhammar (2012) Mattsson L., Andersen A. C., Munkhammar J. D., 2012, MNRAS, 423, 26
- Mattsson et al. (2014) Mattsson L., De Cia A., Andersen A. C., Zafar T., 2014, MNRAS, 440, 1562
- McKee (1989) McKee C., 1989, in IAU Symposium, Vol. 135, Interstellar Dust, Allamandola L. J., Tielens A. G. G. M., eds., p. 431
- Meikle et al. (2007) Meikle W. P. S. et al., 2007, ApJ, 665, 608
- Melbourne et al. (2012) Melbourne J. et al., 2012, AJ, 143, 125
- Ménard et al. (2010) Ménard B., Scranton R., Fukugita M., Richards G., 2010, MNRAS, 405, 1025
- Michałowski (2015) Michałowski M. J., 2015, A&A, 577, A80
- Michałowski et al. (2010) Michałowski M. J., Murphy E. J., Hjorth J., Watson D., Gall C., Dunlop J. S., 2010, A&A, 522, A15
- Morgan & Edmunds (2003) Morgan H. L., Edmunds M. G., 2003, MNRAS, 343, 427
- Murray, Quataert & Thompson (2005) Murray N., Quataert E., Thompson T. A., 2005, ApJ, 618, 569
- Nanni et al. (2013) Nanni A., Bressan A., Marigo P., Girardi L., 2013, MNRAS, 434, 2390
- Narayanan et al. (2010) Narayanan D. et al., 2010, MNRAS, 407, 1701
- Netzer et al. (2007) Netzer H. et al., 2007, ApJ, 666, 806
- Nozawa et al. (2015) Nozawa T., Asano R. S., Hirashita H., Takeuchi T. T., 2015, MNRAS, 447, L16
- Nozawa et al. (2007) Nozawa T., Kozasa T., Habe A., Dwek E., Umeda H., Tominaga N., Maeda K., Nomoto K., 2007, ApJ, 666, 955
- Nozawa et al. (2003) Nozawa T., Kozasa T., Umeda H., Maeda K., Nomoto K., 2003, ApJ, 598, 785
- Nozawa et al. (2011) Nozawa T., Maeda K., Kozasa T., Tanaka M., Nomoto K., Umeda H., 2011, ApJ, 736, 45
- Ostriker & Silk (1973) Ostriker J., Silk J., 1973, ApJL, 184, L113
- Ouchi et al. (2013) Ouchi M. et al., 2013, ApJ, 778, 102
- Pappalardo et al. (2012) Pappalardo C. et al., 2012, A&A, 545, A75
- Peek, Ménard & Corrales (2015) Peek J. E. G., Ménard B., Corrales L., 2015, ApJ, 813, 7
- Peeples et al. (2014) Peeples M. S., Werk J. K., Tumlinson J., Oppenheimer B. D., Prochaska J. X., Katz N., Weinberg D. H., 2014, ApJ, 786, 54
- Pei (1992) Pei Y. C., 1992, ApJ, 395, 130
- Petric et al. (2006) Petric A., Telis G. A., Paerels F., Helfand D. J., 2006, ApJ, 651, 41
- Planck Collaboration et al. (2014) Planck Collaboration et al., 2014, A&A, 571, A16
- Portinari, Chiosi & Bressan (1998) Portinari L., Chiosi C., Bressan A., 1998, A&A, 334, 505
- Rémy-Ruyer et al. (2014) Rémy-Ruyer A. et al., 2014, A&A, 563, A31
- Rho et al. (2008) Rho J. et al., 2008, ApJ, 673, 271
- Rho et al. (2009) Rho J., Reach W. T., Tappe A., Hwang U., Slavin J. D., Kozasa T., Dunne L., 2009, ApJ, 700, 579
- Riechers et al. (2014) Riechers D. A. et al., 2014, ApJ, 796, 84
- Roche & Aitken (1985) Roche P. F., Aitken D. K., 1985, MNRAS, 215, 425
- Roman-Duval et al. (2014) Roman-Duval J. et al., 2014, ApJ, 797, 86
- Rowlands et al. (2014) Rowlands K., Gomez H. L., Dunne L., Aragón-Salamanca A., Dye S., Maddox S., da Cunha E., van der Werf P., 2014, MNRAS, 441, 1040
- Santini et al. (2014) Santini P. et al., 2014, A&A, 562, A30
- Scannapieco et al. (2012) Scannapieco C. et al., 2012, MNRAS, 423, 1726
- Schneider et al. (2006) Schneider R., Omukai K., Inoue A. K., Ferrara A., 2006, MNRAS, 369, 1437
- Schneider et al. (2014) Schneider R., Valiante R., Ventura P., dell’Agli F., Di Criscienzo M., Hirashita H., Kemper F., 2014, MNRAS, 442, 1440
- Seab (1987) Seab C. G., 1987, in Astrophysics and Space Science Library, Vol. 134, Interstellar Processes, Hollenbach D. J., Thronson Jr. H. A., eds., pp. 491–512
- Seab & Shull (1983) Seab C. G., Shull J. M., 1983, ApJ, 275, 652
- Sembach & Savage (1996) Sembach K. R., Savage B. D., 1996, ApJ, 457, 211
- Silva et al. (1998) Silva L., Granato G. L., Bressan A., Danese L., 1998, ApJ, 509, 103
- Silvia, Smith & Shull (2010) Silvia D. W., Smith B. D., Shull J. M., 2010, ApJ, 715, 1575
- Snyder et al. (2015) Snyder G. F., Lotz J., Moody C., Peth M., Freeman P., Ceverino D., Primack J., Dekel A., 2015, MNRAS, 451, 4290
- Sodroski et al. (1997) Sodroski T. J., Odegard N., Arendt R. G., Dwek E., Weiland J. L., Hauser M. G., Kelsall T., 1997, ApJ, 480, 173
- Somerville et al. (2012) Somerville R. S., Gilmore R. C., Primack J. R., Domínguez A., 2012, MNRAS, 423, 1992
- Sparre et al. (2014) Sparre M. et al., 2014, ApJ, 785, 150
- Spoon et al. (2007) Spoon H. W. W., Marshall J. A., Houck J. R., Elitzur M., Hao L., Armus L., Brandl B. R., Charmandaris V., 2007, ApJL, 654, L49
- Springel (2005) Springel V., 2005, MNRAS, 364, 1105
- Springel (2010) Springel V., 2010, MNRAS, 401, 791
- Springel & Hernquist (2003) Springel V., Hernquist L., 2003, MNRAS, 339, 289
- Springel et al. (2008) Springel V. et al., 2008, MNRAS, 391, 1685
- Springel et al. (2005) Springel V. et al., 2005, Nature, 435, 629
- Springel et al. (2001) Springel V., White S. D. M., Tormen G., Kauffmann G., 2001, MNRAS, 328, 726
- Sugerman et al. (2006) Sugerman B. E. K. et al., 2006, Science, 313, 196
- Tchernyshyov et al. (2015) Tchernyshyov K., Meixner M., Seale J., Fox A., Friedman S. D., Dwek E., Galliano F., 2015, ApJ, 811, 78
- Theis & Orlova (2004) Theis C., Orlova N., 2004, A&A, 418, 959
- Thielemann et al. (2003) Thielemann F.-K. et al., 2003, in From Twilight to Highlight: The Physics of Supernovae, Hillebrandt W., Leibundgut B., eds., p. 331
- Tielens & Allamandola (1987) Tielens A. G. G. M., Allamandola L. J., 1987, in NATO ASIC Proc. 210: Physical Processes in Interstellar Clouds, Morfill G. E., Scholer M., eds., pp. 333–376
- Tielens et al. (1994) Tielens A. G. G. M., McKee C. F., Seab C. G., Hollenbach D. J., 1994, ApJ, 431, 321
- Todini & Ferrara (2001) Todini P., Ferrara A., 2001, MNRAS, 325, 726
- Torrey et al. (2015) Torrey P. et al., 2015, MNRAS, 447, 2753
- Torrey et al. (2014) Torrey P., Vogelsberger M., Genel S., Sijacki D., Springel V., Hernquist L., 2014, MNRAS, 438, 1985
- Torrey et al. (2012) Torrey P., Vogelsberger M., Sijacki D., Springel V., Hernquist L., 2012, MNRAS, 427, 2224
- Tsuribe & Omukai (2006) Tsuribe T., Omukai K., 2006, ApJL, 642, L61
- Valiante et al. (2009) Valiante R., Schneider R., Bianchi S., Andersen A. C., 2009, MNRAS, 397, 1661
- Valiante et al. (2011) Valiante R., Schneider R., Salvadori S., Bianchi S., 2011, MNRAS, 416, 1916
- Venemans et al. (2012) Venemans B. P. et al., 2012, ApJL, 751, L25
- Vladilo (1998) Vladilo G., 1998, ApJ, 493, 583
- Vogelsberger et al. (2013) Vogelsberger M., Genel S., Sijacki D., Torrey P., Springel V., Hernquist L., 2013, MNRAS, 436, 3031
- Vogelsberger et al. (2014a) Vogelsberger M. et al., 2014a, Nature, 509, 177
- Vogelsberger et al. (2014b) Vogelsberger M. et al., 2014b, MNRAS, 444, 1518
- Vogelsberger et al. (2012) Vogelsberger M., Sijacki D., Kereš D., Springel V., Hernquist L., 2012, MNRAS, 425, 3024
- Walter et al. (2012) Walter F. et al., 2012, ApJ, 752, 93
- Wang et al. (2011) Wang J. et al., 2011, MNRAS, 413, 1373
- Watson et al. (2015) Watson D., Christensen L., Knudsen K. K., Richard J., Gallazzi A., Michałowski M. J., 2015, Nature, 519, 327
- Weingartner & Draine (2001) Weingartner J. C., Draine B. T., 2001, ApJ, 548, 296
- Wilms, Allen & McCray (2000) Wilms J., Allen A., McCray R., 2000, ApJ, 542, 914
- Yajima et al. (2014) Yajima H., Nagamine K., Thompson R., Choi J.-H., 2014, MNRAS, 439, 3073
- Yamasawa et al. (2011) Yamasawa D., Habe A., Kozasa T., Nozawa T., Hirashita H., Umeda H., Nomoto K., 2011, ApJ, 735, 44
- Yozin & Bekki (2014) Yozin C., Bekki K., 2014, MNRAS, 443, 522
- Zafar & Watson (2013) Zafar T., Watson D., 2013, A&A, 560, A26
- Zahid et al. (2014) Zahid H. J. et al., 2014, ApJ, 792, 75
- Zhukovska (2014) Zhukovska S., 2014, A&A, 562, A76
- Zhukovska, Gail & Trieloff (2008) Zhukovska S., Gail H.-P., Trieloff M., 2008, A&A, 479, 453
- Zu et al. (2011) Zu Y., Weinberg D. H., Davé R., Fardal M., Katz N., Kereš D., Oppenheimer B. D., 2011, MNRAS, 412, 1059
- Zubko, Dwek & Arendt (2004) Zubko V., Dwek E., Arendt R. G., 2004, ApJS, 152, 211