Energy resolution and efficiency of phonon-mediated KIDs for light detection
Abstract
The development of sensitive cryogenic light detectors is of primary interest for bolometric experiments searching for rare events like dark matter interactions or neutrino-less double beta decay. Thanks to their good energy resolution and the natural multiplexed read-out, Kinetic Inductance Detectors (KIDs) are particularly suitable for this purpose. To efficiently couple KIDs-based light detectors to the large crystals used by the most advanced bolometric detectors, active surfaces of several cm2 are needed. For this reason, we are developing phonon-mediated detectors. In this paper we present the results obtained with a prototype consisting of four thick aluminum resonators patterned on a 22 cm2 silicon chip, and calibrated with optical pulses and X-rays. The detector features a noise resolution eV and an (182) efficiency.
I Introduction
From their first applications in photon detectionDay et al. (2003), Kinetic Inductance Detectors (KIDs) became rapidly subject of several RD activities in different physics sectors such as astrophysicsMonfardini et al. (2011); Mazin et al. (2013) and search of dark matter interactionsGolwala et al. (2008), proving to be very versatile devicesZmuidzinas (2012). In superconductors biased with an AC current, Cooper pairs oscillate and acquire kinetic inductance. Interactions with energy larger than the binding energy of Cooper pairs (2) can break them into quasiparticles, producing a variation in the kinetic inductance. The superconductor is inserted in a high merit factor LC circuit, and the energy of the interactions can be reconstructed by monitoring the variations in the resonance parameters.
The key features of KIDs consist in the good intrinsic energy resolution, and in the possibility of easily tuning each detector to a different resonant frequency. This natural aptitude to frequency multiplexed read-out allows operation of a few hundreds of KIDs with two cables and one cryogenic amplifier. In addition, since the electronics is located at room temperature, the installation of KIDs arrays would require minor modifications to the pre-existing cryogenic facilities. Another important advantage of these devices is that they are operated well below the superconductor critical temperature, where the quasiparticle lifetime and the internal quality factor saturate, resulting in a negligible dependence on the temperature.
Light detectors (LDs) based on KIDs could enable particle identification, and therefore background suppressionThe CUPID Interest Group (2015a, b) in bolometric experiments searching for neutrino-less double beta decay (0) or dark matter interactions, such as CUOREArtusa et al. (2015) and LUCIFERBeeman et al. (2013).
The present limit of KIDs in this kind of application resides in their small active surface (few mm2). Macro-bolometers used by CUORE and LUCIFER feature a surface of several cm2, thus an effective read-out of the light emitted by these crystals demands for LDs with large active area. Obtaining a similar surface with KIDs would require hundreds of pixels for each LD, which is not a realistic option for experiments with 1000 detectors. This problem can be overcome following the phonon-mediated approach developed for Neutron Tansmutation Doped Ge thermistorsFiorini and Niinikoski (1984) and for Transition Edge SensorsPröbst et al. (1995), and recently proposed also for KIDsSwenson et al. (2010); Moore et al. (2012).
The CALDER projectBattistelli et al. (2015) aims to demonstrate that such an approach allows to develop large-area LD with noise energy resolution 20 eV RMS, multiplexed read-out, high reproducibility and scalability.
In this paper we present the results of a CALDER development prototype, implementing four aluminum resonators. We perform an absolute calibration of the energy absorbed by the KIDs and derive the efficiency of the detector. We characterize the response with photons at 400 nm and X-rays from a 57Co source. Finally, we analyze and evaluate the energy resolution of the detector.
II Detector Fabrication
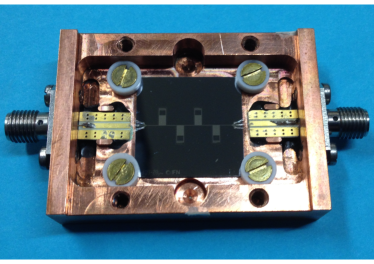
The detectors are fabricated at CNR IFN on high quality, 300 m thick, high resistivity (10 kcm) Si(100) substrates. The four lumped-element resonators (in the following KID-1, KID-2, KID-3 and KID-4, ordered according to the position on the chip) are patterned by electron beam lithography on a single 40 nm thick Al film deposited using electron-gun evaporator. The active area of the single pixel consists of an inductive meander made of 14 connected strips of 80 m2 mm. The meander is closed with a capacitor made of 5 interdigitated fingers of 1.2 mm50 m, to ensure the uniformity of the current across the inductor. The resonant frequency of each resonator is varied by cutting the last finger of the capacitor. As shown in Figure 1, the chip is assembled in a copper structure using PTFE supports with total contact area of about 3 mm2. The other side of the holder (not shown) is covered with a copper collimator hosting a 57Co calibration source (peaks at 6.4 and 14.4 keV) and an optical fiber coupled to a room-temperature LED, that produces pulses at 400 nm. The source and the fiber are placed on the back of the substrate to avoid direct illumination of the resonators. The optical fiber points to the center of the substrate, while the 57Co source is located nearby KID-4.
The copper holder is thermally anchored to the coldest point of a 3He/4He dilution refrigerator with base temperature of 10 mK.
The output signal is fed into a CITLF4 SiGe cryogenic low noise amplifieramp operated at 4 K. A detailed description of the chip design, the cryogenic setup of our laboratory at Sapienza University in Rome, the room-temperature electronics and the acquisition software can be found in referencesBattistelli et al. (2015); Bourrion et al. (2011, 2013).
III Data Analysis
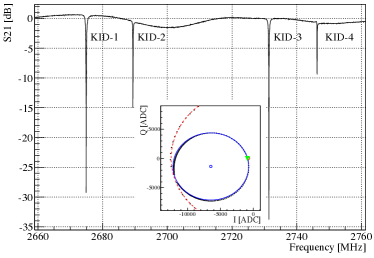
A typical data collection consists in acquiring the complex transmission (S21) for a frequency sweep around the resonances (see Figure 2), and fitting the resonance circles in order to extract the quality factor Q, the coupling quality factor Qc and the internal quality factor Qi using the method described in references Khalil et al. (2012); Swenson et al. (2013).
Resonators are designed to be over-coupled, thus the total quality factors Q (reported in Table 1) are entirely dominated by the coupling quality factors Qc. Qc-values differ from the design value of 8000, likely due to the presence of parasitic slotline modes or standing waves between the detector and the cryogenic amplifier, or inter-resonator coupling resulting in coupled oscillation modesNoroozian et al. . Qi is above 150103, but the values of Qc limit the accuracy of the estimation.
| Q | Pin | |||
|---|---|---|---|---|
| [GHz] | [103] | [dBm] | [s] | |
| KID-1 | 2.675 | 6 | -63 | 218 |
| KID-2 | 2.689 | 18 | -64 | 228 |
| KID-3 | 2.731 | 8 | -66 | 243 |
| KID-4 | 2.746 | 35 | -72 | 233 |
When the trigger of any of the resonators fires, we acquire a 2 ms long time window for the real and imaginary parts of S21 for each resonator (I and Q) with a sampling frequency of 500 kHz. I and Q variations are then converted into changes in phase () and amplitude relative to the center of the resonance loop (blue marker in the circle reported in Figure 2). In the following analysis we use only the signal, as for this detector it is from 6 to 10 times larger than the amplitude one, depending on the KID.
To determine the optimal microwave power, we evaluate the signal-to-noise ratio scanning from -80 dBm to -50 dBm. Increasing the input power produces a reduction of the noise contribution from the amplifier but, on the other hand, decreases the quasiparticles recombination time and, as a consequence, the signal integration length. The microwave power that optimizes the signal to noise ratio for each resonator is reported in Table 1.
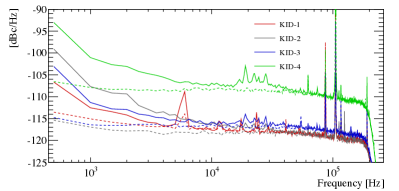
The average noise power spectrum is reported in Figure 3 for phase (continuous line) and amplitude (dotted line) read-out of each resonator. The flat noise observed in the amplitude read-out and in the high frequency region of the phase read-out, is consistent with the noise temperature of the amplifier (). The low-frequency region of the phase spectra is dominated by another noise source, whose origin is not clear yet. It is not ascribable to two-level system noise, as it does not depend on temperature or microwave power. Furthermore, the presence of a mu-metal shield around the cryostat should guarantee an efficient suppression of noise due to static or low-frequency magnetic fields. Since a fraction of this noise is found to be correlated, it could be caused by frequency jitters in the read-out.
The high frequency noise in the acquired waveforms is rejected off-line using a software low-pass filter. In order to avoid distortions in the rise-time of the pulses, the cut-off frequency is set at 100 kHz ( ). Finally, the waveforms are processed with the optimum filterGatti and Manfredi (1986); Radeka and Karlovac (1967), which includes a resonator-specific rise time (see below). The results are not highly sensitive to the choice of rise time.
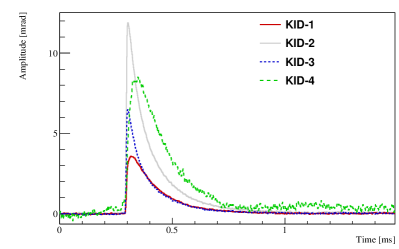
In Figure 4 we show the typical response of the four resonators to the interaction of 15 keV optical pulses, obtained by averaging several pulses to suppress the random noise contributions.
We fit the pulses with a model that includes the time constant of the low-pass filter, the ring-time of the resonator () and two free parameters: a rise-time, which is related to the spread in the arrival time of phonons, and a decay time. As expected, the rise-time depends on the distance between the resonator and the optical fiber, and ranges from 2 s (KID-2 and KID-3) to 10 s (KID-1) and 17 s (KID-4). The decay time becomes faster increasing the microwave power or the temperature, and for this reason it is identified as . This time constant does not depend on the energy of the optical pulses in the scan range (0.7-25 keV), and its value is reported in Table 1 for each resonator.
IV Energy calibration and efficiency
The energy absorbed in a resonator creates a number of quasiparticles , where is the detection efficiency. The variation produces a linear shift of the resonant frequency from the equilibrium one Day et al. (2003):
| (1) |
where . The parameter is the fraction of the total inductance due to kinetic inductance, is the single spin density of states (1.721010 eV) and is a slow function of the temperature and of the resonant frequency that relates the phase variation of the complex conductivity to Cooper pairs breaking. In our working conditions, is measured to be 2.3–2.6 depending on the resonator. The active volume of the resonator is calculated by correcting the volume of the inductor (96500 m3) for the average variation of current density (90%) evaluated from SONNET simulationsson .
We calculate and by measuring the variations of the resonant frequency as a function of the temperature, and fitting these data to the Mattis-Bardeen theory according to the procedure described by PöpelPopel (1989) and adopted by Gao et al.Gao et al. (2006). The relationship between and , indeed, depends only on and , that are found to be the same for all the resonators. The average values are eV and .
We make a second, independent measurement of by illuminating the chip with a Millimeter-Wave source. We monitor phase, amplitude and resonant frequency of the resonators while increasing the frequency of the source from 75 to 110 GHz. The minimum source frequency that produces significant variations of the resonators features is GHz. This value corresponds to eV, in full agreement with the previous value. With these parameters, p0 turns out to be for all the resonators.
Finally, equation 1 can be modified in order to convert the frequency response into the measured phase variation recalling that, for measured in the center of the resonance loop, :
| (2) |
To estimate we could use directly the amplitude of the phase signal. However, to account for the observed small differences in the pulse shapes induced by the arrival time of phonons, we evaluate by integrating the time development of the pulse and dividing the result by .
The energy-calibration function in Eq. 2 is applied to the single resonators to obtain the energy spectra of the 57Co source (reported in Figure 5 (left)) and of the optical pulses.
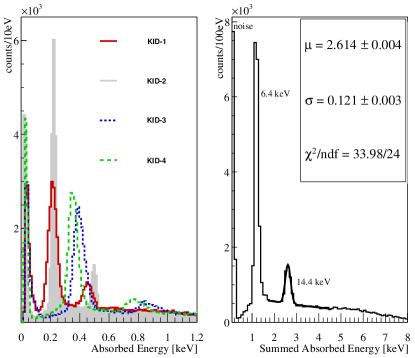
To infer the detection efficiency, we fit the position of the high energy peak produced by the 57Co source, and we divide the result by the nominal energy of the line (see Table 2). Applying this procedure to the lower energy peak (6.4 keV) gives consistent results. The estimation of the efficiency on X-rays allows us to neglect uncertainties in the energy deposited, which could be significant when dealing with optical pulses. To evaluate the total efficiency of the detector, we sum event-by-event the calibrated energies of each KID (see Figure 5 (right)) and fit the position of the 14.4 keV peak, obtaining keV/14.4 keV = (182) . The error on the efficiency is dominated by the error on introduced by the absolute calibration (Eq. 2).
We apply to optical pulses the analysis technique validated on X-rays. The energy of the optical pulses was previously calibrated with a PMT at room temperature, and corrected for the PMT quantum efficiency, for the reflectivity of siliconAspnes and Studna (1983), and for the geometrical efficiency, evaluated through a Monte Carlo simulation based on the Litrani softwareGentit (2002). We observe that the detector response is linear in the scan range. The energies of the optical pulses evaluated using the absolute calibration (Eq. 2) and corrected for , differ by less than 5 from what computed with the simulation.
In Table 2 we report the noise resolution , evaluated at the detector baseline, and the intrinsic noise of each resonator, calculated by scaling the resolution for the single KID efficiency . Summing the response of the four KIDs on an event by event basis, we obtain a global energy resolution of 154 eV, which corresponds to an intrinsic resolution of eV.
| [eV] | [eV] | [eV] | [] | [eV] | |
|---|---|---|---|---|---|
| KID-1 | 400 | 147 | 484 | 3.10.4 | 12.4 |
| KID-2 | 262 | 60 | 253 | 3.40.4 | 8.9 |
| KID-3 | 205 | 75 | 233 | 6.10.7 | 12.5 |
| KID-4 | 204 | 50 | 184 | 5.50.6 | 11.2 |
| SUM | 154 | 42 | 182 | 27.7 |
This resolution is worse than the one expected if we were dominated by the amplifier noise that, for each resonator, can be computed asBattistelli et al. (2015):
| (3) |
The discrepancy between the measured values and can be interpreted as due to the excess low frequency noise in the phase readout. This is supported by the fact that matches closely , which is the integral of the optimally-filtered noise power spectral density. Without this noise, we would have expected a global energy resolution of .
V Conclusions
In this paper we presented the results obtained with a 4-pixels Al array on Si substrate. The comparison of the absolute calibration of the detector with the energy produced by a calibrated LED+optical system proved the reliability in reconstructing the energy of optical pulses from 0 to 25 keV. We derived an efficiency of (182) , that can be improved by increasing the active surface of the resonators. The overall baseline resolution of 154 eV is already competitive with some of the commonly used cryogenic light detectors, and can be further improved by suppressing the noise sources and, eventually, by using more sensitive superconductors.
Acknowledgements
This work was supported by the European Research Council (FP7/2007-2013) under contract CALDER no. 335359 and by the Italian Ministry of Research under the FIRB contract no. RBFR1269SL. We want to thank Dr. Silvio Morganti for his help in calibrating the optical system.
References
- Day et al. (2003) P. K. Day, H. G. LeDuc, B. A. Mazin, A. Vayonakis, and J. Zmuidzinas, “A broadband superconducting detector suitable for use in large arrays,” Nature 425, 817–821 (2003).
- Monfardini et al. (2011) A. Monfardini, A. Benoit, A. Bideaud, L. J. Swenson, M. Roesch, F. X. Desert, S. Doyle, A. Endo, A. Cruciani, P. Ade, et al., “A dual-band millimeter-wave kinetic inductance camera for the IRAM 30-meter telescope,” Astrophys.J.Suppl. 194, 24 (2011), arXiv:1102.0870 [astro-ph.IM] .
- Mazin et al. (2013) B. A. Mazin, S. R. Meeker, M. J. Strader, B. Bumble, K. O’Brien, P. Szypryt, D. Marsden, J. C. van Eyken, G. Duggan, G. Ulbricht, et al. (ARCONS), “ARCONS: A 2024 Pixel Optical through Near-IR Cryogenic Imaging Spectrophotometer,” Publ.Astron.Soc.Pac. 125, 1348 (2013), arXiv:1306.4674 [astro-ph.IM] .
- Golwala et al. (2008) S. Golwala, J. Gao, B. A. Mazin, M. Eckart, B. Bumble, P. K. Day, H. G. LeDuc, and J. Zmuidzinas, “A WIMP Dark Matter Detector Using MKIDs,” Journal of Low Temp Phys 151, 550 (2008).
- Zmuidzinas (2012) J. Zmuidzinas, “Superconducting microresonators: Physics and applications,” Annu.Rev.Cond.Mat.Phys. 3, 169–214 (2012).
- The CUPID Interest Group (2015a) The CUPID Interest Group, “RD towards CUPID (CUORE Upgrade with Particle IDentification),” arXiv:1504.03612 (2015a).
- The CUPID Interest Group (2015b) The CUPID Interest Group, “CUPID: CUORE (Cryogenic Underground Observatory for Rare Events) Upgrade with Particle IDentification,” arXiv:1504.03599 (2015b).
- Artusa et al. (2015) D. Artusa, F. T. Avignone III, O. Azzolini, M. Balata, T. I. Banks, G. Bari, J. W. Beeman, F. Bellini, A. Bersani, M. Biassoni, et al. (CUORE), “Searching for neutrinoless double-beta decay of 130Te with CUORE,” Adv.High Energy Phys. 2015, 879871 (2015), arXiv:1402.6072 [physics.ins-det] .
- Beeman et al. (2013) J. Beeman, F. Bellini, P. Benetti, L. Cardani, N. Casali, D. Chiesa, M. Clemenza, I. Dafinei, S. Di Domizio, F. Ferroni, et al., “Current Status and Future Perspectives of the LUCIFER Experiment,” Adv.High Energy Phys. 2013, 237973 (2013).
- Fiorini and Niinikoski (1984) E. Fiorini and T. Niinikoski, “Low Temperature Calorimenters for Rare Decays,” Nucl. Instr. and Meth., 224, 83 (1984).
- Pröbst et al. (1995) F. Pröbst, M. Frank, S. Cooper, P. Colling, D. Dummer, P. Ferger, G. Forster, A. Nucciotti, W. Seidel, and L. Stodolsky, “Model for cryogenic particle detectors with superconducting phase transition thermometers,” J. Low. Temp. Phys. 100, 69 (1995).
- Swenson et al. (2010) L. J. Swenson, A. Cruciani, A. Benoit, M. Roesch, C. S. Yung, A. Bideaud, and A. Monfardini, “High-speed phonon imaging using frequency-multiplexed kinetic inductance detectors,” Appl.Phys.Lett. 96, 263511 (2010), arXiv:1004.5066 [physics.ins-det] .
- Moore et al. (2012) D. C. Moore, S. R. Golwala, B. Bumble, B. Cornell, P. K. Day, H. G. LeDuc, and J. Zmuidzinas, “Position and energy-resolved particle detection using phonon-mediated microwave kinetic inductance detectors,” Appl.Phys.Lett. 100, 232601 (2012), arXiv:1203.4549 [astro-ph.IM] .
- Battistelli et al. (2015) E. Battistelli, F. Bellini, C. Bucci, M. Calvo, L. Cardani, N. Casali, M. G. Castellano, I. Colantoni, A. Coppolecchia, C. Cosmelli, et al., “CALDER: Neutrinoless double-beta decay identification in TeO2 bolometers with kinetic inductance detectors,” Eur. Phys. J. C 75 (2015), arXiv:1505.01318 .
- (15) http://radiometer.caltech.edu/datasheets/amplifiers/CITLF4.pdf.
- Bourrion et al. (2011) O. Bourrion, A. Bideaud, A. Benoit, A. Cruciani, J. F. Macias-Perez, A. Monfardini, M. Roesch, L. Swenson, and C. Vescovi, “Electronics and data acquisition demonstrator for a kinetic inductance camera,” JINST 6, P06012 (2011), arXiv:1102.1314 [astro-ph.IM] .
- Bourrion et al. (2013) O. Bourrion, C. Vescovi, A. Catalano, M. Calvo, A. D’Addabbo, J. Goupy, N. Boudou, J. F. Macias-Perez, and A. Monfardini, “High speed readout electronics development for frequency-multiplexed kinetic inductance detector design optimization,” JINST 8, C12006 (2013), arXiv:1310.5891 [astro-ph.IM] .
- Khalil et al. (2012) M. S. Khalil, M. J. A. Stoutimore, F. C. Wellstood, and K. D. Osborn, “An analysis method for asymmetric resonator transission applied to superconducting devices,” J. Appl. Phys. 111, 054510 (2012).
- Swenson et al. (2013) L. Swenson, P. K. Day, B. H. Eom, H. G. LeDuc, N. Llombart, C. M. McKenney, O. Noroozian, and J. Zmuidzinas, “Operation of a titanium nitride superconducting microresonator detector in the nonlinear regime,” J. Appl. Phys. 113 (2013).
- (20) O. Noroozian, P. K. Day, B. H. Eom, H. G. LeDuc, and J. Zmuidzinas, “Crosstalk Reduction for Superconducting Microwave Resonator Arrays,” ArXiv:1206.5571.
- Gatti and Manfredi (1986) E. Gatti and P. F. Manfredi, “Processing the signals from solid state detectors in elementary particle physics,” Riv. Nuovo Cimento 9, 1 (1986).
- Radeka and Karlovac (1967) V. Radeka and N. Karlovac, “Least-square-error amplitude measurement of pulse signals in presence of noise,” Nucl. Instrum. Methods 52, 86 (1967).
- (23) “Sonnet software,” .
- Popel (1989) R. Popel, Superconducting Quantum Electronics, edited by V. Kose (Springer, 1989).
- Gao et al. (2006) J. Gao, J. Zmuidzinas, B. A. Mazin, P. K. Day, and H. G. LeDuc, “Experimental study of the kinetic inductance fraction of superconducting coplanar waveguide,” Nucl. Instrum. Methods A 559, 585 (2006).
- Aspnes and Studna (1983) D. Aspnes and A. Studna, “Dielectric functions and optical parameters of Si, Ge, GaP, GaAs, GaSb, InP, InAs, and InSb from 1.5 to 6.0 eV,” Phys. Rev. B 27, 985 (1983).
- Gentit (2002) F. Gentit, “Litrani: a general purpose monte-carlo program simulating light propagation in isotropic or anisotropic media,” Nucl. Instrum. Methods A 486, 35 (2002).