Genome-scale estimate of the metabolic turnover of E. Coli from the energy balance analysis.
Abstract
In this article the notion of metabolic turnover is revisited in the light of recent results of out-of-equilibrium thermodynamics. By means of Monte Carlo methods we perform an exact uniform sampling of the steady state fluxes in a genome scale metabolic network of E Coli from which we infer the metabolites turnover times.
However the latter are inferred from net fluxes, and we argue that this approximation is not valid for enzymes working nearby thermodynamic equilibrium.
We recalculate turnover times from total fluxes by performing an energy balance analysis of the network and recurring to the fluctuation theorem. We find in many cases values one of order of magnitude lower, implying a faster picture of intermediate metabolism.
Key words: Metabolic Networks, Energy balance analysis, Metabolic Turnover, Thermodynamics.
1 Introduction
The recent wealth of data coming from genome sequencing in biology[1] is eager for unifying schemes, interpretations and insights that could come from physics.
In particular metabolism, the ubiquitous and highly conserved enzymatic network devoted to free energy transduction in every cell, has been the subject of structural reconstructions at the scale of the whole genome[2].
Metabolism has deep physical roots and thus a long standing tradition of physical modelization efforts[3].
A current challenge faced by physics thus concerns the extension of such efforts in large scale models.
On one hand we lack detailed information on many parameters,
on the other, even simple models with minimal assumptions lead to difficult computational issues. Much attention has been payed to the structural properties of metabolic networks
[4], but
on the other hand metabolism is inherently dynamical
and a fundamental inherently physical question
regards the assessment of its typical timescales.
In this article we will analyze metabolites turnover times at the scale of the whole genome in a metabolic network model of E Coli.
We will point out that such analysis requires to integrate thermodynamic information and thus the evaluation of an energy balance analysis of the network[5, 6].
If we model a metabolic system in terms of the dynamics of the concentration levels, assume well-mixing (no space) and neglect noise (continuum limit), we still have a very large non-linear dynamical system whose parameters can be unknown.
For a chemical reaction network in which metabolites participate in reactions with the stoichiometry encoded in a matrix ,
the concentrations change in time according to mass-balance equations
| (1) |
where is the flux of the reaction that is in turn a function of the concentration levels . Upon considering a steady state (homeostasis), i.e. a flux configuration satisfying
| (2) |
we could in principle determine rigorously the timescales by performing a linear stability analysis of these steady states, i.e. upon linearizing the laws and finding the spectrum of the resulting matrix. Such calculation requires knowledge of the elasticity coefficients[7] and in turn of the reaction laws with their parameters, that is not the case in large scale models. A widely employed approximation, if at least fluxes and concentrations are known, is to consider the metabolites turnover times[8, 9] , i.e. the ratio between the concentration of a given metabolite and the flux of production (or equivalently destruction , that is the same in the steady state), i.e.
| (3) |
This turnover time is usually directly and intuitively interpreted as the average time it takes to fully replenish a given metabolic pool. However, we point out that, especially nearby thermodynamic equilibrium, net fluxes result from the difference between forward and backward contributions . This would imply that production and destruction fluxes split as well and the resulting turnover time could be lower[10]:
| (4) |
It should be understood that these contributions directly affect even the calculation of relaxation times from a more rigorous linear stability analysis. Now, if we have information about the net flux and the free energy , we can estimate the backward and forward contribution from a simplified form[11] of one of the main result in out-of-equilibrium thermodynamics, the fluctuation theorem[12, 13, 14]:
| (5) |
It has been shown that this simplified form is valid for the mass action law and the reversible Michellis-Menten kinetics, and it has been proposed to be valid in general[11]. For instance, consider a metabolite in the red cell, Glucose-6-phosphate, produced in glycolysis[15] by an irreversible reaction, Hexokinase ( KJ/mol), and consumed by a reversible one, phosphoglucoisomerase ( KJ/mol). We can calculate at KJ/mol that the turnover time from net fluxes overestimates the one from total fluxes by a factor
| (6) |
In the following we will show the results of an uniform sampling of the possible steady state fluxes in a genome scale metabolic network model for the bacterium E Coli. Then, the results of an energy balance analysis of the network will be presented in order to estimate total fluxes from the simplified form of the aforementioned fluctuation theorem. We will calculate metabolites turnover times from net fluxes, correct them from estimate of total fluxes and show that in the latter case they can be much lower. We will finally draw out some conclusions, for instance regarding how this new faster picture of the intermediate metabolism affects the well-mixing hypothesis.
2 Results and discussion
We consider the steady state fluxes of the metabolic network model of E Coli iJR904[16] in a glucose-limited minimal medium (see materials and methods sec.).
In constraint based modeling, apart from mass balance constraints, fluxes are bounded in certain ranges that take into account thermodynamical irreversibility, kinetic limits and physiological constraints. The set of constraints
| (7) |
defines a convex closed set in the space of reaction fluxes: a polytope from which feasible steady states can be efficiently inferred with Monte Carlo methods[17] (see materials and methods sec.)
Once we have the flux distributions, we can single out for each metabolite the net production flux, that is the sum of positive definite terms (and that it is equal to the net consumption flux under our steady state assumption), if we have information about the concentration levels we can thus calculate the turnover times, i.e.
| (8) |

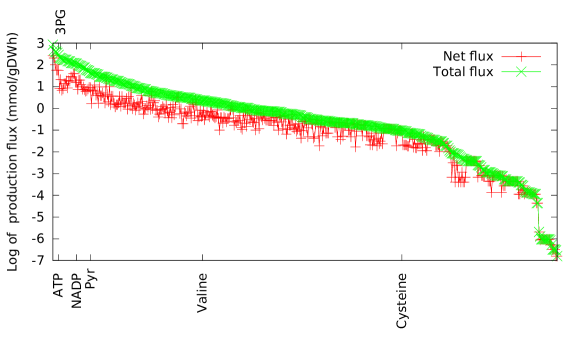
We show in fig 1 (top) in ordered fashion the mean of such production fluxes in log scale (for the sake of avoiding confusion we indicate the name of only some metabolites on the x axis). They span orders of magnitude ranging from to mmol/gDWh, thus giving an highly heterogeneous picture of intermediate metabolism. This is consistent with the time-hierarchy hypothesis, by which typical metabolic timescales should be highly heterogeneous in order to suppress instabilities[18, 19, 20]. As we mentioned in the introduction we can go a step beyond and calculate forward and backward contribution of reaction fluxes by using the fluctuation theorem from the knowledge of the reactions’ free energies. These can be estimated by performing an energy balance analysis of the network. Reactions free energies should be consistent with the reaction directions: and if we decompose them in terms of metabolites chemical potentials , we have for given reaction directions the feasible space of chemical potentials:
| (9) | |||
from which free energies can be inferred with relaxational methods starting from a reliable experimental prior.
Once a free energy vector has been retrieved, the backward and forward contributions to fluxes can be calculated from the fluctuation theorem:
The total fluxes are reported in fig 1 (bottom) in log scale comparing them with net values.
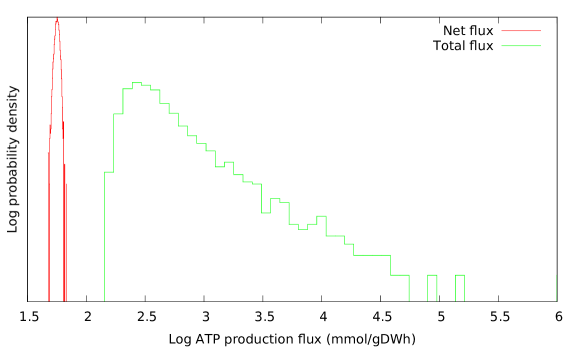
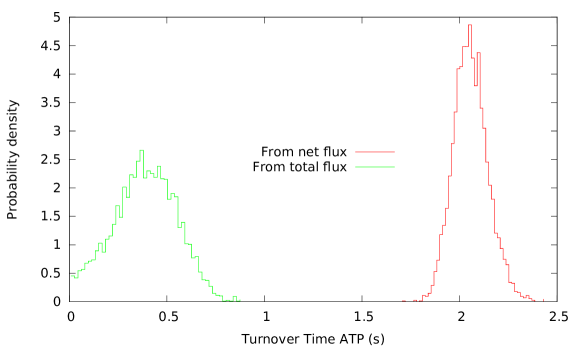
We can see that for many metabolites the corrected production flux can be one order of magnitude higher when it is processed by enzymes working nearby thermal equilibrium, that would imply faster relaxation times of the system, for example in its response to perturbations. In figure 2 (top) we plot for instance the distribution of ATP production fluxes in log scale: we pass from a distribution centered around the mean with value mmol/gDWh to an heterogeneous distribution with a fat tail and peaked around mmol/gDWh. This correction lead to different qualitative estimate of the relative turnover time: in fig 2 (bottom) the distribution of the turnover time of ATP inferred from net and total fluxes assuming a concentration of mM[21] is reported: we pass from a mean of s (consistent with previous estimates reported in databases[22]) to s upon using the correct value from total fluxes.
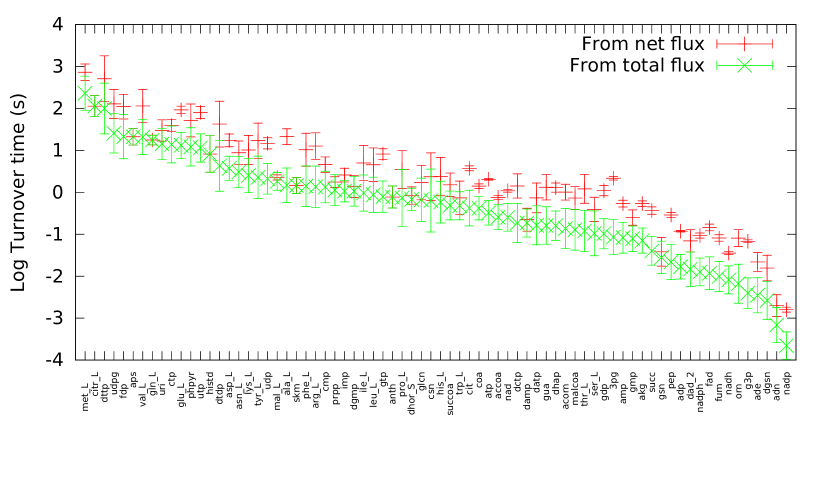
In fig 3 we plot in log scale turnover times from net and total fluxes for several metabolites for which we have used the measures of concentration of[21]
| Metabolite | Tunover time from net flux (s) | Turnover time from total flux (s) |
|---|---|---|
| Glutammate | ||
| 3-Phosphoglycerate | ||
| ATP | ||
| ADP | ||
| AMP | ||
| NAD | ||
| NADH | ||
| NADP | ||
| NADPH |
We present in table 1 for comparison the turnover times estimate from net and total fluxes of some key metabolites.
3 Materials and methods
3.1 Data
The network employed is E Coli iJR904[16]. This network consists of reactions among metabolites. Upon considering a glucose limited minimal medium we are left, after removing blocked reactions and leaf metabolites with reactions among metabolites. We set a maximal glucose uptake of mmol/gDWh and fix a minimal ATP maintenance of mmol/gDWh. The resulting polytope has dimension . In regard to the data for the energy balance analysis we recur to the chemical potential estimates coming from a genome scale application of the group contribution methods from[23, 24]. In order to calculate turnover times we have recurred to the measure of absolute concentrations reported in[21].
3.2 Computational methods
3.2.1 Uniform sampling of steady states
An uniform sampling of a convex polytope in high dimension is usually performed with Markov chain Monte Carlo methods, since an exact enumeration of the vertex would be infeasible due to their exponential number and static rejection methods[25] would suffer as well from high-dimensionality issues. We have recurred to well known hit and run markov chain[26] that has been investigated in much detail in mathematical literature, showing nice convergence properties: it is guaranteed by detail balance to converge to the uniform distribution with a mixing time that scales as[27]
| (11) |
where and are the radius of respectively the biggest (smallest) inscribed (inscribing) sphere. The factor (’sandwitching ratio’) can lead to ill-conditioning issues, since the timescales of metabolic fluxes are typically very heterogeneous. Such factor can be reduced to a polynomial of the space dimension with a polynomial time algorithm that finds a rounding ellipsoid[28]. We have rounded the polytope with an ellipsoid founded with the flux variability analysis[29], that has been shown to reduce the sandwitching ratio to values that allow an efficient sampling[30]
3.2.2 Energy balance analysis
Finding a free energy vector consistent with a given flux configuration amounts at solving a system of linear inequalities for which relaxational algorithms can be employed[31, 32] starting from the experimental prior that we have reported in the subsec. Data. However we point out that duality arguments[33, 34] lead to the infeasiblity of such system if closed reactions loops are present. Such closed reaction loops has been exhaustively enumerated in this network and were corrected in a minimal way[35].
4 Conclusions
In this work we have revisited the notion of metabolic turnover in the light of recent results in out-of-equilibrium thermodynamics. The net flux of a reaction working nearby thermodynamic equilibrium result from a contribution of backward and forward fluxes, whose value can be inferred from the fluctuation theorem upon knowledge of the free energy. The higher resulting total fluxes lead to effectively faster relaxation times in metabolic systems, a notion that can be captured at an approximated level by the computation of metabolites turnover times. We have performed an uniform sampling of the steady states of an E Coli genome scale constraint based metabolic network model, we have peformed an energy balance analysis of the network and we have estimated total production fluxes from the fluctuation theorem. We have shown that metabolites turnover times estimated in this way can be as far as one order of magnitude lower than the ones inferred from net fluxes. Such reduction of turnover times could lead in principle to values that are below typical metabolites diffusion times and thus it could affect the well-mixing hypothesis, that is at the core of our approach and constraint-based modeling in general. An approximate estimate[22] in which we consider a diffusion constant of /s, and that the diameter of E coli is , lead to an order of magnitude estimate s. The turnover time of all the metabolites we have calculated is above this threshold apart from NADP and adenosine. Such analysis could be performed in principle for any metabolic network upon knowledge of the free energies landscape. On the other hand a more rigorous estimate of the true relaxation times of a metabolic system would requires genome-scale insights on enzymatic kinetic laws, including allosteric regulations, an aspect that would require further investigations.
Acknowledgments
The author thanks A. De Martino for interesting discussions. This work is supported by the DREAM Seed Project of the Italian Institute of Technology (IIT). The IIT Platform Computation is gratefully acknowledged.
References
References
- [1] Vivien Marx. Biology: The big challenges of big data. Nature, 498(7453):255–260, 2013.
- [2] Bernhard O Palsson. Systems biology. Cambridge university press, 2015.
- [3] R Heinrich and S Schuster. The regulation of cellular systems. New York: Chapman & Hall, 1996.
- [4] Rogier Braakman and Eric Smith. The compositional and evolutionary logic of metabolism. Physical biology, 10(1):011001, 2013.
- [5] D Beard, S Liang, and H Qian. Energy balance for analysis of complex metabolic networks. Biophys. J., 83(1):79, 2002.
- [6] D Beard, E Babson, E Curtis, and H Qian. Thermodynamic constraints for biochemical networks. J. Theor. Biology, 228:327, 2004.
- [7] David Fell and Athel Cornish-Bowden. Understanding the control of metabolism, volume 2. Portland press London, 1997.
- [8] John S Easterby. Coupled enzyme assays: a general expression for the transient. Biochimica et Biophysica Acta (BBA)-Enzymology, 293(2):552–558, 1973.
- [9] John S Easterby. A generalized theory of the transition time for sequential enzyme reactions. Biochem. J, 199:155–161, 1981.
- [10] Jens Georg Reich and Evgenij Evgen’evič Selkov. Energy metabolism of the cell. A Theoretical Treatise. Acad. Press, London, 1981.
- [11] Daniel A Beard and Hong Qian. Relationship between thermodynamic driving force and one-way fluxes in reversible processes. PLoS ONE, 2(1):e144, 2007.
- [12] G Gallavotti and EGD Cohen. Dynamical ensembles in nonequilibrium statistical mechanics. Physical Review Letters, 74(14):2694, 1995.
- [13] Pierre Gaspard. Fluctuation theorem for nonequilibrium reactions. The Journal of chemical physics, 120(19):8898–8905, 2004.
- [14] Tim Schmiedl and Udo Seifert. Stochastic thermodynamics of chemical reaction networks. The Journal of chemical physics, 126(4):044101, 2007.
- [15] Jeremy M Berg, John L Tymoczko, and Lubert Stryer. Glycolysis and gluconeogenesis. 2002.
- [16] Jennifer L Reed, Thuy D Vo, Christophe H Schilling, Bernhard O Palsson, et al. An expanded genome-scale model of escherichia coli k-12 (ijr904 gsm/gpr). Genome Biol, 4(9):R54, 2003.
- [17] Sharon Wiback, Iman Famili, Harvey Greenberg, and B-O Palsson. Monte carlo sampling can be used to determine the size and shape of the steady-state flux space. J. Theor. Biol., 228(4):437, 2004.
- [18] David JM Park. The hierarchical structure of metabolic networks and the construction of efficient metabolic simulators. Journal of theoretical biology, 46(1):31–74, 1974.
- [19] Jens G Reich and EE Sel’kov. Time hierarchy, equilibrium and non-equilibrium in metabolic systems. Biosystems, 7(1):39–50, 1975.
- [20] Reinhard Heinrich, SM Rapoport, and TA Rapoport. Metabolic regulation and mathematical models. Progress in biophysics and molecular biology, 32:1–82, 1978.
- [21] Bryson D Bennett, Elizabeth H Kimball, Melissa Gao, Robin Osterhout, Stephen J Van Dien, and Joshua D Rabinowitz. Absolute metabolite concentrations and implied enzyme active site occupancy in escherichia coli. Nature chemical biology, 5(8):593–599, 2009.
- [22] Ron Milo, Paul Jorgensen, Uri Moran, Griffin Weber, and Michael Springer. Bionumbers the database of numbers in molecular and cell biology. Nucleic acids research, 38(suppl 1):D750–D753, 2010.
- [23] Matthew Jankowski, Christopher Henry, Linda Broadbelt, and Vassily Hatzimanikatis. Group contribution method for thermodynamic analysis of complex metabolic networks. Biophys. J., 95(3):1487, 2008.
- [24] Christopher Henry, Matthew Jankowski, Linda Broadbelt, and Vassily Hatzimanikatis. Genome-scale thermodynamic analysis of escherichia coli metabolism. Biophysical Journal, 90(4):1453–1461, 2006.
- [25] Nathan D Price, Jan Schellenberger, and Bernhard O Palsson. Uniform sampling of steady-state flux spaces: means to design experiments and to interpret enzymopathies. Biophys J, 87(4):2172–86, Oct 2004.
- [26] V Turcin. On the computation of multidimensional integrals by the Monte Carlo method. Th Probab Appl, 16:720–724, 1971.
- [27] László Lovász. Hit-and-run mixes fast. Math Program, 86(3):443–461, 1999.
- [28] László Lovász. An algorithmic theory of numbers, graphs and convexity, volume 50. SIAM, 1987.
- [29] R Mahadevan and CH Schilling. The effects of alternate optimal solutions in constraint-based genome-scale metabolic models. Metab. Eng., 5(4):264, 2003.
- [30] Daniele De Martino, Matteo Mori, and Valerio Parisi. Uniform sampling of steady states in metabolic networks: Heterogeneous scales and rounding. PLoS ONE, 10(4):e0122670, 2015.
- [31] W. Krauth and M. Mezard. Learning algorithms with optimal stability in neural networks. J. Phys. A: Math. Gen., 20:L745, 1987.
- [32] TS Motzkin and IJ Schoenberg. The relaxation method for linear inequalities. Canadian J Math, 6(3):393–404, 1954.
- [33] D De Martino. Thermodynamics of biochemical networks and duality theorems. Phys. Rev. E, 87:053108, 2013.
- [34] Arne Müller. Thermodynamic constraints in metabolic networks. 2012.
- [35] Daniele De Martino, Fabrizio Capuani, Matteo Mori, Andrea De Martino, and Enzo Marinari. Counting and correcting thermodynamically infeasible flux cycles in genome-scale metabolic networks. Metabolites, 3(4):946–966, 2013.