Predictions for reverberating spectral line from a newly formed black hole accretion disk: case of tidal disruption flares
Abstract
Tidal Disruption Events (TDEs) can be perfect probes of dormant SMBHs in normal galaxies. During the rising phase, the accretion luminosity can increase by orders of magnitude in several weeks and the emergent ionizing radiation illuminates the fresh accretion flow. In this paper, we simulated the evolution of the expected spectral line profile of iron due to such a flare by using a ray-tracing code with effects of general relativity (GR) taken into account. We found that the time-dependent profile changes significantly with black hole spin, inclination angle with respect to the black-hole equatorial plane, and the expansion velocity of the ionization front. At low values of spin, a “loop” feature appears in the line profile vs. time plot when the inclination is no less than and the expansion velocity is no less than half speed of light, due to a shadow in the emission of the truncated disk. In the light curve two peaks occur depending on the inclination angle. At large , a shallow “nose” feature may develop ahead of the loop; its duration depends on the expansion velocity and the inclination angle. We explore the entire interval of black hole spin parameter ranging from extreme prograde to extreme retrograde rotation, . In the prograde case, a low-energy tail appears to be more pronounced in the evolving centroid energy of the line. Our results demonstrate the importance to search for X-ray spectral lines in the early phase of TDE flares in order to constrain black hole mass and spin, as well as properties of the innermost accretion flow.
Subject headings:
accretion, accretion disks — black hole physics — galaxies: nuclei1. Introduction
X-ray spectroscopy reveals that atoms and ions of iron can produce a strong Fe K spectral line, which is thought to be shaped by relativistic effects as it emerges from the inner regions of an accretion disk. Hard X-ray photons from a hot black hole corona can irradiate the accretion flow. Emission from an irradiated flow then contains the reflection component (see Fabian & Ross, 2010, and further references cited therein for a review). The emerging signal includes both the continuum flux and spectral lines, namely, the prominent fluorescent emission. The latter is produced by de-excitation of an atom with a vacancy in the K-shell being filled by an outer electron. The yield of the fluorescent line scales as (quartic power of the atomic number), hence the iron fluorescent line is particularly strong. About 80% of the Fe K line photons come directly from the Fe atoms/ions without experiencing scattering.
X-ray spectra have been successfully used to study black holes that are surrounded by an accretion disk. Starving black holes are more difficult to explore. Also when the surrounding material is inactive (e.g. a non-accreting clumpy torus) then the electromagnetic signatures cannot be employed to reveal the black hole. In such circumstances the immediate vicinity of the black hole horizon can be probed when a star passes too close to the black hole, so that it becomes destroyed in a Tidal Disruption Event (TDE; see Komossa & Greiner 1999; Gezari et al. 2009; Kocsis & Loeb 2014; Komossa 2015, and further references cited therein). The resulting transient accretion is delayed and it occurs much later after the moment of disruption of the star, as the debris material proceeds to the black hole on the viscous time-scale. Eventually, the gas approaches the innermost stable circular orbit and at this stage the enhanced accretion gives us an opportunity to examine the black hole by lighting up its environment and producing distinct spectral signatures.
While predictions for optical spectra have been discussed in more detail (Strubbe & Quataert, 2009, 2011; Komossa, 2012), X-rays reach closer to the black hole and relativistically skewed spectral line can strongly constrain the parameters, thus enabling us to explore effects of strong gravity (Chen & Bogdanović, 2015).
As the relativistic line is produced near the horizon, the line energy will be influenced by the gravitational redshift and the Doppler effect (Fabian et al., 1989; Laor, 1991). Hence, the observed spectral profile will be different from the rest-frame shape of the spectral feature, in particular, the line centroid energy will be shifted (the change towards higher or lower energy is possible depending on parameters; Karas 2006). As a result, the reflected spectra are distorted and the observed iron K line profile becomes broad and skewed. Assuming that the flow extends down to the innermost stable circular orbit (ISCO; Bardeen et al., 1972), the emerging spectrum can be used to infer the spin of the central compact object. This has been done for both Galactic black hole X-ray binaries (XRBs; e.g., Miller et al., 2013) and supermassive black holes (SMBHs) in Active Galactic Nuclei (AGNs; e.g., Risaliti et al., 2013). Besides that, the iron line profile can help us probe the geometry of the hard X-ray emitter (Fabian et al., 2002).
The emergent spectral line depends on the ionization state of the gaseous material. As first recognized by Ross & Fabian (1993), in the case of X-ray irradiation the strength of the resulting line emission is suppressed due to Auger destruction when the ionization parameter (defined as , where is the hard X-ray luminosity, is the electron number density of the irradiated disk, and is the radius) is in the range of –. Then the equivalent width of the line increases for due to the presence of Fe XXIV and Fe XXV (the emission lines of iron are dominated by contributions from these two species). At very high ionization state (), the emission line would be suppressed again since a large fraction of the iron atoms are fully ionized (Matt et al., 1993, 1996; Karas et al., 2000).
A detailed shape of the observed (relativistically skewed) line can in principle be used to constrain parameters of the accreting system, in particular, the black hole spin. However, Reynolds & Begelman (1997) showed that there is a degeneracy in determining the spin by time-averaged X-ray spectra. Dovčiak et al. (2004b) demonstrated that the interplay between radius of the inner edge (offset from ISCO) and spin can be disentangled, but only with spectra of very high quality.
On the other hand, in a time-resolved process, the variability of the central hard X-ray sources would “echo” on the irradiated accretion flow. Reynolds et al. (1999) and Young & Reynolds (2000) studied the resulting reverberation features of black hole spin, given the geometry of the X-ray emitting source, and they simulated the resulting response to a function flare in AGN. Recently, the promising reverberation technique has become debated in the context of time lags emerging in the new X-ray data (Zoghbi et al., 2010, 2013).
For AGN, the lamp-post model of the irradiated inner accretion disk has been adapted as a suitable working hypothesis (Matt et al., 1991; Martocchia et al., 2000; Miniutti & Fabian, 2004). In this scenario the accretion disk is illuminated by a primary source which is located above the disk plane. The frequently-used assumption places the primary source on the common axis of the rotating black hole and the equatorial accretion disk. The source of primary photons represents a corona or a base of the jet. Following an onset of the illumination, the primary photons travel along null geodesics until some of them hit the surface of the accretion disk, where they are reprocessed and the emerging signal (including the reflection spectral line photons) then proceeds toward a distant observer. In such a geometrical set-up, the illuminating light front can effectively move at a superluminal speed across the disk surface. On the other hand, formation of the irradiation source in the lamp-post model could be enhanced by relic inactive (collision-less) plasma structures persisting as remnants of previous accretion episodes (Cremaschini et al., 2013; Cremaschini & Stuchlík, 2014; Kovář et al., 2014), including the potential disruption of asteroids and small bodies by the supermassive black holes (Kostić et al., 2009, 2012; Zubovas et al., 2012).
In the present paper, we investigate a possibility of ionizing the freshly accreted material of debris flow, formed from a disrupted or partially damaged star as well as pre-existent gas near SMBH. This material is activated by X-ray illumination that would be produced near the black hole from a hot corona or a hot inner accretion flow as the accretion rate grows above the Eddington limit.
An expanding ionization region develops and proceeds through the accretion flow. This is thought to be triggered by a TDE in a normal galaxy center, where the induced variation of the spectrum can be revealed more easily than in a typical AGN (the latter would be intrinsically highly variable). In consequence of the changing ionization the spectral line becomes modulated in strength and energy via increasing ionization. Indeed, it occurs that the medium near the central black hole is often in the form of a highly inhomogeneous and clumpy cloudlets which stay undetected unless illuminated by an external source. The actual flare is expected to occur somewhat delayed with respect to the pericenter passage of the affected star, as the illuminating corona builds gradually during the (super)-Eddington phase of fast accretion following the moment of TDE.
A non-negligible radial infall velocity of the accreted material is likely. The ionization front therefore moves radially outward at not exceeding the speed of light. We set as one of the free model parameters that could be constrained by the observed spectra. The scenario of ionization wave being induced by TDE and launched from the inner disk provides an alternative scheme with a small number of free parameters and somewhat different properties with respect to changing spectral properties of the evolving line.
2. Prospects for Iron Line Reverberation from Tidal Disruption Events
2.1. TDEs near SMBHs
Tidal disruption events (TDEs) can be used to probe the cosmological SMBHs in the centers of inactive galaxies. A TDE occurs if the stellar orbit falls within radius such that the ratio between stellar surface gravity and tidal acceleration at pericenter,
| (1) |
where , , and are the pericenter radius, stellar radius, stellar mass and the central SMBH mass, respectively (Luminet & Marck, 1985; Rees, 1988; Evans & Kochanek, 1989; Phinney, 1989). The exact value of for the disruption to happen depends on the internal structure, compressibility and rotation of the star (Eggleton, 1983). Simulations confirm that, after the disruption, nearly half of the stellar debris should remain on the bound orbit and they would be eventually accreted by the SMBH. Based on the viscous mechanism, the mass fall-back rate is estimated to be
| (2) |
which can significantly exceed the Eddington accretion rate for a period of weeks to years (Strubbe & Quataert, 2009, 2011). The mass of the SMBHs associated with TDEs is peaked at solar mases (Stone & Metzger, 2014). The presence of a stellar ring or a secondary intermediate-mass black hole near a SMBH can enhance the TDE rate by increasing the eccentricity fluctuations of stellar trajectories (Vokrouhlický & Karas, 1998; Karas & Šubr, 2012; Karas et al., 2014; Li et al., 2015).
In the X-ray and Optical/UV bands, candidate TDEs have been reported (Renzini et al., 1995; Bade et al., 1996; Komossa & Greiner, 1999; Greiner et al., 2000; Donley et al., 2002; Gezari et al., 2006, 2008, 2009, 2012; Maksym et al., 2010). These events are characterized by thermal emission with temperature of – K, and the peak bolometric luminosity of about –. For the events with good coverage during the decay, the luminosity decline was consistent with a power-law delay with index of . Compared with quiescent supermassive black holes (SMBHs), such as Sgr A* in our Galaxy radiating at the level of , the luminosity can increase significantly, by several (even up to ten) orders of magnitude during TDE outbursts.
In 2011, two putative TDEs were detected: Swift J1644+57 (e.g., Burrows et al., 2011; Levan et al., 2011; Zauderer et al., 2011) and Swift J2058.4+0516 (e.g., Cenko et al., 2012). Their X-ray spectra showed a power-law shape, and the peak luminosity of far exceeded the Eddington limit of a SMBH of a presumed reasonable mass. They also exhibited radio emission with isotropic luminosity of . These are believed to be due to a relativistic jet viewed at a very small angle. The amplitude was very large in these two cases. For Swift J1644+57 the ROSAT upper limit was , and the peak flux during the outburst was (Burrows et al., 2011), showing an amplitude of more then four orders of magnitude. For Swift J2058.4+0516, the ROSAT upper limit was while the peak flux during outburst was , showing fluctuations with amplitude of three orders of magnitude.
TDEs can be revealed with a better chance in sources where the central supermassive black hole is not fed by vigorous accretion (Saxton & Komossa, 2012). In this context, AGN have been an unfavored type of objects to reveal tidal disruptions because accretion is an inherently variable process which can hide signatures of TDEs. The X-ray light curve of a typical AGN varies on multiple time-scales, and so a sporadic flare by a TDE can hardly be discovered in the background of stochastic fluctuations due to the intrinsic properties of the accretion flow. Relatively quiet low-luminosity nuclei appear to be more suitable for this task.
Follow-up optical spectroscopy observations can give additional information on characteristics to TDE host galaxies (e.g., Komossa et al., 2004; Saxton et al., 2012; Clausen et al., 2012; Wang et al., 2012). Here we propose that the evolving X-ray spectral line profile expected in the very early phase of TDE accretion flares can provide a unique probe of the SMBHs in an otherwise inactive galaxy. Well after the tidal disruption happens, an accretion disk forms from the circularized flow of debris. The subsequent evolution is crucial for understanding the light curves in TDE events (Shen & Matzner, 2014).
The accretion of the debris material starts from low accretion rates and it continues all the way to super-Eddington rates during the rising phase of TDEs. In the early rising phase, the accretion process is expected to proceed in the regimes of radiatively inefficient/hot accretion. The resulting signal mimics the one seen in many AGN where the lamp-post model has been applied to model the irradiation of the disk. A newly formed accretion disk will become ionized when the source reaches and exceeds the Eddington luminosity.
The idea of this investigation is based on the fact that an instantaneous illumination and the resulting release of radiation energy by the event occurring near the center (at the tidal radius of the supermassive black hole) shall induce an ionizing front that propagates outwards and changes the ionization state of the accretion disk. Consequently, it also influences the spectral line emissivity in a very specific manner. The proposed approach offers an interesting opportunity, nevertheless, it is a challenge because the iron line flux is probably weak in TDEs, even in underluminous nuclei with a low accretion rate and no prior accretion disk.
We constructed a simplified scheme to simulate the response of the fluorescent iron line to the central TDE flare, where the rising edge of the TDE flare can be the perfect illuminating signal for reverberation mapping purposes. The advantage of our description is the parameterization of the model by only a small number of free parameters. The main purpose of this work is to identify characteristic patterns in the line emission, not only limited to iron lines, that may be used to probe SMBH mass and spin via general relativistic effects in TDEs. These are thought to be rare events by their nature, however, the main advantage is that they can be used to explore SMBH in otherwise non-active galaxies and therefore these systems have a potential advantage of being more clean than AGN. On the other hand, different but related aspects of complex iron-line diagnostics have been discussed in the context of binary black-hole mergers (e.g., McKernan et al., 2013).
2.2. Signatures of Expanding Ionization Front
In the following we denote the gravitational constant , the mass of the supermassive black hole , and the speed of light (units of radius, time and velocity are , and , respectively).
Because in the rising phase of TDE accretion flares the continuum flux can vary in a large range, we adopt a correspondingly wide range of ionization into consideration (Ross & Fabian, 1993; Goosmann et al., 2006). For a SMBH, the peak mass fall-back rate can reach (Evans & Kochanek, 1989), corresponding to the luminosity of with the radiation efficiency of .
We estimate the number density of electrons using the radiation pressure dominated limit of the standard disk (Shakura & Sunyaev, 1973): . The ionization parameter . Even for , is still as large as . As increases inward, the accretion flow becomes fully ionized when irradiated by the peak luminosity of the outburst.
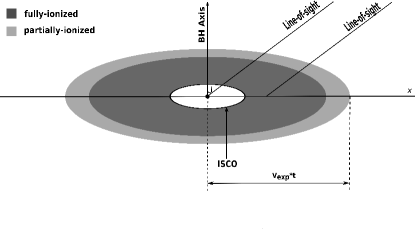
For a particular ring centered at radius in the equatorial plane, the ionization parameter at time is , where denotes the luminosity of the irradiating emission at time . The fluorescent emission of the ring is expected to vary corresponding to the change of the central engine, but with a delay which accounts for the photon traveling from the center to the ring. The reverberating fluorescent emission emerges at where is the time of the outburst onset, and it disappears after when . Looking at the entire disk, during the outburst rise, the iron line emission is localized to a ring composed of partially ionized medium. Outside the ring the photons have not arrived yet; inside the ring the accretion flow is fully ionized. This partially ionized region expands with time (Figure 1 illustrates this scheme).
The expansion velocity of the “partially ionized ring” depends on the height of the illuminating source: . If the source lies near the equatorial plane, is close to speed of light (for an illuminating source above the equatorial plane, the expansion would appear even superluminal). The infall velocity cannot be neglected at high accretion rates when would be equal , and hence less than unity.
3. Numerical Approach and Simulations
3.1. Assumptions and the Model Set-Up
In the local frame the line-emitting region is confined in a ring area of the disk. In the simulation we simplified the region to be a ring of narrow width (about unity in terms of gravitational radii), and the irradiating source flux evolves as a step-function profile. In this scenario the width of the ionization ring relies on the shape of the rising edge. Then we computed the emerging time-resolved iron line profiles, as observed by a distant observer.
For simplicity we assumed a rotating planar disk representing a geometrically-thin Keplerian accretion disk formed from the TDE debris material, extending down to ISCO when we see the X-ray emission associated with the TDE. The outer boundary of the disk in our code was set to be 1000, which is large enough to investigate the current reverberation problem for our purposes. The radial power-law emissivity index was set to 3 (the Newtonian value at large radii; Vaughan et al. 2004). We assumed the iron line emission to be locally isotropic. Detailed analysis of the angular distribution of the line emission (Svoboda et al., 2009; Garcia et al., 2014) showed that it is likely to exhibit a weakly limb-brightening dependence, with maximum ratio of only 2 compared to an isotropic assumption. This is less extreme then , which is another commonly assumed law for the angular dependence of an X-ray illuminated slab (Haardt, 1993). Hence, our assumption of isotropic emission would not change the result very much. We assumed the line to be intrinsically narrow and its profile to be a -function in energy centered at 6.4 keV, i.e., the laboratory energy of Fe I K. The results for spectral lines at different energies can be inferred from our simulation.
With all the assumptions above, the local emissivity is
| (5) |
This is obviously a rather simplistic parameterisation of a much more complicated situation, nonetheless, we find it useful for the sake of demonstrating the role of GR effects in the context of wave perturbation that is launched from the inner rim of the disk and then starts travelling outwards.
3.2. Ray tracing of the emission from an expanding ionization region near a black hole
The basic properties of black hole X-ray spectra from the innermost regions of an accretion disc are well-known (Fabian et al., 2000; Reynolds & Nowak, 2003). Gravitational effects act on the spectral features from black-hole accretion disks and coronae by smearing their spectral features and moving them across energy bins. In this way gravity exerts the influence on the ultimate form of the observed spectrum (Cunningham & Bardeen, 1973; Cunningham, 1975; Karas, 2006). The reprocessed radiation reaches the observer from different regions of the system. Furthermore, as strong-gravity plays a crucial role, photons emitted at the same moment may even follow multiple separate paths, joining each other at the observer at different moments. Individual rays experience diverse time lags for purely geometrical reasons, for relativistic time-dilation, and by repressing within the medium.
To simulate the evolution of the observed spectral line, we have employed the general-relativistic ray-tracing method (KYcode; Dovčiak et al. 2004a, 2004b). This code uses pre-calculated information about the form of light rays (i.e., the geometrical shape and the timing relations along null geodesics, which describe the photon propagation in the approximation of geometrical optics). A fine grid is used with multiple scales that allow us to reproduce the effects of varying energy shifts, gravitational lensing near caustics, frame-dragging near the ergosphere, and time delays in the gravitational field of a rotating (Kerr) black hole (dimensionless spin parameter ).
First, the source of the emerging signal is represented by an expanding ionization wave launched in the equatorial plane, as introduced in the previous section and further detailed below in Sec. 4. The resulting spectra and the corresponding light curves are produced in the form predicted for a distant observer, i.e., as they are expected to be recorded at the detector plane (defined by the view-angle inclination with respect to the black hole rotation axis) at radial infinity. The code uses the relevant functions stored in FITS files, so that the subsequent computations of the spectral changes are performed in very efficient manner. This allows us to reconstruct the impact of energy shifts (both the Doppler red/blue shifts due to positive/negative component of motion along the line of sight, as well as the overall gravitational red shift near the horizon), light focusing, and the photon travel time from the point of emission towards an observer far from the source.
We have set-up a grid of the interpolation mesh with respect to relevant variables: black-hole spin, the inclination angle, and the expansion velocity of the front. For the spin we select exemplary values of , , , , and . Both prograde (co-rotating, ) and retrograde (counter-rotating, ) cases are investigated in this work. This covers the entire range of spin values that allow for the black hole horizon, while assuming that the inner rim is linked with the ISCO radius (the latter recedes in the retrograde case, and so the relativistic effects become less important).111In principle, the values of should not be excluded from the analysis a priori, however, we do not consider this possibility because then a naked singularity develops and this would bring us beyond the standard scenario of black-hole accretion (work in progress). For the inclination angle we adopt the grid values in the range from (corresponding to the rotation axis) up to (almost edge-on view), with the resolution of . For the expansion velocity, we set the reference value at (corresponding to the case of an illuminating source lying in the disk plane and the ionization taking effect immediately), and we show and . These allow us to take the effects of accreted debris radial inflow into account. For reference and comparison we also calculated the case of and which can represent the superluminal expansion for an illuminating source located above the disc plane, such as the case of lamp-post scenario in Kerr metric (Martocchia et al., 2000).
Let us note that the constant value of the expansion velocity is introduced to illustrate the expected dependencies and it serves as a simplified parameterisation. In a realistic description the ionisation front will proceed in the interaction with the inflowing material, which exhibits a radially dependent infall velocity. Also, the relativistic effects will modify the simplistic scheme. Nevertheless, even the lamp-post scenario finds its phenomenological substantiation as it can mimic the role of the inner accretion disk self-irradiation, where the light-bending causes an additional energy input impinging onto the disk surface predominantly over the location on the disk axis at distance of roughly the light circle ( for ). For this reason we think it is useful to explore the entire range of from small values to greater than unity.
4. Results
We show how the different values of black hole spin, inclination angle and expansion velocity affect the evolution of the relativistic spectral line emission as predicted in this model.
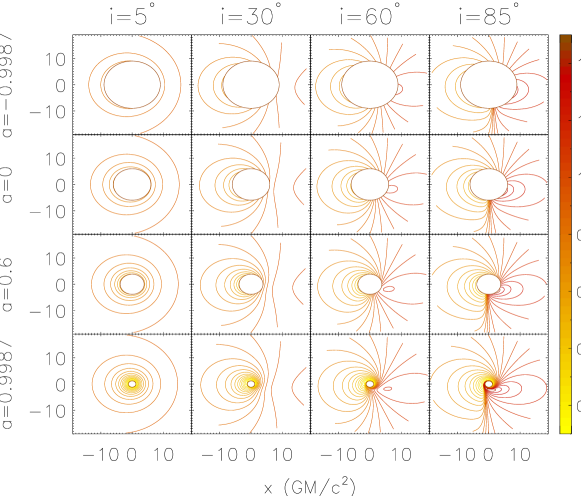
To better understand where the features in the time-resolved line profile originate, we first illustrate the distribution of redshift and time delays for photons emitted in the equatorial disk in Kerr space-time for different values of black-hole spin and observer’s inclination angle . These functions then determine the time-dependent profiles of the iron line.
Figure 2 shows the distribution of the redshift on the equatorial disk plane, for different values of and . The redshift is affected by both gravitational field of the central black hole and also the Keplerian circular motion of the disk. The redshift function reaches minimum in the innermost region of the accretion flow, which is closest to the black hole (see the bottom panels of Fig. 2, where and the ISCO lies on ). The redshift factor can be as small as in the inner region around ISCO. Photons emitted from this area contribute to the extended red wing of the broad iron line in X-ray spectra of AGNs and galactic XRBs. The Doppler effect is more profound for large inclination angle edge-on systems, as the component of the velocity along the line-of-sight increases with the inclination.
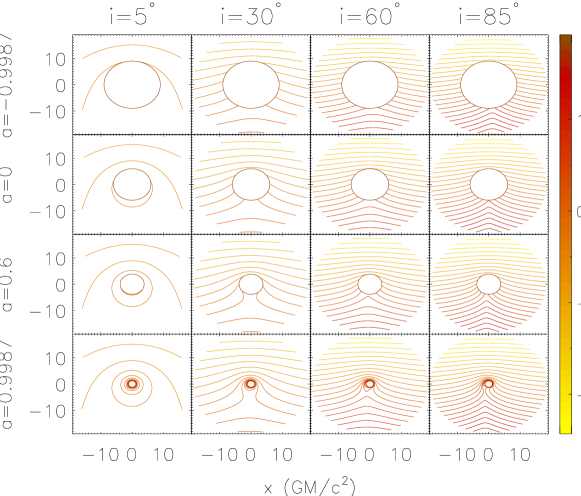
Fig. 3 shows the effect of purely geometrical (general relativistic) relative time delay of photons arriving from the equatorial plane. In the case of prograde rapidly rotating black hole (, the bottom panels), the spectral-line photons experience large time-delays in the inner disk. For the high inclination systems (; right panels), the photons from behind the black hole are delayed when they pass the black hole. In the extreme case of both large inclination and rapidly rotating black hole (the right-bottom panel), the frame-dragging effect is also seen.
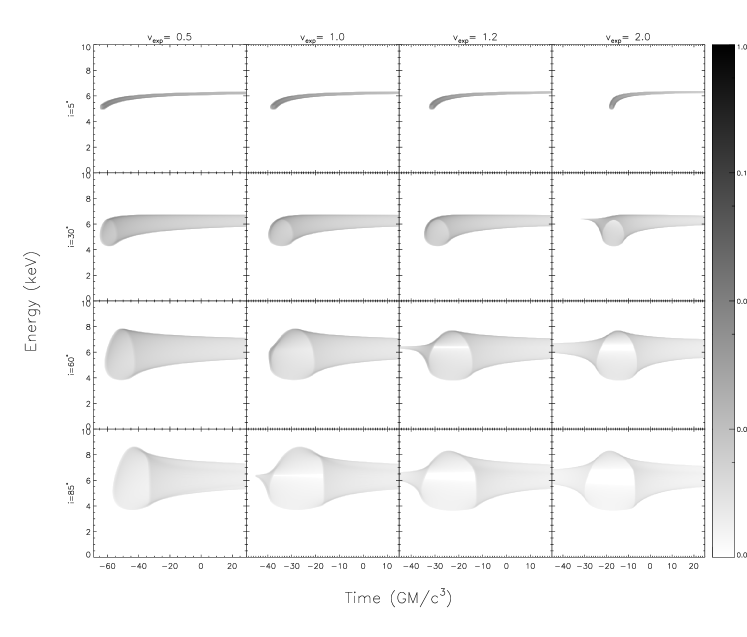
In Figures 4–6 we show the time-resolved line profile, both for Schwarzschild () and extreme Kerr black holes (). We set zero time as mean time, defined by where denotes the photon counts recorded at the detector plane.222To compare with observations, it would be natural to define time zero to be the moment when the onset of the TDE flare reaches the observer. However in our assumption the illuminating source lies in the center of the disk plane which is inside the event horizon, so it is actually not feasible to define zero time in this way. The corresponding lightcurves are shown in figure 7, where Schwarzschild and Kerr cases are plotted in dash-dotted and solid lines, respectively. Let us note that here we show the (computed) light curves of the background-subtracted model; hence, the plot exhibits the expected variation of that part of the observed signal restricted to the energy of the iron line emission.


To characterize the changing profile we employ the line centroid energy,
| (6) |
where is the photon energy, and is the photon number density flux in the line, both of which are measured with respect to the observer’s frame. While the details of the evolving spectrum are telling about GR effects from the theoretical point of view, the centroid energy provides a robust characteristic that can be compared with observation.
For the Schwarzschild black hole case at (i.e. viewed almost along the symmetry axis), the iron line has a narrow profile at any time and the line energy increases with time asymptotically towards the rest-frame value. As the inclination angle increases from to (close to an edge-on view), the observed line profile at any time becomes broadened due to an increasing velocity component of the disk material along the line of sight. Once and , a loop is seen in the line profile vs. time plot (see Figs. 4–6). The time span of the loop increases with the inclination angle. At , two peaks can be seen in the line lightcurve, as shown in Fig. 7, and the first and the second peaks correspond to the left and the right edges of the loop, respectively.
We computed the time span of the two peaks and we found that their time difference stays roughly constant with varying expansion velocity. For example, when , the time separation is 13.8, 13.6, 13.4 for , and , respectively. On the other hand, the time separation and intensity ratio of the two peaks depend on the inclination. The mean time separation (, and ) is 7.1, 13.6 and 17.3 for , , and . The intensity ratio of the first to the second peak decreases with the inclination angle in most cases. During the first peak, a dip occurs in the centroid-energy evolution, and between the two peaks the centroid energy exhibits a bump (see Figure 8).
The time delay between the central TDE X-ray irradiating flare and the induced iron line is denoted as and contributed by two factors: the first one is the expansion time, , and the second one is the travel time needed from the disk to the observer, (Fig. 3). At large radius where the spacetime is flat to a good precision, , where is the azimuthal angle on the disk plane. As is of the order of unity, the two are comparable, and is dominated by the longer one. Hence in the case of , is dominated by .
At large inclination angles, the photons originating from the disk in front of the black hole reach the observer first, then come those photons from the disk near ISCO, and the last are those photons from the disk behind the black hole. The loop feature in the line profile vs. time plot is seen due to the existence of a hole (due to our assumption that the disk would be truncated inside the ISCO). The left edge of the loop corresponds to the innermost isochronous disk plane unaffected by ISCO in front of the black hole, and the right edge of the loop corresponds to the innermost isochronous plane unaffected by ISCO behind the black hole. Roughly, the time span of the loop equals to (where is the radius of the ISCO), which is consistent with the time separation between the two observed line intensity peaks in the light curve.
The relative intensity of the second peak is enhanced for large inclination angles as it is formed mainly by the photons emerging from the disk behind the black hole (that get more focused at high inclinations). In the case of low expansion velocity, is dominated by , and the observed image of the emission region expands outwards from the ISCO. In the cases of high expansion velocity combined with high inclination angle, there are “noses” occurring ahead of the loop. In these cases, the observed image of the emission region first expands outside the ISCO and only later on reaches the region below the ISCO. This expansion creates the nose that is followed by the loop and two intensity peaks are visible in the light curve at the time when the image reaches and subsequently leaves the ISCO.
The duration of the nose increases with inclination angle, and with the expansion velocity as well. The noses are contributed by photons emerging from the disk in front of the black hole. Higher inclination and larger expansion velocity cause that the first image of the emission region comes from further away from the centre which prolongs the nose in time-energy graphs. The centroid energy of the noses is close to the rest frame energy of 6.4 keV (this is also reflected in Figs. 4–6).
Comparing with the Schwarzschild case, in extreme Kerr black hole cases, the line energy can extend to both lower and higher energies, due to stronger gravitational and Doppler energy shifts as the inner edge shrinks with increasing spin. The loop feature is no longer seen, while the nose stays unaffected.
At speed of light, a low-energy tail appears in the profile (see Fig. 5). A similar signature has been noticed for Kerr black holes (Young & Reynolds, 2000). As the inner edge is very close to the black hole, the photons from this region of the disk suffer from large time delays (see bottom panels of Fig. 3) and strong gravitational redshift (see bottom panels of Fig. 2), and for this region is dominated by at . These two contributing effects produce the delayed low-energy tail. As a result, the two intensity peaks do not develop in the light curve, while a dip remains to be seen in the centroid energy evolution.
5. Discussion and Conclusions
We simulated the time-resolved iron-line profiles from TDE flares, as they are expected to be seen in a distant observer’s frame. Because the maximum mass fall-back rate can be supper-Eddington in TDEs, a large range of luminosity is expected in these events. Hence, the energetic photons from the central region can bring the accretion flow to high ionization state. The rising edge of TDE flares can produce and modulate the fluorescent iron line. The line emission would disappear in the accretion flow where the disk material is highly ionized (in terms of ).
We explored a simple parameterization according to which the velocity of a moving ionization front defines a different kind of variable compared to the more standard height of the lamp-post scenario. Other parameters of the model are the black hole spin (Kerr metric is assumed) and the line-of-sight view angle of the system. Motivation of the model set-up arises in the context of spectral-line reverberation mapping of the spectral line from the debris disk illuminated after a tidal-disruption event. We suggest that this scheme can be useful to study the properties of tentative TDEs, where the emerging spectral line is modified by an outward propagating circle which grows and changes the line emissivity. The accretion process is expected to be highly non-stationary in such a situation.
We conclude that notable signatures can be expected:
(i)—For , , and small or negative (retrograde) spin, a loop feature appears in iron line profile vs. time plot and it manifests itself in the line flux showing two peaks in the corresponding light curve. The time separation and intensity ratio of the two peaks mainly depend on the inclination angle. For large values of positive (prograde) spin parameter, the radiation emitted close above the horizon destroys the loop (see also the point (iii) below).
(ii)—For large expansion velocities of the ionization circle and large inclination angles, a nose appears ahead of the loop in the iron line profile vs. time plot. The duration of the nose is determined by both the expansion velocity and the inclination angle.
(iii)—For and (extreme prograde rotation), a more prominent low-energy tail is seen. Occurrence of this feature can serve as a probe of the fast-rotating Kerr black hole. On the other hand, in the non-rotating and retrograde cases the low-energy tail is suppressed and it happens earlier in time.
Let us note that the retrograde sense of rotation is often dismissed in accretion disk modelling and spectra fitting because it appears to be less likely compared to the prograde case. It can be argued that the long-term evolution the accretion flow tends to align the angular momentum vector of the flow with that of the black hole. However, the situation with TDEs is quite different (Sochora et al., 2011). An infalling star approaches the central SMBH from the surrounding nuclear star-cluster, which can be considered as spherical and isotropic in zero approximation, and so counter-rotating motion is equally possible as co-rotating with the black hole. Furthermore, counter-rotating stellar rings and disks have been reported in some galaxies, so we included this possibility in our considerations.
Once a TDE-induced relativistic line is detected and its parameters reliably determined in the future, these signatures in time-resolved signal can be used to constrain the black hole spin, inclination, and the expansion velocity of the ionization front.
References
- Bade et al. (1996) Bade, N., Komossa, S., & Dahlem, M. 1996, A&A, 309, L35
- Bardeen et al. (1972) Bardeen, J. M., Press, W. H., & Teukolsky, S. A. 1972, ApJ, 178, 347
- Burrows et al. (2011) Burrows, D. N., Kennea, J. A., Ghisellini, G., et al. 2011, Nature, 476, 421
- Cenko et al. (2012) Cenko, S. B., Krimm, H. A., Horesh, A., et al. 2012, ApJ, 753, 77
- Chen & Bogdanović (2015) Cheng, R. M., & Bogdanović, T. 2015, Phys. Rev. D, 90, id. 064020
- Clausen et al. (2012) Clausen, D., Eracleous, M., Sigurdsson, S., & Irwin, J. A. 2012, EPJ Web of Conf., 39, 1005
- Cremaschini et al. (2013) Cremaschini, C., Kovář, J., Slaný, P., Stuchlík, Z., & Karas, V. 2013, ApJS, 209, 15
- Cremaschini & Stuchlík (2014) Cremaschini, C., & Stuchlík, Z. 2014, Physics of Plasmas, 21, 042902
- Cunningham (1975) Cunningham, C. T. 1975, ApJ, 202, 788
- Cunningham & Bardeen (1973) Cunningham, C. T., & Bardeen, J. M. 1973, ApJ, 183, 237
- Donley et al. (2002) Donley, J. L., Brandt, W. N., Eracleous, M., & Boller, T. 2002, AJ, 124, 1308
- Dovčiak et al. (2004a) Dovčiak, M., Karas, V., Martocchia, A., Matt, G., & Yaqoob, T. 2004a, in proceedings of RAGtime: Workshops on Black Holes and Neutron Stars, eds. S. Hledík and Z. Stuchlík (Opava: Czech Republic), pp. 33–73 (astro-ph/0407330)
- Dovčiak et al. (2004b) Dovčiak, M., Karas, V., & Yaqoob, T. 2004b, ApJS, 153, 205
- Eggleton (1983) Eggleton, P. P. 1983, ApJ, 286, 368
- Evans & Kochanek (1989) Evans, C. R., & Kochanek, C. S. 1989, ApJ, 346, L13
- Fabian et al. (2000) Fabian, A. C., Iwasawa, K., Reynolds, C. S., & Young, A. J. 2000, PASP, 112, 1145
- Fabian et al. (1989) Fabian, A. C., Rees, M. J., Stella, L., & White, N. E. 1989, MNRAS, 238, 729
- Fabian & Ross (2010) Fabian, A. C., & Ross, R. R. 2010, Space Sci. Rev., 157, 167
- Fabian et al. (2002) Fabian, A. C., Vaughan, S., Nandra, K., et al. 2002, MNRAS, 335, L1
- Garcia et al. (2014) Garcia, J., Dauser, T., Lohfink, A., et al. 2014, ApJ, 782, 76
- Gezari et al. (2006) Gezari, S., Martin, D. C., Milliard, B., et al. 2006, ApJ, 653, L25
- Gezari et al. (2008) Gezari, S., Basa, S., Martin, D. C., et al. 2008, ApJ, 676, 944
- Gezari et al. (2009) Gezari, S., Heckman, T., Cenko, S. B., et al. 2009, ApJ, 698, 1367
- Gezari et al. (2012) Gezari, S., Chornock, R., Rest, A., et al. 2012, Nature, 485, 217
- Goosmann et al. (2006) Goosmann, R. W., Czerny, B., Mouchet, M., Ponti, G., et al. 2006, A&A, 454, 741
- Greiner et al. (2000) Greiner, J., Schwarz, R., Zharikov, S., & Orio, M. 2000, A&A, 362, L25
- Haardt (1993) Haardt, F. 1993, 413, 680
- Karas et al. (2000) Karas, V., Czerny, B., Abrassart, A., & Abramowicz, M. A. 2000, MNRAS, 318, 547
- Karas (2006) Karas, V. 2006, AN, 327, 961
- Karas et al. (2014) Karas, V., Dovčiak, M., Kunneriath, D., Yu, W., & Zhang, W. 2014, in proceedings of RAGtime: Workshops on Black Holes and Neutron Stars, eds. Z. Stuchlík, G. Török, & T. Pecháček (Opava, Czech Republic), in press (arXiv:1409.3746)
- Karas & Šubr (2012) Karas, V., & Šubr, L. 2012, EPJ Web of Conf., 39, 1003
- Kocsis & Loeb (2014) Kocsis, B., & Loeb, A. 2014, Space Science Reviews, 183, 163
- Komossa (2012) Komossa, S. 2012, in proceedings of Tidal Disruption Events and AGN Outbursts (Madrid, Spain), eds. R. Saxton & S. Komossa, EPJ Web of Conf., vol. 39, id. 02001
- Komossa (2015) Komossa, S. 2015, in proceedings of Swift: 10 Years of Discovery (Rome, Italy), Journal of High-Energy Astrophysics, in press (arXiv:1505.01093)
- Komossa & Greiner (1999) Komossa, S., & Greiner, J. 1999, A&A, 349, L45
- Komossa et al. (2004) Komossa, S., Halpern, J., Schartel, N., et al. 2004, ApJ, 603, L17
- Kostić et al. (2009) Kostić, U., Čadež, A., Calvani, M., & Gomboc, A. 2009, A&A, 496, 307
- Kostić et al. (2012) Kostić, U., Čadež, A., Calvani, M., & Gomboc, A. 2012, EPJ Web of Conf., 39, 07004
- Kovář et al. (2014) Kovář, J., Slaný, P., Cremaschini, C., et al. 2014, Phys. Rev. D, 90, 044029
- Laor (1991) Laor, A. 1991, ApJ, 376, 90
- Li et al. (2015) Li, G., Naoz, S., Kocsis, B., & Loeb, A. 2015, MNRAS, submitted (arXiv:1502.03825)
- Luminet & Marck (1985) Luminet, J.-P., & Marck, J.-A. 1985, MNRAS, 212, 57
- Levan et al. (2011) Levan, A. J., Tanvir, N. R., Cenko, S. B., et al. 2011, Science, 333, 199
- Maksym et al. (2010) Maksym, W. P., Ulmer, M. P., & Eracleous, M. 2010, ApJ, 722, 1035
- Martocchia et al. (2000) Martocchia, A., Karas, V., & Matt, G. 2000, MNRAS, 312, 817
- Matt et al. (1993) Matt, G., Fabian, A. C., & Ross, R. R. 1993, MNRAS, 262, 179
- Matt et al. (1991) Matt, G., Perola, G. C., & Piro, L. 1991, A&A, 247, 25
- Matt et al. (1996) —. 1996, MNRAS, 278, 1111
- McKernan et al. (2013) McKernan, B., Ford, K. E. S., Kocsis, B., & Haiman, Z. 2013, MNRAS, 432, 1468
- Miller et al. (2013) Miller, J. M., Parker, M. L., Fuerst, F., et al. 2013, ApJ, 775, L45
- Miniutti & Fabian (2004) Miniutti, G., & Fabian, A. C. 2004, MNRAS, 349, 1435
- Phinney (1989) Phinney, E. S. 1989, in procedings of IAU Symp., vol. 136, The Center of the Galaxy, ed. M. Morris (Kluwer Academic Publishers, Dordrecht), p. 543
- Rees (1988) Rees, M. J. 1988, Nature, 333, 523
- Renzini et al. (1995) Renzini, A., Greggio, L., di Serego Alighieri, S., et al. 1995, Nature, 378, 39
- Reynolds & Begelman (1997) Reynolds, C. S., & Begelman, M. C. 1997, ApJ, 488, 109
- Reynolds & Nowak (2003) Reynolds, C. S., & Nowak, M. A. 2003, Phys. Rep., 377, 389
- Reynolds et al. (1999) Reynolds, C. S., Young, A. J., Begelman, M. C., & Fabian, A. C. 1999, ApJ, 514, 164
- Risaliti et al. (2013) Risaliti, G., Harrison, F. A., Madsen, K. K., et al. 2013, Nature, 494, 449
- Ross & Fabian (1993) Ross, R. R., & Fabian, A. C. 1993, MNRAS, 261, 74
- Saxton & Komossa (2012) Saxton, R., & Komossa, S. 2012, EPJ Web of Conf., 39, id. 1
- Saxton et al. (2012) Saxton, R. D., Read, A. M., Esquej, P., et al. 2012, A&A, 541, 106
- Shakura & Sunyaev (1973) Shakura, N. I., & Sunyaev, R. A. 1973, A&A, 24, 337
- Shen & Matzner (2014) Shen, R.-F., & Matzner, C. D. 2014, ApJ, 784, 87
- Sochora et al. (2011) Sochora, V., Karas, V., Svoboda, J., & Dovčiak, M. 2011, MNRAS, 418, 276
- Stone & Metzger (2014) Stone, N. C., & Metzger, B. D. 2014, MNRAS, submitted (arXiv:1410.7772)
- Strubbe & Quataert (2009) Strubbe, L. E., & Quataert, E. 2009, MNRAS, 400, 2070
- Strubbe & Quataert (2011) —. 2011, MNRAS, 415, 168
- Svoboda et al. (2009) Svoboda, J., Dovčiak, M., Goosmann, R., & Karas, V. 2009, A&A, 507, 1
- Vaughan et al. (2004) Vaughan, S., Fabian, A. C., Ballantyne, D. R., et al. 2004, MNRAS, 351, 193
- Vokrouhlický & Karas (1998) Vokrouhlický, D., & Karas, V. 1998, MNRAS, 298, 53
- Wang et al. (2012) Wang, T.-G., Zhou, H.-Y., Komossa, S., et al. 2012, ApJ, 749, 115
- Young & Reynolds (2000) Young, A. J., & Reynolds, C. S. 2000, ApJ, 529, 101
- Zauderer et al. (2011) Zauderer, B. A., Berger, E., Soderberg, A. M., et al. 2011, Nature, 476, 425
- Zoghbi et al. (2010) Zoghbi, A., Fabian, A. C., Uttley, P., Miniutti, G., et al. 2010, MNRAS, 401, 2419
- Zoghbi et al. (2013) Zoghbi, A., Reynolds, C., Cackett, E. M., et al. 2013, ApJ, 767, 121
- Zubovas et al. (2012) Zubovas, K., Nayakshin, S., & Markoff, S. 2012, MNRAS, 421, 1315