Red–shifted Diffuse Interstellar Bands in Orion OB1 association
Abstract
The wavelength displacement of the Diffuse Interstellar Bands at 4502, 5705, 5780, 6284, and 7224 Å with respect to the well known, narrow atomic/molecular interstellar lines (of Caii and Nai) have been measured in the spectra of the 2 Orion Trapezium stars HD 37022 and HD 37020, using the HARPS–N spectrograph, fed with the 3.5 m Telescopio Nazionale Galileo, and the BOES spectrograph, fed with the 1.8m Korean telescope. The red–shift is 25 km/s for all these DIBs. We discuss the various possible origins of this very peculiar wavelength shift in the light of the particular physical conditions in the Orion Trapezium. The above mentioned shift is seemingly absent in the DIBs at 6196 and 6993 Å.
keywords:
ISM: atoms, molecules, diffuse bands bands1 Introduction
Absorption spectra of interstellar clouds contain well–known molecular bands of simple polar radicals, CH, CN, CH+ which have been discovered and identified long ago (McKellar, 1941). For a long period they were believed to be the only possible interstellar molecules. In 1970-ties small homonuclear molecules (H2, C2) were also found. At the same time, rotational emission features revealed the presence (specifically in the dense ISM, mostly in star–forming regions) of many complex molecules with a dipole momentum; the full list of these polar species (mostly carbon–bearing) currently counts more than 190 entries111see e. g. http://astrochymist.org/astrochymist_ism.html, clearly demonstrating that a rich chemistry, mostly carbon–based, takes place in interstellar clouds. Some of these species have recently been observed in the middle and far infrared by the space telescope Herschel. The largest currently known interstellar molecules are the fullerenes C60 and C70 (Cami et al., 2010; Berné et al., 2013). Yet unknown (unidentified) molecular species are believed to be the carriers of diffuse interstellar bands (DIBs): these make up the longest standing unsolved problem in astronomical spectroscopy. The first two DIBs were discovered in 1921 by Heger (1922). Until 1970 the list of DIBs was very short — only 9 entries. The application of solid state detectors and more powerful telescopes to DIB observations led to the progressive discovery of many additional weak features, almost all of them in the range from the near–UV to the near–IR. The current lists of known DIBs contain over 400 entries (Hobbs et al., 2009; Galazutdinov et al., 2000), the majority of them is very shallow. Some of the weaker features are not unambiguously detected and classified as DIBs in all surveys, e.g. Bondar (2012). Even more importantly, fine structures — reminiscent in some cases of the unresolved rotational envelopes of bands of polyatomic molecules — have been resolved in some DIBs (Kerr et al., 1998). Nearly all conceivable forms of matter, from the hydrogen anion to color centres in dust grains, have already been proposed as DIB carriers. All of them have been rejected, with very few still tentative exceptions. Recently Krełowski et al. (2010) found a very weak DIB which coincides with an electronic, gas–phase band of HC4H+, supporting the molecular DIB origin. Another coincidence between a lifetime–broadened absorption spectrum recorded through a hydrocarbon plasma and a strong DIB at 545 nm was reported by Linnartz et al. (2010), but an unambiguous identification of the carrier has not yet been possible. l–C3H2 was initially proposed by Maier et al. (2011) but this identification would imply this species to be surprisingly abundant in the ISM; moreover, another broad DIB, initially interpreted as a second l–C3H2 feature (from the same level) near 4883Å, clearly has a different origin (Krełowski et al., 2011). Two strong DIBs in the near–IR were tentatively attributed to C by Foing & Ehrenfreund (1994) on the basis of laboratory spectra measured in solid rare–gas matrices, but this was disputed by Jenniskens et al. (1997) and Galazutdinov et al. (2000). Despite the recent detection of the vibrational spectrum of C (Berné et al., 2013), its identification or rejection as DIB carrier still awaits gas–phase laboratory spectra, as yet unavailable. Similarly, Iglesias-Groth et al. (2008, 2012) recently claimed the identification of electronic transitions of gas–phase singly charged naphthalene, the simplest Polycyclic Aromatic Hydrocarbon (PAH) in the spectra of Cernis 52 and, more recently, of HD 125241. In Cernis 52 a well–defined band is firmly detected, which is consistent with the strongest band of C10H. Other, weaker bands are compatible with observations, but their presence is not as firmly established, mainly due to stellar line contamination. In the case of HD 125241, the authors may have been misled by the fact that the spectrum of this star is populated with many stellar emission lines, possibly of circumstellar origin. One of them, centered at 6701.2 Å and due to Siiv, is very broad. Setting the continuum over the red wing of this emission can easily have created a broad depression as an artifact, where the authors identify the strongest naphthalene band. This was never confirmed in any other sources, nor any other features of this molecule have been firmly identified yet on the same source, being at best weak features superimposed on stronger stellar features contaminating them. Iglesias-Groth et al. (2010) also claimed the identification of a band of the anthracene cation (C14H) in the spectrum of Cernis 52. However, this one band is obtained after subtraction of a stronger, very close, overlapping stellar feature, and no other bands of C14H were detected. It was furthermore rebutted by Galazutdinov et al. (2011), so that this claimed identification must be regarded as tentative. No other specific PAH features were found, despite several dedicated efforts (see e. g. Salama et al., 2011; Gredel et al., 2011).
| HD number | RA | Dec | l | b | Sp. type | V (mag) | EB-V | vrad (km/s) |
|---|---|---|---|---|---|---|---|---|
| 22928 | 03 42 55.504 | +47 47 15.17 | 150.2834 | -05.7684 | B5III C | 3.01 | 0.00 | 4.0 km/s |
| 24398 | 03 54 07.922 | +31 53 01.08 | 162.2891 | -16.6904 | B1Ib | 2.85 | 0.31 | 20.6 km/s |
| 37020 | 05 35 15.829 | -05 23 14.36 | 209.0072 | -19.3853 | B0.5V | 6.73 | 0.26 | 28.3 km/s |
| 37022 | 05 35 16.464 | -05 23 22.85 | 209.0107 | -19.3841 | O7V | 5.13 | 0.31 | 23.6 km/s |
After more than 90 years of DIB research, despite having learned much about diffuse and translucent clouds, the identification of DIBs is thus still missing. We emphasize that a vast majority of reddened stars is observed through several translucent clouds. As a result we observe DIBs in ill–defined averages — physical parameters and spectra of individual clouds may be widely different (Krełowski & Westerlund, 1988). The fact that DIBs are most frequently observed through a number of possibly very different clouds is likely to be one of the reasons for their apparent uniformity, washing out individual differences. This conversely makes all “peculiarities” very attractive, as the latter are most likely spectra of individual clouds, where the physical conditions may be more homogeneous than in a random sample of clouds and thus a more sensible, unambiguous physical interpretation of the spectra is possible. The examples of extreme “peculiarities” shown by Krełowski & Westerlund (1988) — namely Sco and Oph — became the archetypes of translucent interstellar clouds of evidently different spectra.
In this sense, objects belonging to Ori OB1 association, a region of active star formation, were discovered to be among the most interesting ones. The stars forming the famous Orion Trapezium are quite substantially reddened, but the clouds obscuring these objects are very peculiar. Their extinction curves are very unusual (Fitzpatrick & Massa, 2007) and the features carried by the simple radicals typically fall below the level of detection. For what concerns DIBs, only two pretty broad ones, at 5780 and 6284 Å, are strong with respect to extinction; the ones at 6196, 6205, 6010, and 5705 Å are detectable but weak (Krełowski & Greenberg, 1999). Krełowski & Greenberg (1999) in the same paper also found rather surprising red–shifts of some DIBs in relation to the interstellar sodium doublet, the only evident atomic line clearly seen in the then available spectra of the Ori OB1 stars. This result was confirmed later by Walker et al. (2001), but only for HD 37061. Since the stability of the rest wavelengths of DIBs is one of their most well–established observational properties, this result is indeed extremely peculiar, and we therefore set out to further investigate it.
The present paper aims to confirm the above results and to relate the peculiar behaviour of DIBs to that of simple molecular species. The point is to use high quality, high resolution spectra from more than one instrument. The Ori OB1 association is the nearest region of active star formation and thus it is very interesting what kind of physical conditions may be caused by the proximity of clouds and young, hot stars and how these conditions may influence the formation of DIB carriers, DIB spectral profiles and wavelength shifts.
2 Observations
We have used the HARPS–N echelle spectrograph222http://www.tng.iac.es/instruments/harps/ (Cosentino et al., 2012), fed with the 3.5 m Telescopio Nazionale Galileo. It offers a resolution of R=115,000 in the spectra, divided into 70 orders. This resolution allows to resolve Doppler components likely present in interstellar features, while the telescope size allows to achieve a high S/N ratio. Moreover, having been designed and built specifically for the main purpose of detecting exoplanets measuring radial velocity variations via accurate determinations of Doppler shifts, HARPS–N has a very stable and reliable wavelength calibration.
In addition, to be able to rule out instrumental artifacts, we also used data of the same targets collected by the BOES echelle spectrograph333http://www.boao.re.kr/BOES/BOESppt3.files/frame.htm (Kim et al., 2007) attached to the 1.8m telescope of the Bohyunsan Observatory in Korea. This instrument can operate in three observational modes providing resolving powers of 30,000, 45,000 and 90,000 respectively. Our spectra were taken using the highest one, enabling us to observe relatively weak, narrow features. In all observational modes the spectrograph records the whole spectral range from 3500 to 10,000 Å divided into 75–76 spectral orders.
All of the data were reduced using IRAF (Tody, 1986) and the DECH data reduction suite, authored and made available444http://www.gazinur.com/DECH-software.html by one of the authors (G. Galazutdinov). Data reduction involved the standard procedure of order location, bias and background subtraction, flatfielding, extraction of 1–D spectra order by order, and wavelength calibration through comparison with a reference spectrum of a Th–Ar lamp. The accuracy of the wavelength calibration and the absence of instrumental effects, which can displace the final wavelength solution, were verified by the cross–correlation of the strong telluric bands present in all studied targets with a reference synthetic telluric spectrum.
The stars we observed are HD 37022 and HD 37020, both in the Orion Trapezium, HD 24398 as a reference “normal DIBs” star, and the bright unreddened star HD 22928, used as a telluric line divisor. Their basic data are given in Table 1.
3 Results
HARPS–N allows very accurate and reliable determinations of wavelengths and this is why we used it in this project. The range covered by the spectrograph (from 3855 to 6910 Å) includes two prominent doublets of Caii and Nai —usually very strong. The Orion Trapezium stars are also known to exhibit strong nebular emission lines (see e. g. Baldwin, 2000), apparently originating in close vicinities of the observed stars. This spectrograph is thus very well–suited to check whether the red–shift of some DIBs reported by Krełowski & Greenberg (1999) can be confirmed.
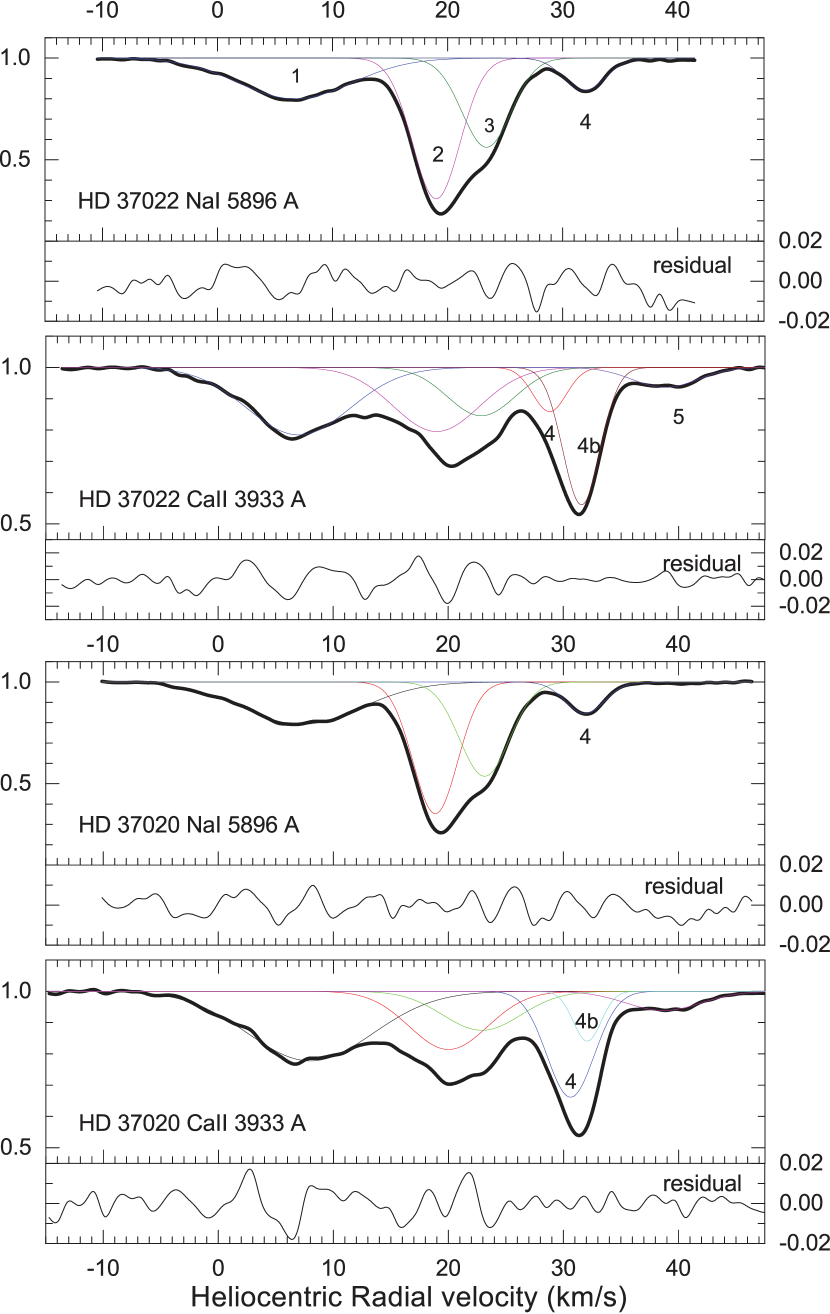
Figure 1 shows a zoom–in of the two atomic lines of NaI at 5896 Å and Caii at 3933 Å in heliocentric radial velocity scale, for the Orion trapezium stars HD 37020 and HD 37022. These stars are separated by less than 13”, and indeed the lines of sight towards both of them appear to traverse very nearly the same foreground ISM, showing almost identical components with the same radial velocities and equivalent widths. Not unusually, while both Nai and Caii show matching components at almost the same radial velocities, intensity ratios are rather different, their respective absolute maxima are in different radial velocity components.
Diffuse band Doppler components usually have a better correlation with neutral rather than with ionized species (Galazutdinov et al., 2004), hence in the following we considered the strongest Nai component as the reference velocity for DIBs.
| HD 37022 | HD 37020 | ||
| rad. vel. (eq. width) | |||
| Comp. 1 | NaI | 6.8 (48.71.3) | 7.2 (52.61.8) |
| CaII | 7.0 (31.70.9) | 8.0 (39.741.3) | |
| Comp. 2 | NaI | 19.0 (70.40.6) | 18.7 (61.80.7) |
| CaII | 19.0 (25.20.8) | 20.0 (20.81.1) | |
| Comp. 3 | NaI | 23.4 (46.00.6) | 23.1 (49.60.8) |
| CaII | 22.8 (14.90.7) | 22.9 (13.90.8) | |
| Comp. 4 | NaI | 31.9 (14.20.5) | 31.9(13.00.6) |
| CaII | 28.8 (6.70.3) | 30.6 (22.80.5) | |
| Comp. 4b | CaII | 31.6 (23.40.4) | 32.1 (6.40.3) |
| Comp. 5 | NaI | — | — |
| CaII | 38.8 (5.90.6) | 38.7 (6.60.7) | |
Table 2 lists the measured components, both in Nai and Caii lines. In Caii it was necessary to use two Gaussians around 30 km/s to account for the slightly asymmetric profile of this velocity component. Only one Gaussian was necessary to fit the matching velocity component of Nai. The velocity component at 40 km/s could only be detected in the Caii line. The uncertainty of radial velocities was estimated by examining the differences between values measured for the same components in the two lines of the Nai and Caii doublets respectively.

Figure 2 unambiguously shows the red–shift of the 5780 Å DIB using the HARPS–N spectra. We used the HD 24398 star as a reference “normal DIBs” object. The latter is known as an object in which all interstellar lines are dominated by a heliocentric Doppler velocity of about 14 km/s (Bondar, 2012), with some structure barely detectable only at extremely high resolution and S/N ratio: Welty et al. (1996) resolved 8 components for Caii with radial velocities between -6 and 22 km/s, but with 80% of the estimated column density being within the range from 13 to 16 km/s. From this figure it is apparent that the maximum of the 5780 Å DIB in HD 37022 is not found at its expected wavelength, but instead it is red–shifted by 0.58 Å, corresponding to a Doppler shift of about 30 km/s with respect to the radial velocity of peak absorption in Nai. While the Doppler structure of the Caii line shows some red–shifted components, the red shift we measured for the 5780 Å DIB goes clearly beyond it, where no atomic absorption component was detected. Less evidently, but measurably, the 5780 Å DIB in HD 37022 is also broader than in HD 24398, by about the same amount.
In the spectrum of HD 37022 we can also detect some nebular emission lines, likely to arise from the Hii region around the same star. The H and two forbidden Nii lines seen in emission appear to have a Doppler red–shift of only a few km/s with respect to the strongest component of the Nai lines, in any case well within the velocity range spanned by the Doppler structure of the Caii lines. The H appears to have a small Doppler shift, a few km/s, with respect to the Nii lines. This agrees with previous studies of the nebular emission from the Orion Trapezium (Baldwin, 2000). Indeed, Baldwin (2000) also found much larger velocity differences among nebular lines due to different species in different ionisation states, suggesting that they arise from different parts of an accelerating wind. Since our observations are centered on the trapezium stars, fainter nebular lines are barely detectable in our spectra, and thus we cannot confirm this.
The H line also shows a superimposed, much broader absorption line. Its width hinders an accurate measurement of its radial velocity. A similar structure, namely an emission line with an underlying, much broader one in absorption, can be seen in H. In H the absorption component is stronger, and it can be seen to be approximately aligned with the radial velocity of the emission component. Upon checking the radial velocity of a few photospheric lines on our HARPS–N data, (e. g. Niii at 4003.6 Å, Hei at 4026.2 Å, Ciii at 4162.9 Å, Siiv at 4212.4 Å, Oii at 4366.9 Å, Oiii at 5508.1 Å, and Civ at 5812.0 Å), they appear consistent with the most current value found in the literature (23.6 km/s Olivares et al., 2013), even if there is some scatter between different lines, at the level of less than 2 km/s. This scatter may be due to the documented variability of stellar lines in HD 37022, attributed to the complex interplay of its magnetic field, fast wind and some infalling material (Simón–Díaz, 2006; Wade, 2006). This is mostly apparent when comparing e.g. the Niii line at 4003.578 Å and the Hei one at 4009.258 Å the Doppler shift of the former corresponds to a heliocentric radial velocity of about 9.5 km/s while the latter of about 41 km/s. However, the vast majority of the observed stellar lines is consistent with a radial velocity of 22–23 km/s .
We did not include HD 37020 in Fig. 2 because it is almost undistinguishable from that of HD 37022, just with very slightly weaker DIBs and somewhat lower S/N ratio, hence it would not add any additional information here (see Fig. 3).

Figure 3 shows a comparison of the DIBs which can be measured in HD 37020, HD 37022, and the reference star HD 24398 with HARPS–N, again in radial velocity scale, using the Doppler shift of the strongest component of the D1 Nai line in the same spectrum as reference. Four of the five DIBs shown, the relatively broad ones, are clearly red–shifted in HD 37020 and HD 37022 with respect to the D1 Nai line marking the zero of the velocity scale. Their shift is compatible with a unique relative radial velocity, and all of them also exhibit a similar broadening with respect to the DIBs measured in the reference star HD 24398. Rather remarkably, the peak of the narrow 6196 Å DIB in HD 37020 and HD 37022 appears to be perfectly aligned (within 5 km/s) with the Doppler velocity of the atomic lines. The ratio of DIB intensity is also evidently different between HD 37022 and HD 24398: in the former the 6284 Å DIB is stronger than the 5780 Å one, while the reverse happens in the latter. Morever, a weak, narrow DIB at 6287 Å appears on the red wing of the 6284 Å DIB in HD 24398, that is below the level of detection in HD 37022.

To further strengthen that the observed redshift is not an (unlikely) instrumental artifact of HARPS–N, Fig. 4 shows the 5780 and 6196 Å DIBs observed in HD 37022 with BOES at slightly lower spectral resolution (90,000 vs 115,000), which precisely match (within 1 km/s) the HARPS–N data. In addition, the same Fig. 4 also shows two more DIBs that are out of the spectral range covered by HARPS–N, namely the 6993 and 7224 Å DIBs. The peak of the former, relatively narrow, precisely matches (within 1 km/s) the Doppler shift of the D1 Nai line, like the 6196 Å DIB. The 7224 Å DIB, conversely, a relatively broad one, appears again red–shifted like the 5780 Å DIB.
For a solid quantitative measurement of the radial velocity shifts visually apparent in Figs. 2, 3, and 4, we used the same method commonly used to precisely measure the radial velocities of stars, correlating their observed spectra with a template (see e. g. Queloz, 1995, and references therein). We performed the correlation analysis one DIB at a time, using as a template the DIB profiles measured in HD 24398. This measurement is not coincident with velocity shifts measured using DIB peaks as a reference, nor is it expected to be: the correlation yields velocity shifts between feature centroids, which would coincide with shifts measured on the peaks only in case of infinite signal to noise ratio and perfectly identical spectral shapes between spectrum and correlation template. Most DIBs are detectably broader in the Orion Trapezium with respect to HD 24398, and noise is clearly far from negligible. Rather remarkably, the only two narrow DIBs, for which the radial velocity shift thus determined is most significant and least sensitive to the determination method, are compatible with zero radial velocity relative to the “interstellar rest frame” given by the strongest components in the Nai D1 and CH 4300 Å lines. This correlation procedure, as implemented both in the DECH and IRAF data reduction softwares, yields the radial velocities maximising the correlation and their standard deviations, via R–statistics analysis. The results are listed in Table 3.
| DIB | HD 37022 | HD 37020 |
|---|---|---|
| 4501.80 Å | +2510 km/s | +3010 km/s |
| 5705.20 Å | +285 km/s | +335 km/s |
| 5780.37 Å | +241 km/s | +231 km/s |
| 6195.97 Å | +34 km/s | +65 km/s |
| 6283.85 Å | +201 km/s | +221 km/s |
| 6993.18 Å | -15 km/s | n/a |
| 7223.91 Å | +271 km/s | n/a |
4 Discussion and conclusions
The red–shift of the DIBs at 4502, 5705, 5780, 6284, and 7224 Å observed in HD 37022 can be interpreted in two different ways: either the peculiar physical conditions along, or around, HD 37022 produce intrinsically different DIB profiles, broader and peaking at a different position, or the observed DIBs are produced by Doppler structure, as possibly hinted by all shifted DIBs sharing (or compatible with) the same red–shift and broadening in velocity scale.
To test the feasibility of this latter hypothesis, we attempted a conditioned least–squares fit of the red–shifted 5780 and 6284 Å DIBs in HD 37022 with a superposition of two “template” DIBs, namely the ones observed in HD 24398. Therefore, the DIB as observed in HD 24398 was assumed as the “intrinsic” profile, and several copies of it with different scalings and Doppler shifts were used to fit the profile observed in HD 37022. The fit was constrained to only two Doppler components, one fixed at the Doppler velocity of the Nai lines, the other free to vary. The free parameters of the fit are therefore only three (for each DIB): the two intensities of the components (constrained to be positive) and the Doppler velocity of the red–shifted component. We used the well–known Levemberg–Marquardt method (Levenberg, 1944), as implemented in the MPFIT package (Markwardt, 2009)555http://purl.com/net/mpfit for IDL. This algorithm strives to numerically reduce the computed between model and data, iteratively modifying an initial guess for the values of the free parameters, until a minimum is found. It is therefore possible to fall into local minima, especially with noisy data, and the solution found will in this case depend on the initial starting point. When several minima exist, they will normally have different values, and some may be rejected on the sole basis of this. However, it may happen that more than one solution has an acceptable value; in this case, some of these may be rejected because the residual (difference between model and data) is clearly not white noise, i. e. with the model falling systematically below the data in some section of the spectrum and above it in another. This indeed happens with our fit here, with several solutions being in principle acceptable on the basis of alone, but with only the best one (i.e. the one with the absolute minimum value) producing a residual of white noise, with uncorrelated adjacent values. To make the determination of the acceptable fit more robust and less subjective, we filtered both the HD 37022 and the template DIBs with a mild smoothing filter (Fourier 5 points filter as implemented in the DECH data reduction suite). This is justified by the fact that HARPS–N spectra are oversampled and the DIBs being fitted are intrinsically rather broad. When using the filtered data, only one acceptable solution is found, which corresponds to the absolute minimum of , while the unphysical ones are not even local minima any more. The resulting, very satisfactory best fits for the 5780 and the 6284 Å DIBs are shown in Figs. 5 and 7.


In both cases, the residual between the fit and the original spectrum is essentially white noise, except for the obvious absence of the narrow DIB at 6287 Å in HD 37022, which is instead present in the reference HD 24398 spectrum and thus appears as an artifact in the residual in Fig. 7. When slightly smoothed spectra are used for the fit, the solution is very robust for both the 5780 and 6284 Å DIBs, and in both cases the additional fitted component results to be red–shifted with respect to interstellar sodium by 34 km/s 40 km/s, the best solution being 35 km/s. When the same fitting procedure is applied to the 5780 and 6284 Å DIBs in HD 37020, due to lower S/N the solution is not unique even after smoothing, but all acceptable solutions yield nonetheless 34 km/s 40 km/s for the radial velocity of the additional component, consistent with what was found for HD 37022. These results can be compared to the radial velocity shifts listed in Table 3. However, since the latter were determined by correlation with a template consisting of a single component, for a meaningful comparison one must compare them with the weighted average of the radial velocities of the two components of the fit performed here, the weights being their relative intensities. This results in very nearly the same numbers of Table 3 for the DIBs at 5780 and 6284 Å. The noise in the other DIBs in HD 37022 and HD 37020 is so high that the fits are not robust (i. e. many equivalently acceptable fit solutions are found) but they are compatible with the results found for the 5780 and 6284 Å DIBs (i. e. km/s is always one of the acceptable solutions of the fit). Therefore, while of course we do not claim that this is the only possible interpretation of the data, we do find it to be possible and self–consistent.
Of course, this then raises more questions: what is producing the redshifted component of the DIBs? Some residual, still infalling material of the young, newly–formed, very early–type stars? Or do they arise in the evaporating layer of the PDR, at the edge of the Hii region? And why is this additional Doppler component not detected in atomic lines? Upon comparing the Doppler structures of the Nai and Caii lines in Fig. 1 and Table 2, there appears to be a temperature gradient with increasing radial velocities, whereby Nai lines decrease while Caii increases, and the highest velocity component is detected only in Caii, but weaker. There may therefore be another, more red–shifted component with a still higher temperature, in which thus sodium and singly ionized calcium are absent, but this is a long stretch with the available data. Observations with a substantially higher S/N ratio would enable us to perform a robust fit on the other three red–shifted DIBs: it is clear that if 5 different DIBs were robustly consistent with the same Doppler structure, yielding the same radial velocity as the only acceptable fit for the additional component of all of them, this would provide rather solid evidence for this interpretation. Conversely, if each DIB were found to require a different radial velocity structure, this would make this interpretation just a pointless mathematical exercise. Furthermore, a substantially higher S/N ratio might also enable us to detect either additional Doppler components in sodium and calcium lines, or weak molecular features (CH, CH+, CN), which are below the detection limit in current data. This would be extremely interesting also because there is some observational evidence that e. g. CH, CH+ and CN features do not always show all the same Doppler components, with CH+ features sometimes shifted with respect to the other species and to atomic lines (see e. g. Allen, 1994).
As to the other possible interpretation, i. e. different intrinsic profiles of the red–shifted DIBs in HD 37022, this is tempting in the light of the recent observations in Herschel 36 (York et al., 2014; Oka et al., 2014a, b). In this extremely peculiar line of sight, CH and CH+ were observed to have an anomalously high rotational temperature, and some DIBs were simultaneously found to be anomalously broad (much more than what we observe here), with a very wide red wing, and the peaks of some of them slightly redshifted (less than what we observe here). This has been tentatively interpreted as unresolved rotational envelopes of molecular bands, which in Herschel 36 appear to have an anomalously high rotational excitation. If this were the correct interpretation for HD 37022, then this would be an intermediate case between the “standard” excitation conditions of the cold neutral ISM, where “normal” DIBs arise, and those prevailing in Herschel 36. However, the DIB at 5797 Å is prominent, and prominently broadened, in Herschel 36, and instead is undetectable in HD 37022; also, the 6196 Å DIB is one of the broadened ones in Herschel 36, while no such effect is evident in our data of HD 37022 (but some limited broadening might be consistent with our observations, hidden by the noise). Also, the 6284 Å DIB is broadened but not redshifted in Herschel 36, while it is redshifted in HD 37022. To test this hypothesis, again it would be useful to obtain deeper observations with higher S/N, to detect CH, CH+ and CN features, determine their rotational temperatures in HD 37022 and explore their relations with the observed profiles and positions of red–shifted DIBs. We remark that HD 37022 and Herschel 36 also have rather peculiar extinction curves (Fitzpatrick & Massa, 2007), hinting that dust properties are also unusual. Actually, Herschel 36 appears to be a tight triple system (Arias et al., 2010; Sanchez–Bermudez et al., 2014). Fitzpatrick & Massa (2007) give for it the spectral classification of the third, most luminous, O 7.5 V type star of the system, which certainly dominates the IUE spectrum they used to derive the extinction. The spectrum in the visible, in which the peculiar DIBs were observed, contains non–negligible contributions from all three unresolved stars. In any case, the extinction curve and DIBs are very likely to be extremely similar for all three stars of such a close system, unless circumstellar material makes a large contribution to them.
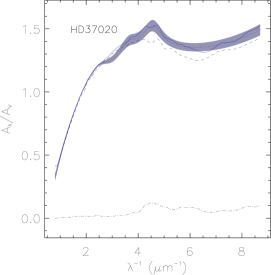
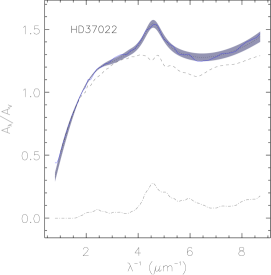
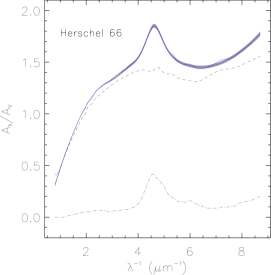
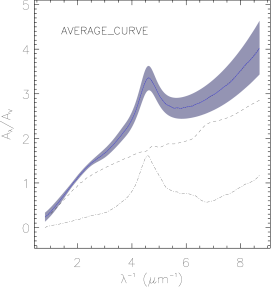
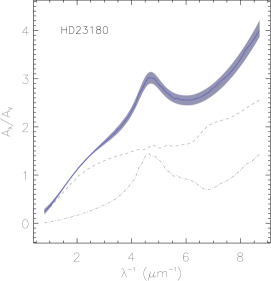
Figure 9 shows the extinction curves reported by Fitzpatrick & Massa (2007) for HD 37020, HD 37022, and Herschel 36, together with their fits with the [CM]2 dust model (Mulas et al., 2013). Figure 10, for comparison, shows the extinction curve of HD 23180 ( Per), the closest proxy of HD 24398 ( Per) available in the sample of Fitzpatrick & Massa (2007), and the average galactic one. The macroscopic dust component appears to be very similar for all the three stars in Fig. 9, all very different from the reference ones in Fig. 10. Upon examining Tables 4 and 5 in Mulas et al. (2013), one sees that in all three cases, upon comparison with the galactic average and HD 23180, the dust population is dominated by large silicatic grains, covered by a thick mantle of heavily processed (entirely, or almost entirely, aromatic) carbonaceous material. PAHs are very underabundant in all of them with respect to the reference ones, similar to the galactic average. In the evolutionary scenario put forward by Cecchi–Pestellini et al. (2014), all three lines of sight appear to be composed of “old”, heavily processed dust.
It is unclear whether both DIBs and the extinction curves are made peculiar by some common physical cause related to the environment, or if DIBs may be altered due to particular dust properties. Red shift and broadening in molecular electronic bands are commonly caused by attachment of molecules to a solid substrate (see e. g. Tielens & Allamandola, 1987). In an environment apparently devoid of small dust particles and PAHs (Mulas et al., 2013), in which apparently smaller nanograins and macromolecules are either destroyed or coalesce onto larger ones, possibly some DIB carriers can also partially attach to grain surfaces, producing what we observe in HD 37022.
Clearly a strategy to pursue to try to find the cause of the red shift of some DIBs in HD 37022, besides obtaining better observations of HD 37022 and valid regardless of the interpretation, would be to find other similar cases, in order to understand what they have in common and thus what makes them different from the “standard” ones. Selecting lines of sight for further DIB observations choosing the ones with peculiar extinction curves similar to that of HD 37022 (Fitzpatrick & Massa, 2007) might be a key in this respect.
Acknowledgments
This paper includes data gathered with the 3.5-m Telescopio Nazionale
Galileo, and data collected with the 1.8 m telescope at Bohyunsan Optical
Astronomy Observatory (South Korea).
JK acknowledges the financial support of the Polish National
Center for Science during the period 2012 - 2015 (grant
UMO-2011/01/BST2/05399).
GAG acknowledges the support of Chilean
fund FONDECYT-regular (project 1120190).
GM and CCP acknowledge the
support of the Autonomous Region of Sardinia, Project CRP 26666 (Regional
Law 7/2007, Call 2010)
References
- Allen (1994) Allen M.M. 1994, ApJ, 424, 754
- Arias et al. (2010) Arias J.I., Barba R.H., Gamen R.C., Morrel N.I., Apellaniz J.M., Alfaro E.J., Sota A., Walborn N.R., Bidin C.M. 2010, ApJ, 710, 30
- Baldwin (2000) Baldwin J.A., Verner E.M., Verner D.A., Ferland G.J., Martin P.G., Korista K.T., Rubin R.H. 2000, ApJS 129, 229
- Berné et al. (2013) Berné O., Mulas G., Joblin C., A&A, 550, L4
- Bovy & Tremaine (2012) Bovy, J. & Tremaine, S. 2012, ApJ, 756, 89
- Bondar (2012) Bondar, A. 2012 MNRAS, 423, 725
- Cami et al. (2010) Cami, J. et al 2010, Science, 329, 1180
- Cecchi–Pestellini et al. (2014) Cecchi–Pestellini, C., Casu, S., Mulas, G., Zonca, A. 2014, ApJ 785, 41
- Cosentino et al. (2012) Cosentino, R., Lovis, C., Pepe, F., Collier Cameron, A., Latham, D. W., Molinari, E., Udry, S., Bezawada, N., Black, M., Born, A., Buchschacher, N., Charbonneau, D., Figueira, P., Fleury, M., Galli, A., Gallie, A., Gao, X., Ghedina, A., Gonzalez, C., Gonzalez, M., Guerra, J., Henry, D., Horne, K., Hughes, I., Kelly, D., Lodi, M., Lunney, D., Maire, C., Mayor, M., Micela, G., Ordway, M. P., Peacock, J., Phillips, D., Piotto, G., Pollacco, D., Queloz, D., Rice, K., Riverol, C., Riverol, L., San Juan, J., Sasselov, D., Segransan, D., Sozzetti, A., Sosnowska, D., Stobie, B., Szentgyorgyi, A., Vick, A., & Weber, L., 2012, SPIE conf. ser. 8446, 1
- Dahlstrom et al. (2013) Dahlstrom, J., York, D.G., Welty, D.E., Oka, T., Hobbs, L.M., Johnson, S., Friedman, S.D., Jiang, Z., Rachford, B.L., Sherman, R., Snow, T.P., Sonnentrucker, P. 2013, ApJ 773, 41
- Ducati (2002) Ducati J.R. 2002, VizieR Online Data Catalog 2237, 0
- Foing & Ehrenfreund (1994) Foing, B. H. & Ehrenfreund, P. 1994, Nature, 369, 296
- Fitzpatrick & Massa (2007) Fitzpatrick, E.L. & Massa, D. 2007, ApJ, 663, 320
- Galazutdinov et al. (2011) Galazutdinov, G. A., Lee, Byeong-Cheol, Song, In-Ok, Kazmierczak, M., Krelowski, J., 2011, MNRAS, 412,1259
- Galazutdinov et al. (2004) Galazutdinov, G. A., Manico, G., Pirronello, V., Krełowski, J. 2004, MNRAS, 355, 169
- Galazutdinov et al. (2000) Galazutdinov, G. A., Krelowski, J., Musaev, F. A., Ehrenfreund, P., Foing, B. H., 2000, MNRAS, 317, 750
- Galazutdinov et al. (2000a) Galazutdinov, G. A., Musaev, F. A., Krelowski, J., Walker, G. A. H., 2000, PASP, 112, 648
- Gontcharov (2006) Gontcharov G.A. 2006, Ast. Lett. 32, 759
- Gredel et al. (2011) Gredel, R., Carpentier, Y., Rouillè, G., Steglich, M., Huisken, F., Henning, Th. 2011, A&A 530, 26
- Grunhut (2012) Grunhut J.H., Wade G.A., Sundqvist J.O., ud–Doula A., Neiner C., Ignace R., Marcolino W.L.F., Rivinius Th., Fullerton A., Kaper L., Mauclaire B., Buil C., Garrel T.., Ribeiro J., Ubaud S. 2012, MNRAS 426, 2208
- Heger (1922) Heger, M.L. 1922, Lick Obs. Bull. 10, 141
- Hobbs et al. (2009) Hobbs, L.M. et al. 2009, ApJ, 705, 32
- Iglesias-Groth et al. (2008) Iglesias-Groth, S., Manchado, A., Garc??a-Hernandez, D. A., Gonzalez Hernandez, J. I., Lambert, D. L., 2008, ApJ, 685, 55
- Iglesias-Groth et al. (2012) Iglesias-Groth, S., González Hernández, J., Manchado, A. 2012, MNRAS 420, 2785
- Iglesias-Groth et al. (2010) Iglesias-Groth, S., Manchado, A., Rebolo, R., González Hernández, J.I., Garcia-Hernández, D.A., Lambert, D.L. 2010, MNRAS 407, 2157
- Jenniskens et al. (1997) Jenniskens, P., Mulas, G., Porceddu, I. & Benvenuti, P. 1997, A&A, 327, 337
- Kerr et al. (1998) Kerr et al. 1998, ApJ, 495, 941
- Kim et al. (2007) Kim, K.–M., Han, I., Valyavin, G.G., Plachinda, S., Jang, J.G., Jang, B.–H., Seong, H.C., Lee, B.–C, Kang, D.–I., Park, B.–G., Yoon, T.S., Vogt, S.S., 2007, PASP 119, 1052
- Krełowski & Westerlund (1988) Krełowski, J. & Westerlund, B.E. 1988, A&A, 190, 339
- Krełowski & Greenberg (1999) Krełowski, J. & Greenberg, J.M. 1999, A&A, 346, 199
- Krełowski et al. (2010) Krełowski et al. 2010, ApJL, 714, 64
- Krełowski et al. (2011) Krełowski et al. 2011, ApJ 735, 124
- Levenberg (1944) Levenberg, K. 1944, Quarterly of Applied Mathematics 2, 164
- Linnartz et al. (2010) Linnartz, H. et al. 2010, A&A, 511, L3
- Maier et al. (2011) Maier, J. et al. 2011, ApJ, 726, 41
- Markwardt (2009) Markwardt C.B. 2009, Astronomical Data Analysis Software and Systems XVIII, 411, 251
- Mason (1998) Mason B.D., Gies D.R., Hartkopf W.I., Bagnuolo W.G. Jr., ten Brummelaar T., McAlister H.A. 1998, AJ 115, 821
- McKellar (1941) McKellar, A. 1941, PASP, 53, 233
- Mulas et al. (2013) Mulas G., Zonca A., Casu S., Cecchi–Pestellini C. 2013, ApJS, 207, 7
- Nazé (2009) Nazé Y. 2009, A&A 506, 1055
- Oka et al. (2014a) Oka, T., Welty, D.E., Johnson, S., York, D.G., Dahlstrom, J., Hobbs, L.M. 2014, IAU Symposium 297 “The Diffuse Interstellar Bands”, Eds. Cami J., Cox N.L.J., page 94
- Oka et al. (2014b) Oka, T., Welty, D.E., Johnson, S., York, D.G., Dahlstrom, J., Hobbs, L.M. 2014, ApJ 773, 42
- Olivares et al. (2013) Olivares J., Sánchez L.J., Ruelas-Mayorga A., Allen C., Costero R., Poveda, A. 2013, AJ 146, 106
- Queloz (1995) Queloz D., 1995, IAU symposium 167 “New Developments in Array Technology and Applications”, Eds. Philip A.G.D., Janes K.A., Upgren A.R., page 221
- Pourbaix et al. (2004) Pourbaix D., Tokovinin A.A., Batten A.H., Fekel F.C., Hartkopf W.I., Levato H., Morrell N.I., Torres G., Udry, S. 2004, A&A 424, 727
- Salama et al. (2011) Salama, F., Galazutdinov, G.A., Krełowski, J., Biennier, L., Beletsky, Y., Song, In-Ok 2011, ApJ 728, 154
- Sanchez–Bermudez et al. (2014) Sanchez–Bermudez, J., Alberdi, A., Schödel, R., Hummel, C.A., Arias, J.I., Barbá, R.H.; Maíz Apellániz, J. & Pott, J.–U. 2014, A&A 572, L1
- Simón–Díaz (2006) Simón–Díaz S., Herrero A., Esteban C., Najarro F. 2006, A&A 448, 351
- Tielens & Allamandola (1987) Tielens A.G.G.M., & Allamandola L.J. 1987, in “Interstellar Processes”, proceedings of the Symposium, Grand Teton National Park, WY, July 1-7, 1986 (A88-14501 03-90). Dordrecht, D. Reidel Publishing Co.,1987, p. 397
- Tody (1986) Tody, D. 1986, ”The IRAF Data Reduction and Analysis System” in Proc. SPIE, Instrumentation in Astronomy VI, ed. D.L. Crawford, 627, 733
- York et al. (2014) York, D.G., Dahlstrom, J., Welty, D. E., Oka, T., Hobbs, L.M., Johnson, S., Friedman, S. D., Jiang, Z., Rachford, B. L., Snow, T. P., Sherman, R., Sonnentrucker, P. 2014, IAU Symposium 297 “The Diffuse Interstellar Bands”, Eds. Cami J., Cox N.L.J., page 89
- Wade (2006) Wade G.A., Fullerton A.W., Donati J.–F., Landstreet J.D., Petit P., Strasser S. 2006, A&A 451, 195
- Walker et al. (2001) Walker, G.A.H., Webster, A.S., Bohlender, D.A. & Krełowski, J. 2001, ApJ, 561 272
- Welty et al. (1996) Welty D.E., Morton D.C. & Hobbs L.M. 1996, ApJS 106, 533
- Wenger et al. (2000) Wenger, M., Ochsenbein, F., Egret, D., Dubois, P., Bonnarel, F., Borde, S., Genova, F., Jasniewicz, G., Laloë, S., Lesteven, S., Monier, R. 2000, A&AS 143, 9