Can FSRQs produce the IceCube detected diffuse neutrino emission?
Abstract
IceCube has reported the detection of a diffuse TeV-PeV neutrino emission, for which the flat spectrum radio quasars (FSRQs) have been proposed to be the candidate sources. Here we assume that the neutrino flux from FSRQs is proportional to their gamma-ray ones, and obtain the gamma-ray/neutrino flux ratio by the diffuse gamma-ray flux from Fermi-LAT measurement of FSRQs and the diffuse neutrino flux detected by IceCube. We apply this ratio to individual FSRQs and hence predict their neutrino flux. We find that a large fraction of candidate FSRQs from the northern sky in the IceCube point source search has predicted neutrino flux above the IceCube upper limit; and for the sample of stacking search for neutrinos by IceCube, the predicted stacked flux is even larger than the upper limit of stacked flux by orders of magnitude. Therefore the IceCube limit from stacking searches, combined with the Fermi-LAT observations, already rejects FSRQs as the main sources of IceCube-detected diffuse neutrinos: FSRQs can only account for () of the IceCube-detected diffuse neutrino flux, according to the stacking searches from the whole (northern) sky. The derived neutrino/gamma-ray flux ratio is , also implying that the gamma-ray emission from FSRQs cannot be produced by the secondary leptons and photons from the pion production processes. The caveat in the assumptions is discussed.
1 Introduction
The detection of extraterrestrial diffuse TeV-PeV neutrino emission has been reported recently by IceCube collaboration (Aartsen et al., 2013; IceCube Collaboration, 2013; Aartsen et al., 2014a) with an excess to the atmospheric background up to 5.7 (Aartsen et al., 2014a). The single flavor neutrino spectrum can be fitted with a flat form (Aartsen et al., 2014a)
| (1) |
from tens TeV up to 2 PeV, assuming flavor ratio of 1:1:1. The lack of neutrino events above 2 PeV may suggest a cutoff at the neutrino spectrum. The sky distribution of the neutrino events is consistent with being isotropic (Aartsen et al., 2014a) and hence of extragalactic origin, but the low statistics so far cannot make any solid conclusion. There are many models proposed to explain these diffuse neutrinos, e.g., produced by Galactic cosmic ray (CR) propagation or Galactic point sources (Gupta, 2013; Neronov et al., 2013; Ahlers and Murase, 2014; Razzaque, 2013; Lunardini et al., 2013; Joshi et al., 2014; Guo et al., 2013; Taylor et al., 2014), by extragalactic sources such as gamma-ray bursts (GRBs) (Waxman & Bahcall, 1997; Murase & Ioka, 2013; Cholis & Hooper, 2013; Liu & Wang, 2013), active galactic nuclei (AGN) jets (Murase et al., 2014; Dermer et al., 2014; Padovani & Resconi, 2014; Mücke et al., 2003) or cores (Stecker, 2013), star forming galaxies (Murase et al., 2013; Liu et al., 2013; He et al., 2013; Anchordoqui et al., 2014a; Tamborra et al., 2014) and starbutrst galaxies (Loeb & Waxman, 2006; Wang et al., 2014), and by cosmogenic neutrinos from ultrahigh energy CR interactions with cosmic microwave background (CMB) (Kalashev et al., 2013; Laha et al., 2013; Roulet et al., 2013). By using the Fermi-LAT observations and considering the gamma-ray and neutrino flux correlation, Wang et al. (2014) suggested that only starburst galaxies and AGN jets in the above mentioned scenarios may produce the neutrino flux detected by IceCube. We further investigate the AGN jet origin in this paper.
AGNs have long been considered as ultrahigh energy CR sources, and hence producing neutrinos through photo-pion processes. Ref Murase et al. (2014); Dermer et al. (2014) suggested that CRs accelerated in the inner jets of AGNs, especially flat spectrum radio quasars (FSRQs), interact with photons from the broad-line region (BLR), can produce neutrinos that may account for the IceCube detected PeV neutrino flux. The Fermi Large Area Telescope (LAT) already provides us a deep survey of the sky from about MeV to several hundred GeV. Based on the 2-year observation of Fermi-LAT, the FSRQs’ luminosity function (LF) and redshift distribution are well determined (Ajello et al., 2012). Assuming a correlation between the gamma-ray and neutrino fluxes from FSRQs, we constrain the neutrino emission by FSRQs using gamma-ray flux from Fermi-LAT observations, in order to examine the FSRQ scenario for IceCube detected neutrinos. In Section 2 we describe the assumption and the method of the analysis, Section 3 shows the data and results, and conclusion and discussion are presented in Section 4.
2 Assumption and method
We assume that (1) the gamma-ray and neutrino fluxes from FSRQs are proportional to each other; and (2) FSRQs can account for the diffuse neutrino flux detected by IceCube. The following analyses are all carried out under these two assumptions.
There are leptonic and hadronic models for blazar gamma-ray emission (Böttcher et al., 2013). In the leptonic model the FSRQ gamma-ray emission is produced by electrons accelerated in the inner jet upscattering background soft photons from self produced synchrotron radiation or the accretion disk and BLR. On the other hand, in the hadronic model the FSRQ gamma-ray emission is mainly produced by CR proton synchrotron radiation***We can rule out that in the hadronic model the gamma-ray emission from FSRQs can be produced by secondary leptons and photons from photopoin process, given the result of eq. (4) below. See the discussion in the last section.. In both cases assumption (1) is reasonable if the energy ratio between the jet accelerated electrons and CRs is constant. Moreover, assumption (1) should be more reasonable and valid in a statistic sense, although it may not tightly hold for individual FSRQs.
The FSRQs are bright sources in the gamma-ray sky. The luminosity function (LF) and redshift evolution of FSRQs have well been developed by Ajello et al. (2012) based on the 2 years survey by Fermi-LAT. The all sky (i.e., integrated) diffuse gamma-ray emission produced by FSRQs is determined to be
| (2) |
in the energy range of 0.1-100 GeV (see more details for the derivation in the appendix).
According to the flat spectrum IceCube detected (eq. 1), the diffuse single-flavor neutrino flux in the energy range of 20 TeV-2 PeV is
| (3) |
If FSRQs can account for the IceCube detected flux, the ratio of neutrino (20 TeV-2 PeV) to -ray (0.1-100 GeV) flux for FSRQs is then
| (4) |
Applying this ratio to individual FSRQs with gamma-ray flux measured we can estimate their neutrino flux.
Analyzing the 4-year data, the IceCube presented results of searching for astrophysical neutrinos from candidate sources (Aartsen et al., 2014c). The non-detection only gives upper limits to the candidate sources based on the IceCube sensitivity. For an spectrum, the median sensitivity is in the northern sky for energies of 1TeV-1PeV, and in the southern sky for energies of 0.1-100PeV (Aartsen et al., 2014c). Thus we pay more attention to the candidate objects in the northern sky since they are more strongly constrained by IceCube observations. We will compare the predicted neutrino fluxes to the limits given by IceCube for individual and stacked FSRQs, thus examine the FSRQ origin of the diffuse neutrino emission.
3 Data and results
3.1 Candidate sources
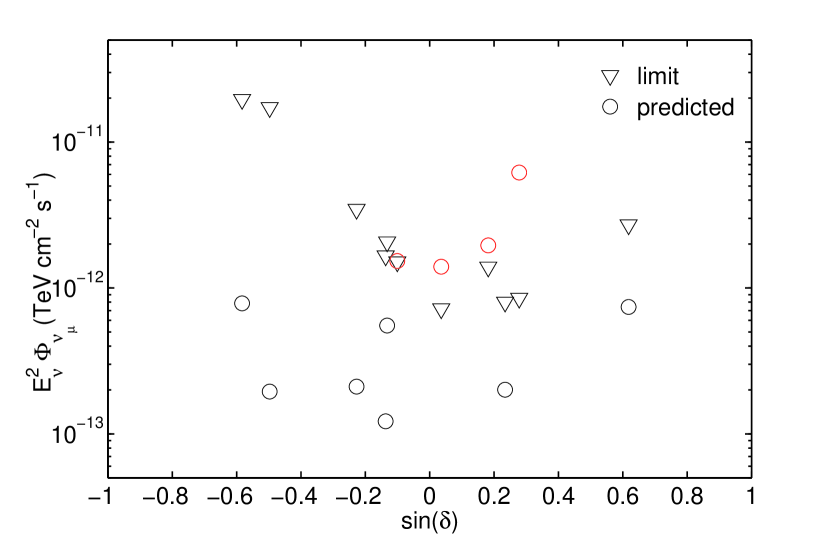
IceCube has searched for neutrino emission from 44 candidate sources, among which there are 11 FSRQs, 5 in the northern sky and 6 in the southern sky (Aartsen et al., 2014c). The non-detection by IceCube puts upper limits of neutrino flux to these sources. With the gamma-ray/neutrino flux ratio of Eq. 4, we predicted the neutrino flux from them using gamma-ray flux for individual FSRQs from the Fermi-LAT 2-year point source catalog (2FGL)†††http://fermi.gsfc.nasa.gov/ssc/data/access/lat/2yr_catalog. The results are presented in Table 1, and the comparison between predicted flux and the IceCube limit is shown in Fig 1.
The sensitivity of IceCube for point sources depends strongly on the source declination, as shown in Fig. 11 in Aartsen et al. (2014c) (also shown in Fig 2 here). The typical sensitivity in the southern sky, , is much larger than the predicted neutrino fluxes. However, the sensitivities in the northern sky is much higher, and 3 of the 5 northern sources are with predicted fluxes above the upper limits. In details, the predicted flux of the source 3C 454.3 is larger than the upper limit by a factor of 7.3, PKS 1506+106 by 1.4, and 3C 273 by 2.0.
| FSRQs | r.a. | dec | |||
| Northern Sky | |||||
| 4C 38.41 | 248.81 | 38.17 | 1.44 | 0.74 | 2.71 |
| 3C 454.3 | 343.50 | 16.15 | 12.02 | 6.18 | 0.85 |
| PKS 0528+134 | 82.71 | 13.55 | 0.39 | 0.20 | 0.80 |
| PKS 1502+106 | 226.10 | 10.49 | 3.82 | 1.96 | 1.39 |
| 3C 273 | 187.28 | 2.04 | 2.72 | 1.40 | 0.72 |
| Southern Sky | |||||
| 3C 279 | 194.04 | -5.79 | 2.98 | 1.53 | 1.51 |
| QSO 2022-077 | 306.42 | -7.61 | 1.08 | 0.55 | 2.07 |
| PKS 1406-076 | 212.24 | -7.87 | 0.24 | 0.12 | 1.66 |
| QSO 1730-130 | 263.28 | -13.13 | 0.41 | 0.21 | 3.46 |
| PKS 1622-297 | 246.53 | -29.81 | 0.30 | 0.20 | 17.2 |
| PKS 1454-354 | 224.36 | -35.67 | 1.21 | 0.79 | 19.6 |
Note - The columns from left to right show: the FSRQ names; the right ascension and declination of the sources; the gamma-ray flux measured by Fermi-LAT in the 0.1-100GeV energy range (in unit of ); the predicted flux in unit of , assuming flux normalization and even flavor ratio of 1:1:1; and the upper limit of flux (in unit of ) in the 90% confidence level from IceCube, assuming flux normalization. The source names in bold face mark those FSRQs with predicted flux violating the upper limit.
3.2 Stacking sample
Since it is usually null result for detection of individual sources, IceCube also carried out stacking searches for different classes of objects (Aartsen et al., 2014c). For FSRQs, they select 33 sources based on the measured Fermi-LAT gamma-ray flux, assuming prevalence of photo-hadronic neutrino production. The upper limit in the 90% confidence level, for a flux normalization of flux, is for the total flux of the whole sample in the stacking analysis. So the limit for each FSRQ on average obtained from stacking is smaller by 33,
| (5) |
This is already smaller than all the predicted flux for individual FSRQs in the sample list (see Table 2).
Since the detection of muon and anti-muon neutrinos by IceCube depends sensitively on the declination of the source, we may focus more on the directions of the sky with higher sensitivity, especially the northern sky. The FSRQ sample in the stacking search by IceCube includes 19 in the northern sky and 14 in the southern sky. We here derive the upper limit for the 19 northern ones.
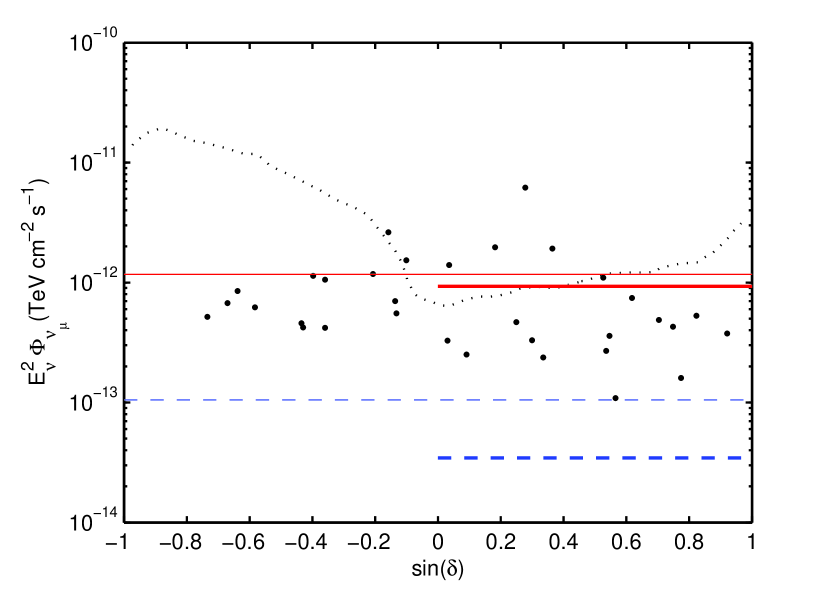
As the upper limits are basically given by the sensitivity, and the sensitivity as function of declination () has been given by IceCube (Fig 11 in (Aartsen et al., 2014c)), we may estimate the upper limit of individual sources by the sensitivity at their declinations. The ratio of the upper limit for stacking 19 northern FSRQs, , to that for the whole-sky 33 ones, , is
| (6) |
where is the sensitivity at declination , and () is the declination of No. () source. The average upper limit for the 19 northern-sky FSRQs, , is then
| (7) |
Here can be evaluated by the 4-year sensitivity of IceCube in 90% confidence level (Fig.2), (see more details in the appendix). Thus the upper limit of the flux per source from the northern sky is
| (8) |
which is about 3 times more stringent than the limit from the whole sample of FSRQs (eq 5).
By the method introduced in Section 2, the predicted flux per source (i.e., the total flux divided by the source number) for the whole sample is
| (9) |
Note, compared with the limit of eq. (5), the prediction is about 11 times larger. As for the 19 northern-sky FSRQs, the predicted average flux after stacking is
| (10) |
Thus the predicted flux is even 27 times larger than the limit for the northern sky FSRQs (eq. 8). We show in Fig 2 the predicted fluxes of the 33 FSRQs, as well as the predicted stacked flux and the upper limit for the northern-source stacking.
4 Conclusion and Discussion
We derive the muon neutrino (and anti-muon neutrino) flux of FSRQs under the assumptions that there is a connection between the gamma-ray and neutrino fluxes, and that FSRQs can account for the diffuse neutrino flux detected by IceCube. By comparing the derived flux and the limit for FSRQs from 4 years of running time of IceCube, we find that (i) a significant fraction of the candidate FSRQs, 3 among 5, has derived flux larger than the upper limit, in particular, 3C 454.3 is predicted to be exceeding the IceCube upper limit by a factor of 7; and (ii) in the sample selected for IceCube stacking search, the predicted flux is more than one order of magnitude larger than the upper limit for the whole sample, and even 27 times larger for the northern sample which has stringent limit by IceCube.
The confliction between the prediction and the observation implies that at least one of the assumptions is wrong. If the first assumption is valid, the second one will not hold, i.e., FSRQs are not the main sources of the diffuse neutrino emission. By the contrast between the predicted flux and the upper limit for the stacked sample, FSRQs produce at most of the IceCube-detected diffuse neutrino flux. Furthermore, according to the constraint from the northern-sky sample FSRQs can only produce a diffuse neutrino flux of the IceCube-detected one.
As the sensitivity improves with running time (roughly ), the IceCube observation in coming years will make more stringent constraint on the FSRQ origin of diffuse neutrino emission. In particular, the FSRQs in the sky region that IceCube has better sensitivity are favored to be selected to constrain their neutrino flux, and hence make more stringent constraint on FSRQ neutrino flux, e.g., those sources in the region of according to the IceCube sensitivity dependence of declination (Fig 2).
It should be noted that the sample of 33 FSRQs selected by IceCube collaboration in the stacking search is selected with the weight of the measured gamma-ray flux by Fermi-LAT. This approach is consistent with our assumption that the gamma-ray and neutrino fluxes are well correlated. So we can use this sample for our purpose. Moreover, we note that if for some reason the faint FSRQs produce larger neutrino emission than bright ones, then our method and conclusion are not valid. However, since the contrast between the prediction and the limit is by orders of magnitude, we may have strong confidence to reject the FSRQ origin scenario for diffuse neutrino emission.
An implication from eq (4) is that the FSRQ gamma-ray emission cannot be produced by the secondary leptons and photons in the pion production processes. The energy carried by neutrinos and secondary leptons plus photons are comparable, thus one expects comparable neutrino and gamma-ray fluxes from pion production processes, , in contrast with eq (4). (eq 4) can only appear in unreal cases where pions loose energy rapidly by radiation before decay into neutrinos.
Acknowledgments
We thank J. Feintzeig for providing the list of the FSRQ sample in the stacking search, K. Schatto and M. Ajello for helpful discussion, and the referee for very critical comments. This work is partly supported by NSFC (11273005), SRFDP (20120001110064), and the 973 Program (2014CB845800).
References
- Aartsen et al. (2013) Aartsen, M. G., Abbasi, R., Abdou, Y., et al. 2013, Phys. Rev. Lett., 111, 021103
- Aartsen et al. (2014a) Aartsen, M. G., Ackermann, M., Adams, J., et al. 2014a, Phys. Rev. Lett., 113, 101101
- Aartsen et al. (2014c) Aartsen, M. G., Ackermann, M., Adams, J., et al. 2014, ApJ, 796, 2
- Ahlers and Murase (2014) Ahlers, M., & Murase, K. 2014, Phys. Rev. D, 90, 023010
- Ajello et al. (2012) Ajello, M., Shaw, M. S., Romani, R. W., et al. 2012, ApJ, 751, 108
- Anchordoqui et al. (2014a) Anchordoqui, L. A., Goldberg, H., Lynch, M. H., et al. 2014, Phys. Rev. D, 89, 083003
- Böttcher et al. (2013) Böttcher, M., Reimer, A., Sweeney, K., & Prakash, A. 2013, ApJ, 768, 54
- Cholis & Hooper (2013) Cholis, I., & Hooper,D. 2013, JCAP, 6, 030
- Dermer et al. (2014) Dermer, C. D., Murase, K., Inoue, Y. 2014, arXiv:1406.2633
- Guo et al. (2013) Guo, Y. Q., Hu, H. B., Yuan, Q., Tian, Z., & Gao, X. J. 2013, arXiv:1312.7616
- Gupta (2013) Gupta, N. 2013, arXiv:1305.4123
- He et al. (2013) He, H.-N., Wang, T., Fan, Y.-Z., Liu, S.-M., & Wei, D.-M. 2013, Phys. Rev. D, 87, 063011
- IceCube Collaboration (2013) IceCube Collaboration 2013, Science, 342, 6161
- Joshi et al. (2014) Joshi, J. C., Winter, W., & Gupta, N. 2014, MNRAS, 439, 3414
- Kalashev et al. (2013) Kalashev, O. E., Kusenko, A., & Essey, W. 2013, Phys. Rev. Lett., 111, 041103
- Laha et al. (2013) Laha, R., Beacom, J. F., Dasgupta, B., Horiuchi, S., & Murase, K. 2013, Phys. Rev. D 88, 043009
- Liu et al. (2013) Liu, R.-Y., Wang, X.-Y., Inoue, S., Crocker, R., & Aharonian, F. 2013, arXiv:1310.1263
- Liu & Wang (2013) Liu, R.-Y., Wang, X.-Y., 2013, ApJ, 766, 73
- Loeb & Waxman (2006) Loeb, A., & Waxman, E. 2006, JCAP, 5, 3
- Luis A. Anchordoqui et al. (2013) Luis A. Anchordoqui, Vernon Barger, Ilias Cholis et al. 2013, arXiv:1312.6587
- Lunardini et al. (2013) Lunardini, C., Razzaque, S., Theodoseau, K. T., & Yang, L. 2013, arXiv:1311.7188
- Mücke et al. (2003) Mücke, A., Protheroe, R. J., Engel, R., Rachen, J. P., & Stanev, T. 2003, Astroparticle Physics, 18, 593
- Murase et al. (2013) Murase, K., Ahlers, M., & Lacki, B. C. 2013, Phys. Rev. D, 88, 121301
- Murase & Ioka (2013) Murase, K., & Ioka, K. 2013, Phys. Rev. Lett., 111, 121102
- Murase et al. (2014) Murase, K., Inoue, Y., & Dermer, C. D. 2014, arXiv:1403.4089
- Neronov et al. (2013) Neronov, A., Semikoz, D. V., & Tchernin, C. 2013, arXiv:1307.2158
- Padovani & Resconi (2014) Padovani, P., & Resconi, E. 2014, MNRAS, 443, 474
- Razzaque (2013) Razzaque S. 2013, arXiv:1310.5123
- Roulet et al. (2013) Roulet, E., Sigl, G., van Vliet, A., & Mollerach, S. 2013, JCAP, 1301, 028
- Stecker (2013) Stecker, F. W., 2013, Phys. Rev. D88, 047301
- Tamborra et al. (2014) Tamborra, I., Ando, S., & Murase, K. 2014, JCAP, 9, 43
- Taylor et al. (2014) Taylor, A. M., Gabici, S., & Aharonian, F. 2014, arXiv:1403.3206
- Wang et al. (2014) Wang, B., Zhao, X. H. & Li, Z., 2014, JCAP, 11, 028
- Waxman & Bahcall (1997) Waxman, E., & Bahcall, J. 1997, Phys. Rev. Lett., 78, 2292
Appendix A Calculation of diffuse gamma-ray flux from FSRQs
The all-sky integrated intensity of the diffuse gamma-ray emission contributed by FSRQs can be derived as
| (A1) |
where is the redshift, is the source photon index, is the rest frame 0.1-100 GeV -ray luminosity, and is the gamma-ray flux,
| (A2) |
with the luminosity distance of the source. Following Ajello et al. (2012) the distribution of FSRQs can be written as
| (A3) |
where is the LF, is the photon index distribution, assumed to be a Gaussian distribution with mean and dispersion and independent of ,
| (A4) |
and is the comoving volume element per unit redshift, where is the comoving distance. A standard concordance cosmology is assumed, with and , thus
| (A5) |
and .
| (A8) |
and
| (A9) |
Here and are in unit of .
The limits of the integration in Eq. A1 are erg s-1, erg s-1, , , and . The parameters in the LDDE model have been determined by the fitting of the Fermi-LAT data, , , , , , , , , , and . We calculate the all-sky diffuse gamma-ray flux from FSRQs using these parameter values, and give .
Appendix B The FSRQs in the stacking search of IceCube
We show the sample of the stacking search in Table 2, with the sensitivity of IceCube of the relevant declinations shown, as well as the predicted fluxes. Summing up the sensitivity for the northern objects only and for the whole sample gives
| (B1) |
| FSRQs | |||
|---|---|---|---|
| Northern Sky | |||
| 2FGL J1849.4+6706 | 0.92 | 0.38 | 2.30 |
| 2FGL J0957.7+5522 | 0.82 | 0.53 | 1.49 |
| 2FGL J0654.5+5043 | 0.77 | 0.16 | 1.41 |
| 2FGL J1312.8+4828 | 0.75 | 0.43 | 1.40 |
| 2FGL J0920.9+4441 | 0.70 | 0.49 | 1.33 |
| 2FGL J1635.2+3810 | 0.62 | 0.74 | 1.23 |
| 2FGL J0043.7+3426 | 0.57 | 0.11 | 1.20 |
| 2FGL J0719.3+3306 | 0.55 | 0.36 | 1.20 |
| 2FGL J1310.6+3222 | 0.54 | 0.27 | 1.18 |
| 2FGL J1522.1+3144 | 0.53 | 1.10 | 1.17 |
| 2FGL J1224.9+2122 | 0.36 | 1.92 | 0.90 |
| 2FGL J0714.0+1933 | 0.33 | 0.24 | 0.93 |
| 2FGL J2203.4+1726 | 0.30 | 0.33 | 0.92 |
| 2FGL J2253.9+1609 | 0.28 | 6.18 | 0.89 |
| 2FGL J0725.3+1426 | 0.25 | 0.47 | 0.87 |
| 2FGL J1504.3+1029 | 0.18 | 1.96 | 0.77 |
| 2FGL J1016.0+0513 | 0.09 | 0.25 | 0.73 |
| 2FGL J1229.1+0202 | 0.04 | 1.40 | 0.64 |
| 2FGL J0217.9+0143 | 0.03 | 0.33 | 0.63 |
| Southern Sky | |||
| 2FGL J1256.1-0547 | -0.10 | 1.53 | 1.17 |
| 2FGL J2025.6-0736 | -0.13 | 0.55 | 1.82 |
| 2FGL J0808.2-0750 | -0.14 | 0.70 | 1.83 |
| 2FGL J1512.8-0906 | -0.16 | 2.62 | 2.19 |
| 2FGL J0730.2-1141 | -0.20 | 1.17 | 3.16 |
| 2FGL J1833.6-2104 | -0.36 | 1.05 | 5.53 |
| 2FGL J1923.5-2105 | -0.36 | 0.42 | 5.53 |
| 2FGL J0457.0-2325 | -0.40 | 1.13 | 6.28 |
| 2FGL J1625.7-2526 | -0.43 | 0.42 | 6.96 |
| 2FGL J1246.7-2546 | -0.44 | 0.46 | 7.07 |
| 2FGL J1457.4-3540 | -0.58 | 0.62 | 11.64 |
| 2FGL J1802.6-3940 | -0.64 | 0.85 | 12.20 |
| 2FGL J1428.0-4206 | -0.67 | 0.67 | 13.31 |
| 2FGL J2056.2-4715 | -0.73 | 0.52 | 14.41 |
Note - The last two columns are the predicted flux and the 90% confidence level sensitivity (for muon and anti-muon neutrinos) of the 4 years of IceCube running time at the declination of the relevant source. Both are in unit of .