Crack front dynamics: the interplay of singular geometry and crack instabilities
Abstract
When fast cracks become unstable to microscopic branching (micro-branching), fracture no longer occurs in an effective 2D medium. We follow in-plane crack front dynamics via real-time measurements in brittle gels as micro-branching unfolds and progresses. We first show that spatially local energy balance quantitatively describes crack dynamics, even when translational invariance is badly broken. Furthermore, our results explain micro-branch dynamics; why micro-branches form along spatially localized chains and how finite-time formation of cusps along the crack front leads to their death.
pacs:
46.50.+a, 62.20.mt, 62.20.mm, 89.75.KdAlthough fracture mechanics is a mature field, many of its simplest questions remain unanswered. Cracks govern material stability. The classic 2D descriptions of fracture Freund (1990) shows that the existence of a crack focuses elastic energy stored in a strained material into a single point - the crack tip. There, stresses diverge as where is the distance from the tip and is a coefficient called the stress intensity factor. The motion of the crack is then governed by the physical demand of energy balance; that , the elastic energy flowing to the crack tip, equals the fracture energy (the energy dissipated per unit area of crack extension). For example, a sudden increase in will cause a corresponding decrease in crack velocity, since part of the elastic energy that is used to separate the crack faces is now used to compensate for the increase in fracture energy. Energy balance is the basis for the continuum description of the dynamics of simple, straight cracks in brittle materials.
Cracks, however, fracture 3D materials. Whereas a crack’s tip in 2D materials is a singular point, in 3D the leading edge of a crack forms a singular line, the crack front. In “simple” cracks, the crack front is a straight line with no overt dynamics. For this reason, 2D descriptions of fracture dynamics for simple cracks are sufficient and the classical 2D theory delineated above Freund (1990) describes crack dynamics perfectly Bouchbinder et al. (2010); Sharon and Fineberg (1999); Goldman et al. (2010), as long as they propagate along a straight-line trajectory.
Simple cracks are generically unstable entities Fineberg and Marder (1999) that leave complex 3D surfaces in their wake Hull (1999); Ronsin et al. (2014); Scheibert et al. (2010); Guerra et al. (2012). Their intrinsic 3D character calls for a study of the dynamics of crack fronts Ramanathan and Fisher (1997); Morrissey and Rice (2000); Leblond et al. (2011); Adda-Bedia et al. (2013); Pons and Karma (2010). Even when a crack is constrained to a plane, the geometry of the crack front is important. For example, the advance of quasi-static fronts in patterned materials is influenced by the long-range elastic forces that act along crack fronts Dalmas et al. (2009); Chopin et al. (2011); Patinet et al. (2013a). A recent study Xia et al. (2012) of quasi-static peeling of adhesive tape demonstrates the striking consequences of manipulating front geometry to enhance material toughness. The elasticity of crack fronts is also important to explain the fluctuating dynamics of quasi-static planar cracks propagating through random heterogeneities Santucci et al. (2010); Bonamy et al. (2008); Patinet et al. (2013b).
When cracks are rapid, experiments suggest Sharon et al. (2002) that distortions of a crack front produce inertia in the “massless” cracks described by 2D theory; an intrinsic 3D effect. The micro-branching instability of rapid simple cracks is an example where a crack front loses its symmetry dynamically. Simple cracks in brittle materials experience this instability above a critical crack velocity , where is the material’s Rayleigh wave speed Fineberg and Marder (1999); Sharon et al. (2002); Livne et al. (2005). For velocities , directed chains (“branch-lines”) of micron-scale branched cracks are spontaneously generated (see Fig. 1b). Each “micro-branch” branches away from the main crack to propagate beneath its fracture surface. Every micro-branch creates additional fracture surface and hence, increases the value of that is felt by the main crack Sharon and Fineberg (1996). As, for short times, the total energy flux to the crack front is constant, micro-branching also reduces the energy flux to the rest of the crack. A single micro-branch may effectively increase by up to 100% (if it creates an additional crack propagating parallel to the main crack). One may therefore consider micro-branches as energy sinks that are dynamically “toggled” on and off. As micro-branches are localized along the crack front, these perturbations are spatially localized in both parallel and transverse to the propagation direction. Therefore, when excited, micro-branches locally perturb initially straight crack fronts to produce large fluctuations in .
In this Letter, we study the propagation of fast crack fronts during the micro-branching instability. We will provide a detailed account of in-plane front dynamics as micro-branches nucleate, grow and eventually die. This will provide us with new insights as to how front geometry and motion continuously feed each other; eventually conspiring to cause micro-branch “death”.
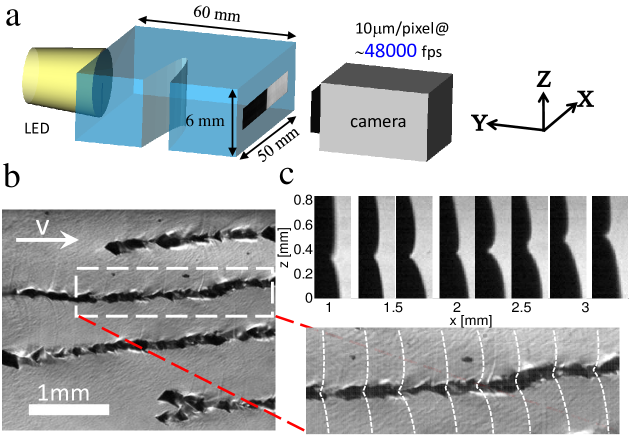
We study crack front dynamics by performing real-time visualization of the fronts as they traverse the fracture surface. We do this by using brittle polyacrylamide gels composed of a 13.8% (w/v) of acrylamide and a 1:37.5 (w/w) bisacrylamide-to-acrylamide ratio where m/s. When scaled by , these gels exhibit both the same single crack dynamics Goldman et al. (2010) and micro-branching phenomenology Livne et al. (2005) as more conventional brittle materials such as glass and PMMA. The advantage of using gels is in reducing the wave speeds, hence crack velocities, by three orders of magnitude.
Our experimental system is schematically described in Fig. 1(a). Our gel samples are cast to be rectangular blocks of dimensions , where , , and are, respectively, the propagation, loading and thickness directions. We image the crack front by shining collimated LED light through the samples in a direction normal to the XZ (fracture) plane. The strong curvature at the crack tip deflects the light at the crack front, creating a sharp shadow boundary in the image plane and producing a 2D projection of the crack front. We capture front dynamics by imaging the front using high-speed (IDT-Y4) camera at frames/sec in a “” window of located at the center section of the gel sample. Our spatial resolution was micron per pixel.
We generated crack front dynamics in the micro-branching regime by displacing the system’s boundaries by a 10-12% strain, prior to initiating fracture. Fracture was initiated by inserting a small “seed” crack at the sample’s edge, midway between its vertical boundaries. This procedure produced crack velocities of 0.1-0.5 along the mid-plane of the sample. All velocities, , referred to in this paper are the normal velocities to the front at each point .
In Fig. 1(b) we present a typical picture of the fracture surface created. Crack propagation is complex, forming micro-branches at several locations along the front. The four branch-lines appearing in the figure are oriented parallel to the mean crack velocity. To characterize the corresponding front dynamics, we focus on the formation of a single branch-line, denoted by the dashed box in Fig. 1(b). In Fig. 1(c) we present a series of snapshots of successive crack fronts within this box, together with a close up of the resulting post-mortem branch-line formed by these fronts. A direct comparison between the fronts and resulting fracture surface (Fig. 1(c), bottom) shows that a one-to-one correspondence exists between micro-branches on the fracture surface and loci of high curvature along the front.
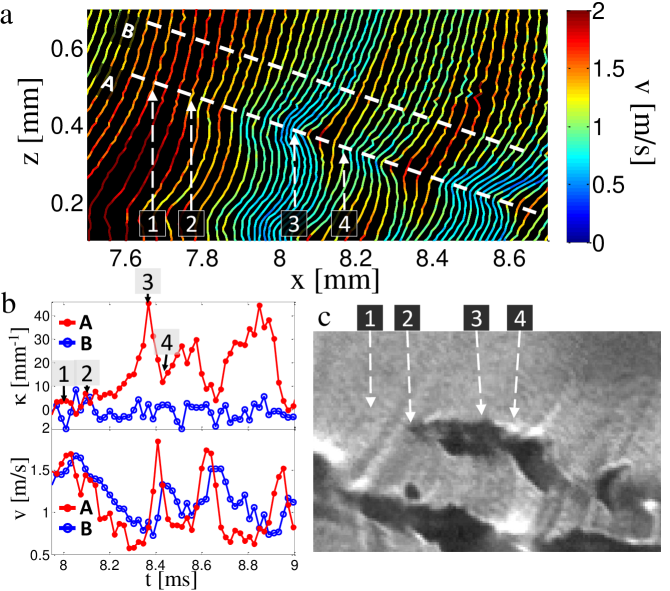
Fig. 2 presents a detailed picture of the motion within a typical section of a front that includes three well-defined micro-branching events. Along the crest of a single branch-line marked A we can see that, prior to the nucleation of the first micro-branch, (1) the front has nearly zero curvature. Then, with the nucleation of the first micro-branch (2) the local front velocity along A gradually decreases. The apparent cause for the slowing down is the effective increase in local fracture energy due to the incipient micro-branching. The resulting gradient in velocity along the front produces an increase of front curvature. The front acquires a locally concave shape which becomes more and more pronounced until (3) the curvature suddenly drops as the local velocity peaks to above the mean front velocity. Examination of the fracture surface suggests that the release of curvature and the velocity jump are coincident with the “death” of the micro-branch. Immediately afterwards (4) the velocity drops again as a new micro-branch nucleates. In contrast to the strong fluctuations along A, the “quiet” adjacent mirror-like region The fracture surfaces observed here are truly mirror-like, no parabolic markings due to void formation are in evidence() (such as those observed in [9]) marked B shows practically no change in curvature. We do, however, see significant variations in velocity which, after a delay, follow the changes in velocity along the branch-line A .
Let us consider these results. First, the association of micro-branch nucleation and death with local velocity decrease and increase along the branch-line is qualitatively consistent with local energy balance; . Our second observation is that after the front acquires curvature and the micro-branch dies, the local velocity does not only return to the mean velocity level, but doubles it. These observations suggest that front curvature must be increasing locally to produce these high velocity peaks. This idea is supported by a well-known result derived by Rice Rice (1985) for static fronts. Rice computed the static stress contribution made by a small in-plane perturbation to a straight front. When a front is perturbed in the sense that , the stress maintains the inverse-square-root singularity at each point along the front, but varies along the front as
| (1) |
where is the fracture plane, is the crack propagation direction and the unperturbed front is with a stress intensity factor . A salient feature of this integral is that it is solely determined by the front geometry. It generates a stabilizing force (“line tension”) that tends to restore the front to a flat configuration, since or . This force is countered by the local increase of the fracture energy, , generated by the micro-branch. In general, we cannot measure directly. When, however, a micro-branch “dies”, and the elastic energy stored in the front curvature locally accelerates the crack. Evidence for this is seen Fig. 2b along the A line, where we see that each peak in curvature is followed by a peak in local front velocity as the line tension is released.
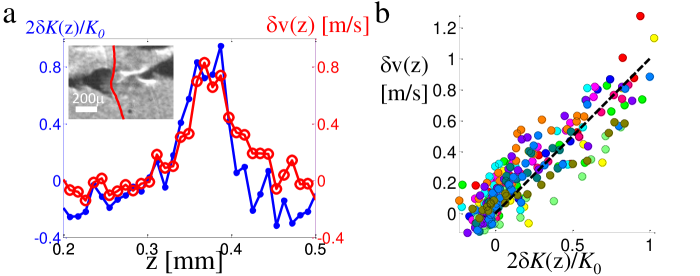
While these statements appear qualitatively accurate, are they quantitatively correct? Let us now focus on the moment of micro-branch death; the moments corresponding to the peak in local front velocity at the instant where . We consider thirteen cases, with mean crack velocities ranging between , where we identify a clear transition from a branched to smooth surface in the post-mortem image.
At these instances we can directly compare the relative velocity deviation from the mean and the built-up energy release rate computed by Eq. (1). As Eq. (1) was derived for fronts parallel to the axis, we computed over symmetric regions of the front around the point of maximum curvature by first rotating the front to make edges of this region sit on an line. The average was computed for velocity values in the same region.
The result of the comparison is presented in Fig. 3. We see that the correction for the stress intensity factor given by Eq. (1) is clearly correlated with the instantaneous velocity profile at the moment of micro-branch “death”. Despite being only a first-order correction, Eq. (1) is shown here to work quite well. This is demonstrated locally along a typical front in Fig. 3a and in another twelve similar instances in Fig. 3b. It is a manifest demonstration of how front curvature is translated into motion. We note that we see no observable effect of the proximity of neighboring branch lines in this collapse. This is consistent with the observations of Chopin (2010) in quasi-static propagation. Since we compare here a dimensionless quantity with velocity , the coefficient of proportionality must also have the dimensions of velocity. Its values are far from the characteristic wave velocity (), but close to the measured mean crack velocities . This might be related to the strong velocity dependence of the fracture energy in polyacrylamide gels Goldman et al. (2010). We give a possible origin of this coefficient in the supplementary material See supplemental material [url], which contains Ref. [29] ; T.Goldman. Unpublished measurements of fracture energy .
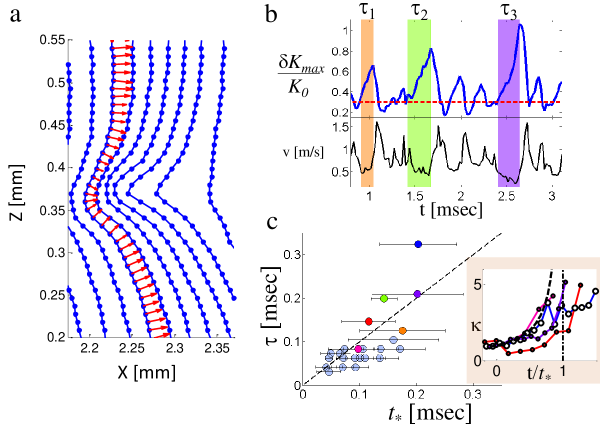
Let us now consider the front evolution depicted in Fig. 4 where the process leading to the build-up of the “line tension” prior to the death of a micro-branch is highlighted. During the buildup of the line tension, along the crest of the branch-line is approximately constant during the rapid increase in curvature that leads to cusp formation. In Fig. 4(a) we present a series of fronts leading to a release event. The release is preceded by a rapid increase in curvature which culminates when the front attains a cusp-like form. As in the events depicted in Fig. 2, local increases in immediately follow cusp formation.
It is well-known that propagating fronts may develop shocks in curvature Kardar et al. (1986), or cusps. If a cusp does form, we would expect the stress intensity factor to locally diverge according to Eq. (1). It is, therefore, likely that this high stress could promote the “death” of the micro-branch and hence trigger the local release of a front.
How can this picture be tested? A nearly constant normal velocity, , where is taken to be the initial velocity at the beginning of the event, coupled with an initially curved section of the front will spontaneously produce a cusp with no further assumptions. To see this, we rewrite in terms of front coordinates; . Differentiating by , we obtain an equation of motion for the local slope :
| (2) |
It is known that this equation develops shocks (i.e. cusps in ) in finite-time where and when is the maximal front curvature at .
The constant velocity model provides us with a prediction for the time required for the front to form a cusp . Is this timescale related to the lifetime, , of a micro-branching event? To test this, we consider an ensemble of micro-branching events. As depicted in Fig. 4(b), we define as the time between the initial stress build-up and stress release points for each event, using a threshold of to define these points. We use the initial maximal curvature, , and the normal velocity, , to evaluate the predicted cusp formation time, . (We measure by rotating the front to eliminate any mean slope and fitting the region of highest curvature with a parabola. is the average normal velocity over the same range in .) We consider only events where the estimated error in was no larger than 50%.
As shown in Fig. 4(c) this simplistic model works rather well. Within the limits of our experimental resolution ; over the stress build-up we observe rapid growth of curvature that culminates near the predicted . Moreover, our predicted indeed correspond to the death of each micro-branch.
This being said, micro-branch dynamics do not always proceed directly to curvature blow-up. In some cases the front may “slip”; undergoing partial release during an event before final cusp formation. An example of such slip is the curve denoted by open symbols in the inset of Fig. 4 (c).
In conclusion, we have presented the first experimental exploration of rapid crack front in-plane dynamics. Our observation that micro-branches act as sinks that effectively increase the fracture energy agrees qualitatively with a local energy balance. The induced front curvature may explain the micro-branch localization in as the velocity overshoots upon micro-branch release appear to generate new micro-branches, thereby forming branch-lines. Moreover, we have shown that the pronounced velocity overshoot at the moment of micro-branch “death” is well correlated with the static contribution for the stress intensity factor resulting from front curvature. This is a clear demonstration of how stresses distributed along a crack front translate locally into dynamics.
Nevertheless, the demonstrated validity of the expression (Eq. (1)) is intriguing for several reasons. First, Eq. (1) is a first-order correction in the local slope of the front, while the fronts we considered contained mild slopes. Our current data do not have the precision to investigate the effects of higher order corrections Adda-Bedia et al. (2006); Leblond et al. (2012); Vasoya et al. (2014) and it would be interesting to test their implications in the future. Secondly, Eq. (1) was derived for static fronts while we consider moving fronts. In the work of Ramanathan & Fisher Ramanathan and Fisher (1997) the static theory was expanded to include dynamic effects. These include waves that propagate on the front at velocity . Since in our experiments and because of the small size of micro-branches ( ) and relatively long life-time () we expect any signature of the waves to average during micro-branch growth. We might expect the agreement with Eq. (1) to break down at larger , when such inertial effects become important. Lastly, apart from the increase in fracture area caused by the out-of-plane motions of the front, micro-branches should also influence the local energy release rate by introducing shearing stresses. The combined effects of these contributions on dynamics demand further study.
In addition, while recent experiments Boué et al. (2015) provide a mechanism for micro-branch birth, we have seen that the front dynamics induced by this “birth” could lead to eventual micro-branch “death”; front curvature caused by micro-branch initiation may lead to micro-branch death via the large line tension generated by dynamic cusp formation. This scenario could provide a key to understanding why micro-branches remain small and do not develop. The above results are all purely 3D effects that underline the necessity of extending fracture mechanics to the third dimension.
Acknowledgements. The authors acknowledge the support of the European Research Council (Grant No. 267256) and Israel Science Foundation (Grant 76/11). We thank Baruch Meerson for helpful discussions on cusp formation in fronts.
References
- Freund (1990) L. B. Freund, Dynamic fracture mechanics (Cambridge University Press, Cambridge; New York, 1990).
- Bouchbinder et al. (2010) E. Bouchbinder, J. Fineberg, and M. Marder, Annual Review of Condensed Matter Physics 1, 371 (2010).
- Sharon and Fineberg (1999) E. Sharon and J. Fineberg, Nature 397, 333 (1999).
- Goldman et al. (2010) T. Goldman, A. Livne, and J. Fineberg, Physical Review Letters 104, 114301 (2010).
- Fineberg and Marder (1999) J. Fineberg and M. Marder, Physics Reports 313, 1 (1999).
- Hull (1999) D. Hull, Fractography: observing, measuring and interpreting fracture surface topography (Cambridge University Press, 1999).
- Ronsin et al. (2014) O. Ronsin, C. Caroli, and T. Baumberger, Europhysics Letters 105, 34001 (2014).
- Scheibert et al. (2010) J. Scheibert, C. Guerra, F. Célarié, D. Dalmas, and D. Bonamy, Physical Review Letters 104, 045501 (2010).
- Guerra et al. (2012) C. Guerra, J. Scheibert, D. Bonamy, and D. Dalmas, Proceedings of the National Academy of Sciences 109, 390 (2012).
- Ramanathan and Fisher (1997) S. Ramanathan and D. Fisher, Physical Review Letters 79, 877 (1997).
- Morrissey and Rice (2000) J. W. Morrissey and J. R. Rice, Journal of the Mechanics and Physics of Solids 48, 1229 (2000).
- Leblond et al. (2011) J.-B. Leblond, A. Karma, and V. Lazarus, Journal of the Mechanics and Physics of Solids 59, 1872 (2011).
- Adda-Bedia et al. (2013) M. Adda-Bedia, R. E. Arias, E. Bouchbinder, and E. Katzav, Physical Review Letters 110, 014302 (2013).
- Pons and Karma (2010) A. J. Pons and A. Karma, Nature 464, 85 (2010).
- Dalmas et al. (2009) D. Dalmas, E. Barthel, and D. Vandembroucq, Journal of the Mechanics and Physics of Solids 57, 446 (2009).
- Chopin et al. (2011) J. Chopin, A. Prevost, A. Boudaoud, and M. Adda-Bedia, Physical Review Letters 107, 144301 (2011).
- Patinet et al. (2013a) S. Patinet, L. Alzate, E. Barthel, D. Dalmas, D. Vandembroucq, and V. Lazarus, Journal of the Mechanics and Physics of Solids 61, 311 (2013a).
- Xia et al. (2012) S. Xia, L. Ponson, G. Ravichandran, and K. Bhattacharya, Physical Review Letters 108, 196101 (2012).
- Santucci et al. (2010) S. Santucci, M. Grob, R. Toussaint, J. Schmittbuhl, A. Hansen, and K. J. Måløy, Europhysics Letters 92, 44001 (2010).
- Bonamy et al. (2008) D. Bonamy, S. Santucci, and L. Ponson, Physical Review Letters 101, 045501 (2008).
- Patinet et al. (2013b) S. Patinet, D. Vandembroucq, and S. Roux, Physical Review Letters 110, 165507 (2013b).
- Sharon et al. (2002) E. Sharon, G. Cohen, and J. Fineberg, Physical Review Letters 88, 085503 (2002).
- Livne et al. (2005) A. Livne, G. Cohen, and J. Fineberg, Physical Review Letters 94, 224301 (2005).
- Sharon and Fineberg (1996) E. Sharon and J. Fineberg, Physical Review B 54, 7128 (1996).
- The fracture surfaces observed here are truly mirror-like, no parabolic markings due to void formation are in evidence() (such as those observed in [9]) The fracture surfaces observed here are truly mirror-like, no parabolic markings due to void formation (such as those observed in [9]) are in evidence, .
- Rice (1985) J. Rice, Journal of Applied Mechanics 52, 571 (1985).
- Chopin (2010) J. Chopin, Statique et dynamique d’un front de fissure en milieu hétérogène, Theses, Université Pierre et Marie Curie - Paris VI (2010).
- (28) See supplemental material [url], which contains Ref. [29], .
- (29) T.Goldman. Unpublished measurements of fracture energy, .
- Kardar et al. (1986) M. Kardar, G. Parisi, and Y.-C. Zhang, Physical Review Letters 56, 889 (1986).
- Adda-Bedia et al. (2006) M. Adda-Bedia, E. Katzav, and D. Vandembroucq, Physical Review E 73, 035106 (2006).
- Leblond et al. (2012) J.-B. Leblond, S. Patinet, J. Frelat, and V. Lazarus, Engineering Fracture Mechanics 90, 129 (2012).
- Vasoya et al. (2014) M. Vasoya, V. Lazarus, and L. Ponson, Procedia Materials Science 3, 2142 (2014), 20th European Conference on Fracture.
- Boué et al. (2015) T. G. Boué, G. Cohen, and J. Fineberg, Physical Review Letters 114, 054301 (2015).