Comparison of the lateral retention forces on sessile and pendant water drops on a solid surface
Abstract
We present a simple experiment that demonstrates how a water drop hanging from a Plexiglas surface (pendant drop) experiences a lateral retention force that is comparable to, and in some cases larger than, the lateral retention force on a drop resting on top of the surface (sessile drop). The experiment also affords a simple demonstration of the Coriolis effect in two dimensions.
I Introduction
When two solid surfaces are in contact and we try to set one of the surfaces in motion relative to the other, there appears a static frictional force that opposes the motion. For rough surfaces, it is found experimentally that the static frictional force increases up to a maximum value , and if the applied force is greater than this maximum value, then the surfaces will start to move relative to each other. Once the surfaces are in relative motion, there is a kinetic frictional force that opposes the motion. When the surfaces are rough, and are usually proportional to the normal force (the load).ZEMANSKY ; HRW ; PALMER1 ; PALMER2 ; PALMER3 ; MANEY ; BOWDEN ; KRIM1 ; KRIM2 ; ROBBINS
When a liquid drop is in contact with a solid surface and we try to slide the drop relative to the solid surface, there appears a lateral retention force (due to adhesion) that opposes the motion and can be thought of as the liquid-solid analog of solid-solid friction. An everyday example of such a force can be observed when water drops get stuck on the interior surface of a drinking glass. Due to surface tension, pressure, and the deformability of liquid drops, liquid-solid retention forces exhibit effects that do not appear in solid-solid friction. One such effect was presented by Tadmor et al., TADMORPRL who found experimentally that the lateral retention force on hexadecane drops is larger when the drops hang from the surface compared to when they rest on top of the surface. To demonstrate this effect, these researchers placed hexadecane drops either on top (a sessile drop) or on the bottom (a pendant drop) of a rotating platform. The platform was then rotated at an increasing angular speed until the resulting centrifugal force caused the drops to slide. Naively, in analogy with friction, one might think that a sessile drop would be more “stuck” to the surface than a pendant drop, and therefore a pendant drop would be easier to slide. However, the opposite turns out to be true: the bottom (pendant) drop is in fact harder to slide. It would seem then that the retention force on the bottom (pendant) drop is larger than the retention force on the top (sessile) drop.
While the experiment of Ref. TADMORPRL, was performed using a sophisticated (and expensive) apparatus called a centrifugal adhesion balance, the purpose of the present paper is to introduce a straightforward and inexpensive experiment that demonstrates the same effect. In this experiment, one can see with the naked eye that the force required to slide a water drop hanging from a Plexiglas sheet is comparable to, and sometimes larger than, the force required to slide a drop resting on the sheet. In addition, the differing tracks that the drops leave as they slide on the sheet also show the same result.
The counter-intuitive nature of the experiment can be better appreciated by comparison with a similar experiment performed with magnets, where the role of the adhesive force is played by the magnetic force. If we place a stack of magnets on top and on the bottom of a rotating steel bar, we would expect that the magnets on top will be more “stuck” to the bar than the ones on the bottom. This is because the normal force (and hence the frictional force) on the magnets on top are larger than on those on the bottom. Thus, the magnets on the bottom should be easier to slide than the magnets on top.
In Sec. II, we carry out the experiment with magnets and observe that the bottom magnets are always easier to slide than the top magnets. In Sec. III, we carry out the experiment using water drops and observe that the bottom drop is on average harder to slide than the top drop. In Sec. IV, we provide a qualitative description to explain the results of the experiment, and Sec. V contains our conclusions.
II The magnets
Figure 1 shows our experimental apparatus. A rotating platform is mounted on top of a motor.FN0 A variable transformer (a Variac) provides speed control for the motor that makes the platform rotate. A steel bar is attached to the rotating platform with two binder clips. A stack of three bar magnets is placed at one end of the steel bar, first on top and then on the bottom. In order to keep the platform balanced, three additional magnets are placed on the other end of the steel bar as a counterweight. These additional magnets are strong enough so that they remain fixed throughout the experiment.
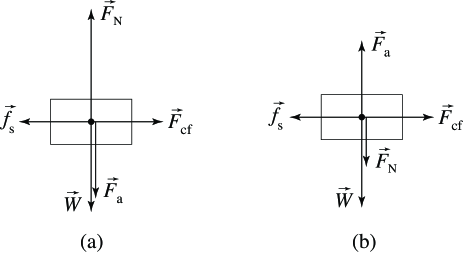
As viewed from a (non-inertial) reference frame that rotates with the platform, there are four horizontal forces acting on the magnets.CASSIDAY The first force is the centrifugal force , which increases with angular speed and is responsible for ultimately making the magnets move. The second force is the frictional force : when the magnets do not move relative to the steel bar, and once the magnets start to move. The third force is the transverse force (also known as the azimuthal or Euler force), which acts only when there is an angular acceleration. Lastly, there is the Coriolis force , which acts only when the magnets are moving relative to the steel bar. In addition, there are three forces acting on the magnets in the vertical direction: their weight , the normal force , and the magnetic attraction between the steel bar and the magnets.
In our experiment, once the magnets begin to slide on the steel bar, they quickly lose contact with the bar and fly off. Therefore, we only need to describe the forces that act on the magnets when they are at rest relative to the steel bar. In such a situation, the Coriolis force is zero. In addition, at the moment the magnets are about to slide off, the transverse force can be neglected compared to the centrifugal force (see Appendix A). Furthermore, because this is the first instant when the static frictional force is overcome, we can safely neglect the transverse force for the entire problem.
Figure 2 shows a free-body diagram of the magnets when they are at rest relative to the steel bar. In the horizontal direction, Newton’s second law yields
| (1) |
where is the mass of the magnets, is the distance from the axis of rotation to the magnet’s center-of-mass, and is the angular speed of rotation. Meanwhile, in the vertical direction we have
| (2) |
where the plus sign holds when the magnets are on top of the bar and the minus sign holds when the magnets are on the bottom. Thus, the maximum static frictional force on the magnets is given by
| (3) |
where is the coefficient of static friction. Because the static frictional force balances the centrifugal force [see Eq. (1)], we see that as the angular speed increases, the frictional force will increase until it reaches its maximum value. Denoting by the angular speed at which the centrifugal force is equal to the maximum (static) frictional force, Eqs. (1)–(3) then yield
| (4) |
As expected, this equation shows that the angular speed at which the magnets fly off is lower when the magnets are placed on the bottom than when they are placed on top. Hence, for a platform that accelerates at a constant angular acceleration, the magnets on the bottom should fly off before the magnets on top.
The magnets used in our experiments come inside a plastic case, and the coefficient of static friction between the plastic case and the steel bar was measured by tilting the steel bar with the case on top. By measuring the critical angle at which the case begins to slide, the well-known relation yields the coefficient of static friction. In our case, we measured . We also measured the magnetic attraction between the magnets and the steel bar by placing the magnets on the bottom of the steel bar and adding mass to the magnets until they lost contact with the bar. The total weight (magnets plus added mass) yielded a magnetic attraction of N.
The mass of the magnets (including the plastic case) was measured to be kg and they were placed a distance m from the axis of rotation. These values were used to calculate a theoretical critical angular speed using Eq. (4). The experimental critical angular speed was also measured using PASCO’s smart timer ME-8930. As can be seen in Table 1, there is a reasonable agreement between the theoretical and experimental values.
| Top | ||
|---|---|---|
| Bottom |
We also performed a second experiment with magnets that resembles the experiment with drops more closely. We placed two equal stacks of magnets on the top and bottom of the the steel bar at the same time. Then we turned on the motor and increased the angular speed until the magnets flew off the steel bar. In the 20 times that we performed this second experiment, the stack on the bottom flew off before the stack on top 100% of the time, as expected.
III The sliding drops
III.1 Water drops on Plexiglas
In the third part of the experiment, we replaced the steel bar with a Plexiglas sheet (see Fig. 3). We poured water into two beakers and added red and blue food coloring to the water. We then placed a red drop on one side of the Plexiglas sheet, gently flipped the sheet, and put a blue drop on the other side. Thus, when we put the Plexiglas sheet on the rotating platform, the blue drop was on top and the red drop was on the bottom. Both drops were placed the same distance from the axis of rotation, so the centrifugal force acting on them was always the same. To prevent the Plexiglas sheet from flying off the platform, it was attached with masking tape.
Similar to the magnet experiment, when the angular speed reached a critical value, the drops started to slide on the Plexiglas surface. However, contrary to what happened with the magnets, the drop on top of the Plexiglas sheet started to slide (on average) before the drop on the bottom. For 10-L drops, we found that the drop on top started to slide first in about 60% of our runs, in contrast to the magnet experiment, where the magnets on top never slid first.
When the drops slide on the Plexiglas sheet, the Coriolis force deflects their motion and the drops leave behind a trail of smaller droplets that mark their trajectories. Figure 4 shows the trajectories of the red (pendant) and blue (sessile) drops. It is clear from this figure that the sessile drop follows a trajectory that is less curved than the trajectory of the pendant drop. Thus, the Coriolis force acting on the sessile drop is smaller than the Coriolis force acting on the pendant drop. Because the Coriolis force is increasing with time, we conclude that the sessile drop started to slide earlier than the pendant drop.
As can be seen in Fig. 4, because our platform rotates clockwise, the drops in our experiment deflect to the left due to the Coriolis force. One can easily reverse the direction of rotation to produce a deflection to the right.VIDEO1 Thus, this experiment also affords a simple demonstration of the Coriolis effect.
III.2 Troubleshooting
Flipping the Plexiglas sheet to put a drop on the bottom is the most delicate step of the experiment. If the flip is done too slowly, the drop may begin sliding on the surface, and it will take a much smaller centrifugal force to get it sliding again. Hence, when you flip the sheet, it is crucial to do it quickly and to use an axis of rotation that goes through the drop, so that the drop is anchored in place.
Another delicate step in the experiment is to place the top and bottom drops at the same distance from the axis of rotation so that the centrifugal force acting on both drops is the same. Fortunately, it is straightforward to see if these steps have been carried out correctly. If the contact areas of the the drops are the same, then the bottom drop has not slid significantly, and both drops will be at the same distance from the axis of rotation.
In some runs, both drops start to slide at about the same time, and it may be difficult to visually determine which drop started to slide first. Thus, it is useful to mount a video camera on the rotating platform. For example, a cell-phone or a GoProGoPro camera (both of which are very light) can be mounted directly to the platform using tape to get a surface view of the motion of the drops. Alternatively, an elevated view can be obtained by mounting the camera on top of a piece of foam or using the small mount that comes with a GoPro camera. In our experiments, we used a GoPro Hero3 camera, which allows wireless transmission of the video so you can view the movie without having to unmount the camera. The resulting video footage VIDEO2 shows how (on average) the sessile (top) drop starts to slide first.
The size of the drops is an important factor that affects the critical angular speed at which the drops begin to slide. When two drops are placed on the same side of the Plexiglas sheet (say on top) at the same distance from the axis of rotation, the larger drop starts to slide before the smaller one. Thus, a micropipette should be used so that each drop has the same volume.
When one places a drop on the sheet, it is important that the tip of the micropipette is not touching the sheet. Otherwise, when you remove the tip it is easy to inadvertently move the drop. Conversely, the tip should not be too far from the sheet so that when the drop falls it does not splash.
Let us denote by , , and the time, angular velocity, and centrifugal force at which the bottom (pendant) drop begins sliding. Then
| (5) |
and
| (6) |
where , , , , and are, respectively, the mass of the drop, the density of the liquid, the volume of the drop, the distance from the axis of rotation, and the angular acceleration of the platform. By combining Eqs. (5) and (6), we obtain
| (7) |
with a similar equation (for ) holding for the top drop. We then find that the time difference between when the two drops begin sliding is given by
| (8) |
Equation (8) shows that in order to increase , one must decrease either the volume of the drops, the distance from the axis of rotation, or the angular acceleration (or some combination of these quantities). In our experiments, the best results were obtained with L, cm, and rad/s2. Of course, one could decrease the volume of the drops further to obtain an even larger , but it becomes difficult to visually follow the motion of such small drops so a camera would be necessary.
When we dried the Plexiglas sheet after each run, we sometimes inadvertently created static electricity. In order to prevent static electricity from building up on the sheet, we found it useful to be barefoot while drying the sheet. We also found it useful to rub the sheet on a grounded metal pole.
We have also performed these experiments with other surfaces (Lexan, glass, and PVC) and different water-based liquids (vinegar and wine). In all of these other experiments, we did not observe the effect, either because it is not present or because it is too small to be seen with our apparatus. This seems to indicate that the effect is not universal and depends on the liquid/solid combination. This would not be terribly surprising, given that the adhesive force depends on both the liquid and the solid. However, it is still an open question whether only some liquid/solid combinations exhibit this effect.
III.3 Systematics
In order to eliminate some obvious systematic effects as the source of our results, we varied the experiment in several ways. First, we flipped the Plexiglas sheet, so what was the bottom face became the top face, and vice versa. Second, we varied whether the red or blue drop was placed on the top or bottom of the sheet. Third, we placed the drops at different locations on the sheet, and used both distilled and tap water. In addition, we used six different Plexiglas surfaces to perform the experiment. Some surfaces appeared very smooth, and others appeared a bit scratched. In all the possible variations of the experiment, we observed that, with 10-L drops, the top (sessile) drop started to slide first in about 60% of the runs, whereas the bottom (pendant) drop was first in about 37% of the runs (in about 3% of the runs, both drops started to slide at about the same time). With 20-L drops, the top (sessile) drop started to slide first in about 40% of the runs, whereas the bottom (pendant) drop was first in about 47% of the runs (in about 3% of the runs, both drops started to slide at about the same time).NOTE This result is in sharp contrast with the magnet experiment, where the top magnet never slid first.
We didn’t treat the Plexiglas surfaces in any way, and therefore the roughness of such surfaces is fairly inhomogeneous, that is, some spots produce a larger retention force than others. In the ideal case that the surfaces were perfectly homogeneous, every spot would produce the same retention force, and we would obtain the same result on every run of the experiment. If we identify the average result of our experiment with the result of the ideal case, we would have that on an ideal surface, 10-L pendant drops would always slide slightly before than 10-L sessile drops, and hence the lateral retention force on 10-L pendant drops would be slightly larger than on sessile drops. For 20-L drops, we would have that the lateral retention force on pendant drops is slightly smaller than, though comparable to, such force on sessile drops.
It is a common experience that when stains are cleaned quickly, they are easier to remove than when they are left to sit for a while. The same happens to liquid drops sitting on a surface. As discussed in Ref. TADMORPRL, , the lateral force needed to move a liquid drop increases with the time that the drop sits on the surface. One may therefore wonder if the order in which the drops are placed in our experiment has any effect on the results. In order to check this, we performed several runs of the experiment where we first placed the top drop, then flipped the sheet and placed the bottom drop, and then flipped the sheet again. In this way, the top drop was in contact with the Plexiglas sheet a few seconds longer than the bottom drop. For these trials, we also observed that on average the top drop started to slide before the bottom drop.
In about 10% of the runs, we observed that the trail left by the top drop was more curved than the trail left by the bottom drop, even though the top drop started to slide first. This puzzling result has been interpreted in the following way. As the drops slide on the sheet, the rate at which they lose mass by leaving droplets behind is not exactly the same, presumably because the roughness of the Plexiglas sheet is not homogeneous. If the bottom drop loses mass at a higher rate than the top drop, the Coriolis force on the bottom drop may become smaller than the Coriolis force on the top drop, and the bottom drop may leave a trail that is less curved than the trail of the top drop, even though the top drop began sliding first.
One of the main concerns of any experimental study of drops sliding on substrates is the presence of contaminants. In our experiments, we made little effort to remove contaminants from the Plexiglas surfaces, water, or food coloring. We limited ourselves to cleaning the surfaces with ethyl alcohol and paper towels. Because possible contaminants did not seem to alter the result of the experiment, we believe that the experiment can be easily reproduced.
IV A tentative theoretical explanation
Although droplets in contact with solid surfaces have been extensively studied,DEGENNES ; ERBIL ; BORMASHENKO ; DEGENNESRMP ; BONNRMP the behavior of a droplet just before it begins to move is still not well understood. In particular, there is no accepted theory that explains why a drop hanging from a surface experiences a larger lateral retention force than a drop resting on the surface. Nevertheless, in this section we would like to present some theoretical attempts to explain such experimental results. Our presentation is approximate, and the reader is referred to the literature for more detailed explanations. In particular, we will omit thermodynamical and energy balance arguments, even though they are more fundamental than force balance arguments.PELLICER
IV.1 Drop resting on a horizontal surface: The Young equation
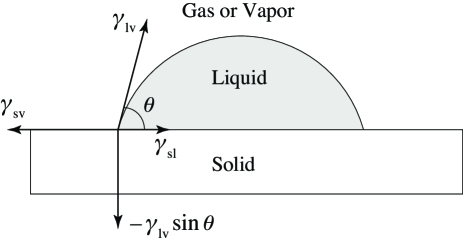
A liquid drop resting on a solid surface acquires a shape that minimizes the sum of its surface and gravitational potential energies (see Fig. 5). The contact angle is defined as the angle formed by the liquid-vapor and the liquid-solid interfaces. The line where the solid, liquid, and vapor phases co-exist is called the three-phase contact line. The three-phase contact line is also the contour line of the nominal area of contact between the liquid and the solid. When the drop is at rest, the sum of the tensions at each point of the contact line must be equal to zero. From Fig. 5, the equilibrium of surface tensions in the direction parallel to the solid-liquid interface leads to the Young equation
| (9) |
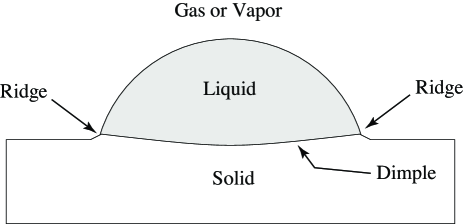
where , , and are the solid-vapor, solid-liquid, and liquid-vapor surface tensions, respectively. Figure 5 also shows that the liquid-vapor surface tension has a component that is perpendicular to the solid-liquid interface. Such a component will pull on the surface and deform it a small amount. In equilibrium, the vertical component is balanced with a downward tension of magnitude that arises from the strain on the surface of the solid. This strain causes the formation of a small ridge on the surface of the solid along the contact line (see Fig. 6). For water on Plexiglas, such a ridge is of the order of nanometers, but for softer surfaces it can be big enough to produce measurable effects.LESTER ; RUSANOV ; SHANAHAN ; PERICET ; ROMAN ; LUBARDA ; STYLE1 ; STYLE2
The Laplace equation is another important equation that describes a drop resting on a surface. The Laplace equation relates the pressures inside () and outside () the drop with the shape of the drop:
| (10) |
where and are the principal radii of curvature of the surface of the drop. The Laplace pressure (in addition to the weight of the drop) pushes down onto the surface over the contact area, creating a dimple. The combined effects of the Laplace pressure and the vertical component of the surface tension produce a crater-like deformation of the surface, as shown in Fig. 6.
IV.2 Drop resting on an incline and on a rotating platform
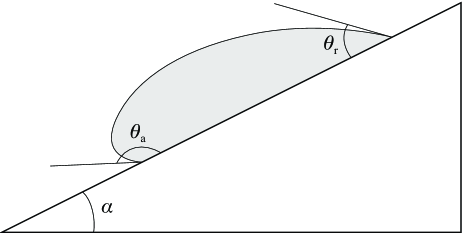
When a drop rests on an incline, the component of the drop’s weight parallel to the incline () will deform the drop (see Fig. 7), and the contact angle will change from its value on a horizontal surface. The contact angles that the leading and trailing edges of the drop make with the incline right before the drop starts to slide are called the advancing ) and receding ) contact angles.
Because the drop is not sliding down the incline, there must be a force that counterbalances the component of gravity parallel to the surface. When the drop is about to slide, the force that keeps the drop from sliding down the incline is given byFRENKEL ; FURMIDGE ; DUSSAN ; EXTRAND ; KIM ; ELSHERBINI ; GARIMELLA
| (11) |
where is the width of the drop and is a dimensionless quantity that depends on several factors, including the shape of the triple line and the shape of the drop.
Intuitively, one can understand the origin of Eq. (11) as follows. When the drop is at rest on a horizontal surface, the forces per unit length parallel to the solid surface that act on a given point of the contact line are , , and . By the Young equation (9), at every point on the contact line, the pull produced by is compensated by the pull provided by . Because the net force per unit length at each point of the contact line is zero, the contact line does not move.
We can look at the equilibrium of the contact line in a slightly different way. Let us assume that the contact line is in the shape of a circle. On each point of the contact line, we have two tensions acting on one such point, and . Let us now consider two points and on the contact line that are symmetrically placed with respect to the center of the drop. Then, by symmetry, we have that the pull on due to is exactly canceled by the pull on due to . Similarly, the pull on due to is exactly canceled by the pull on due to . Thus, when we add the pulls due to along the contact line, they add up to zero. Similarly, when we add the pulls due to along the contact line, they also add up to zero.
When we place a drop on an incline, gravity deforms the drop, and the pulls due to surface tensions do not cancel any more. Let us consider our point to be the advancing edge of the drop, and our point the receding edge. In the case of a drop on an incline, the pull due to on the advancing edge is canceled by the pull due to on the receding edge. However, the pull due to on the advancing edge is not canceled by the pull due to on the receding edge. The net pull per unit of length on the advancing and receding edges of the drop is then . If the drop is not moving, there must exist a retention force per unit length that cancels this pull. If we assume that the drop is symmetric with respect to an axis that is parallel to the direction of propagation, and if we divide the drop into an “advancing half” and a “receding half,” we can apply the above analysis to any symmetrically-placed pair of points, with in the “advancing half,” and in the “receding half.” The retention force per unit length on these symmetrically placed points is also , where now and are the contact angles at and . By assuming (a) that remains constant and equal to over the “advancing half” of the drop, (b) that remains constant and equal to over the “receding half” of the drop, and (c) that the triple contact line is a perfect circle (or another convenient but unrealistic line DUSSAN ), and by integrating the retention force per unit length over the length of the triple contact line, one arrives at an expression for the retention force given by Eq. (11), with equal to the diameter of the drop and .DUSSAN A fudge factor is then introduced in Eq. (11) to account for the fact that the triple contact line is not a perfect circle, and that the contact angle does not remain constant over the triple contact line.
When the drop is placed on top of a rotating platform, it also gets deformed by the centrifugal force. Since inertial forces are equivalent to gravitational forces, the deformation of a drop on a rotating platform is similar to its deformation on an incline. In particular, Eq. (11) is also assumed to yield the maximum lateral retention force on a drop that is placed on a rotating platform. EXTRAND
When a drop is placed on the bottom of a rotating platform, Eq. (11) is also used to calculate the retention force, although for a pendant drop the values of , , , and are in general different from those of a sessile drop.
IV.3 Two possible explanations
In Ref. TADMORPRL, , the advancing and receding contact angles of the sessile and pendant drops were measured to be , , , and . For the size of drops used in Ref. TADMORPRL, , surface tension dominates over gravity, and the shape of the drops is nearly a spherical cap. Thus, the widths of the sessile and pendant drops are very similar and, although there was no attempt to determine it, the factor in Eq. (11) can be assumed to be similar for sessile and pendant drops (because the drops are so similar in shape).PC Thus, according to Eq. (11), the retention forces for sessile and pendant drops are and . In particular, Eq. (11) yields a larger retention force for pendant drops than for sessile drops.
Although this seems like a plausible explanation, it has been argued TADMORPRL ; TADMOR1 ; TADMOR2 ; TADMOR3 that Eq. (11) needs to be replaced by a different equation. The reason is that the experimental ratio of the retention forces on sessile and pendant drops in the experiment of Ref. TADMORPRL, is
| (12) |
whereas Eq. (11), under the assumption that and are the same for sessile and pendant drops, yields a ratio of 1.14.
As mentioned above, the vertical component of the liquid-vapor tension and the Laplace pressure deform the solid surface and produce a crater-like deformation. Although such deformation is small, it has been proposed that it leads to a stronger interaction between the molecules of the liquid and the solid.TADMORPRL ; TADMOR1 ; TADMOR2 ; TADMOR3 By taking into account this stronger interaction, Eq. (11) is modified toTADMORPRL ; TADMOR1 ; TADMOR2 ; TADMOR3
| (13) |
where is an interfacial modulus that is similar to the elastic modulus of a solid but that only takes into account the deformation of the outermost layer of the solid (which is the only part of the solid in direct contact with the liquid).PC The most striking aspect of Eq. (13) is that the lateral retention force does not depend on the size or shape of the drop, whereas the lateral retention force (11) is proportional to the width of the contact area and depends on the shape of the drop.FN2 Since for the experiment of Ref. TADMORPRL, the equilibrium contact angles are and , Eq. (13) yields a ratio of 1.26 for the retention forces on sessile and pendant drops,TADMORPRL in close agreement with the experimental value of Eq. (12).
IV.4 Testing the two possible explanations
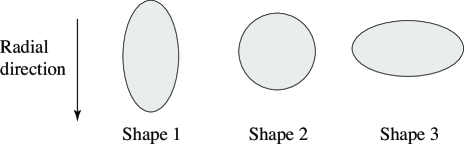
There is no consensus yet as to whether the maximum lateral retention force is given by Eq. (11), Eq. (13), or some other expression. We have tried to compare Eqs. (11) and (13) by preparing 80-L sessile drops whose contact areas have the shapes shown in Fig. 8. We found that drops of shape 1 started to slide first, whereas drops of shape 3 started to slide last.FN3 This would indicate that the correct expression for the maximum lateral retention force is given by Eq. (11), not Eq. (13). However, since for drops of shape 1 the leading edge is farther away from the center of rotation, whereas for drops of shape 3 it is closer to the center of rotation, one could argue that the drops of shape 1 will move first not because the lateral retention force is smaller but because the centrifugal force on its leading edge is larger.PC This loophole leaves open the possibility that Eq. (13) is correct.
V Conclusions
We have introduced an inexpensive and reproducible experiment demonstrating that the retention force acting on water drops hanging from a Plexiglas sheet is comparable to, and sometimes larger than, the retention force on drops sitting on the surface. The experiment consists of placing two water drops on a Plexiglas sheet, one on top and the other on the bottom, and then rotating the Plexiglas sheet with an increasing angular speed. By simple visual inspection, one can see that on average the top drop starts to slide at about the same time as, and sometimes earlier than, the bottom drop. In addition, the differing curvatures of the trails left behind by the drops also show the same result. The different curvatures of the trails are a consequence of the Coriolis effect in two dimensions, which the experiment also demonstrates.
Acknowledgements.
The authors would like to thank Dr. Rafael Tadmor and Arnab Baksi for enlightening discussions and for lending us a camera. Special thanks are due to Anthony Simental, Dr. Paul Bernazzani, Dr. Ashwini Kucknoor, and Emely Munda for providing some of the materials used in the experiment. One of the authors (RM) acknowledges financial support from Ministerio de Ciencia e Innovación of Spain under project TEC2011-24492.Appendix A The transverse force
In this appendix, we show that the transverse forceCASSIDAY
| (14) |
can be ignored in our experiments. Assuming that the angular acceleration of the platform is constant and that the object (either the magnet or the drop) is not moving, is a constant force that is perpendicular to both and . The ratio of the magnitudes of the centrifugal and transverse forces can be written as
| (15) |
where the dot denotes a time derivative. This equation is valid at all instants of time. When the object is about to slide, the angular velocity becomes the critical angular velocity of Eq. (4). Because the initial angular velocity is zero, the kinematic equations for constant angular acceleration tell us that such a critical angular velocity is given by
| (16) |
where is the angular displacement swept out by the object before it starts to slide. Substitution of Eq. (16) into Eq. (15) yields the ratio of the centrifugal to the transverse force at the instant when the object is about to slide:
| (17) |
In our experiments, the magnets had to complete at least six revolutions before they flew off, giving
| (18) |
Meanwhile, the drops had to complete at least ten revolutions before they started to slide, so that
| (19) |
Equations (18) and (19) show that at the moment when the object is about to slide, the transverse force can be safely neglected compared to the centrifugal force. Thus, the force of maximum static friction can be assumed to be equal to the value of the centrifugal force at the instant when the object is about to slide.
References
- (1) H.D. Young, and R.A. Freedman, University Physics, 12th edition, (Pearson Addison-Wesley, 2008).
- (2) D. Halladay, R. Resnick, and J. Walker, Fundamentals of Physics, 8th edition (John Wiley & Sons, 2008).
- (3) F. Palmer, “What About Friction? Part I,” Am. J. Phys. 17, 181–187 (1949).
- (4) F. Palmer, “What About Friction? Part II,” Am. J. Phys. 17, 327–335 (1949).
- (5) F. Palmer, “What About Friction? Part III,” Am. J. Phys. 17, 336–342 (1949).
- (6) C.A. Maney, “Experimental Study of Sliding Friction,” Am. J. Phys. 20, 203–210 (1952).
- (7) F.P. Bowden, and D. Tabor, The Friction and Lubrication of Solids, (Oxford University Press, Oxford, 1950).
- (8) J. Krim, “Friction at the Atomic Scale,” Sci. Am. 275, 74–80 (1996).
- (9) J. Krim, “Resource Letter: FMMLS-1: Friction at Macroscopic and Microscopic Length Scales,” Am. J. Phys. 70, 890–897 (2002).
- (10) J. Ringlein, and M.O. Robbins, “Understanding and Illustrating the Atomic Origins of Friction,” Am. J. Phys. 72, 884–891 (2004).
- (11) R. Tadmor, P. Bahadur, A. Leh, H.E. N’guessan, R. Jaini, and L. Dang, “Measurement of Lateral Adhesion Forces at the Interface between a Liquid Drop and a Substrate,” Phys. Rev. Lett. 103, 266101-1–4 (2009).
- (12) Our motor came from a fan.
- (13) G.R. Fowles, and G.L. Cassiday, Analytical Mechanics, 6th Edition, (Thomson Learning, 1999).
- (14) <https://www.youtube.com/watch?v=aAw13j6_aaA>.
- (15) GoPro produces portable high-definition cameras. More information is available at <gopro.com>.
- (16) <https://www.youtube.com/watch?v=anXvcMB4IOw>.
- (17) We also noticed that with some practice at flipping the Plexiglas sheet, the results of the experiments improved to about 70%–27%–3% for 10-L drops and 50%–47%–3% for 20-L drops.
- (18) P.G. de Gennes, F. Brochard-Wyart, and D. Quéré, Capillarity and Wetting Phenomena, (Springer, New York, 2004).
- (19) H.Y. Erbil, Surface Chemistry of Solid and Liquid Interfaces, (Wiley-Blackwell, 2006)
- (20) E.A. Bormashenko, Wetting of Real Surfaces, (Walter de Gruyter, 2013).
- (21) P.G. de Gennes, “Wetting: statics and dynamics,” Rev. Mod. Phys. 57, 827–863 (1985).
- (22) D. Bonn, J. Eggers, J. Indekeu, J. Meunier, and E. Rolley, “Wetting and spreading,” Rev. Mod. Phys. 81, 739–805 (2009).
- (23) J. Pellicer, J.A. Manzanares, and S. Mafé, “The physical description of elementary surface phenomena: Thermodynamics versus mechanics,” Am. J. Phys. 63, 542–547 (1995).
- (24) G.R. Lester, “Contact angles of liquids at deformable solid surfaces,” J. Colloid. Sci. 16, 315–326 (1961).
- (25) A.I. Rusanov, “Theory of the wetting of elastically deformed bodies, I. Deformation with a finite contact angle,” Colloid J. USSR 37, 614–622 (1975).
- (26) M. Shanahan, and P.G. de Gennes, “L’arête produite par un coin liquide près de la ligne triple de contact solide/liquide/fluide,” (“The ridge produced by a liquid near the triple line solid/liquid/fluid,”) Compt. Rend. Acad. Sci. Paris 302, 517–521 (1986).
- (27) R. Pericet-Cámara, A. Best, H.-J. Butt, and E. Bonaccurso, “Effect of capillary pressure and surface tension on the deformation of elastic surfaces by sessile liquid microdrops: An experimental investigation,” Langmuir 24, 10565–10568 (2008).
- (28) B. Roman, and J. Bico, “Elasto-capillarity: Deforming an elastic structure with a liquid droplet,” J. Phys.: Cond. Matt. 22, 493101-1–16 (2010).
- (29) V.A. Lubarda, “Mechanics of a liquid drop deposited on a solid substrate,” Soft Mat. 8, 10288–10297 (2012).
- (30) R.W. Style, R. Boltyanskiy, Y. Che, J.S. Wettlaufer, L.A. Wilen, and E.R. Dufresne, “Universal deformation of soft substrates near a contact line and the direct measurement of solid surface stresses,” Phys. Rev. Lett. 110, 066103-1–5 (2013).
- (31) R.W. Style, Y.L. Che, S.J. Park, B.M. Weon, J.H. Je, C. Hyland, G.K. German, M.P. Power, L.A. Wilen, J.S. Wettlaufer, and E.R. Dufresne, “Patterning droplets with durotaxis,” P. Natl. Acad. Sci. USA 110, 12541–12544 (2013).
- (32) Y.I. Frenkel, “On the behavior of liquid drops on a solid surface 1. The sliding of drops on an inclined surface,” J. Exp. Theo. Phys. (USSR), 18 659–668 (1948).
- (33) C.G.L. Furmidge, “Studies at phase interfaces I. The sliding of liquid drops on solid surfaces and a theory for spray retention,” J. Coll. Int. Sci. 17, 309–324 (1962).
- (34) E.B. Dussan, and R.T.-P. Chow, “On the ability of drops or bubbles to stick to non-horizontal surfaces of solids,” J. Fl. Mech. 137, 1–29 (1983).
- (35) C.W. Extrand, and A.N. Gent, “Retention of liquid drops by solid surfaces,” J. Coll. Int. Sci. 138, 431–442 (1990).
- (36) H.-Y. Kim, H.J. Lee, and B.H. Kang, “Sliding of liquid drops down an inclined solid surface,” J. Coll. Int Sci. 247, 372–380 (2002).
- (37) A.I. ElSherbini, and A.M. Jacobi, “Liquid drops on vertical and inclined surfaces I. An experimental study of drop geometry,” J. Coll. Int. Sci. 273, 556–565 (2004).
- (38) S.R. Annapragada, J.Y. Murthy, and S.V. Garimella, “Droplet retention on an incline,” Int. J. Heat Mass Trans. 55, 1457–1465 (2012).
- (39) R. Tadmor, Private Communication.
- (40) R. Tadmor, “Line energy, line tension and drop size,” Sur. Sci. 602, L108–L111 (2008).
- (41) R. Tadmor, “Approaches in wetting phenomena,” Soft Mat. 7, 1577–1580 (2011).
- (42) R. Tadmor, “Misconceptions in Wetting Phenomena,” Langmuir 29, 15474–15475 (2013).
- (43) We note that Eqs. (11) and (13) are in sharp contrast to the solid-solid frictional force, which for rough surfaces is usually proportional to the mass (and hence the volume) of the object.
- (44) The same results were obtained when we placed the drops on an incline.