Flux Bottlenecks in the Mass Superflux in Solid Helium
Abstract
Superfluid 4He atoms are injected (withdrawn) asymmetrically into (from) a chamber filled with solid 4He. Two in situ capacitance pressure gauges are located at the ends of the solid helium sample at different distances from where the superfluid meets the solid 4He. The pressure change kinetics are slower at the more distant gauge. This demonstrates the presence of a mass flux bottleneck inside the solid helium sample. The temperature dependence of the maximum flux reveals a crossover and this is discussed in the context of phase slips on quasi-1-D pathways.
pacs:
67.80.-s, 67.80.B-, 67.80.Bd, 71.10.PmThe Physics community was greatly stimulated by the possibility of supersolidity suggested by the torsional oscillator experiments of Kim and ChanKim and Chan (2004a, b); many groups reported corroborating evidence. But, with the realization that previously unexpected shear modulus behavior was present in the solidDay and Beamish (2007) the community began to question the supersolid interpretation from several perspectivesReppy (2010). More recent work has shown that these mechanical effects clearly were dominant and it is now believed that there is little, if any, evidence for a supersolid available from torsional oscillator experimentsKim and Chan (2014). In conceptually different work, studies of the flux of 4He that passes through a sample cell filled with solid helium have been carried outRay and Hallock (2008, 2009, 2010a, 2010b); Vekhov and Hallock (2012, 2014); Vekhov et al. (2014). These experiments revealed the dependence of the flux rate on the solid helium temperature, the applied chemical potential difference, , and the 3He impurity concentration. They also revealed a dramatic reduction of the flux at a 3He concentration-dependent temperature, , a universal temperature dependence above and no flux above 630 mK, etc. Some of the UMass dataVekhov and Hallock (2012, 2014) were interpreted to be consistent with one-dimensional conductivityBoninsegni et al. (2007) through the solid, a so-called Luttinger-like behaviorDel Maestro and Affleck (2010); Del Maestro et al. (2011).
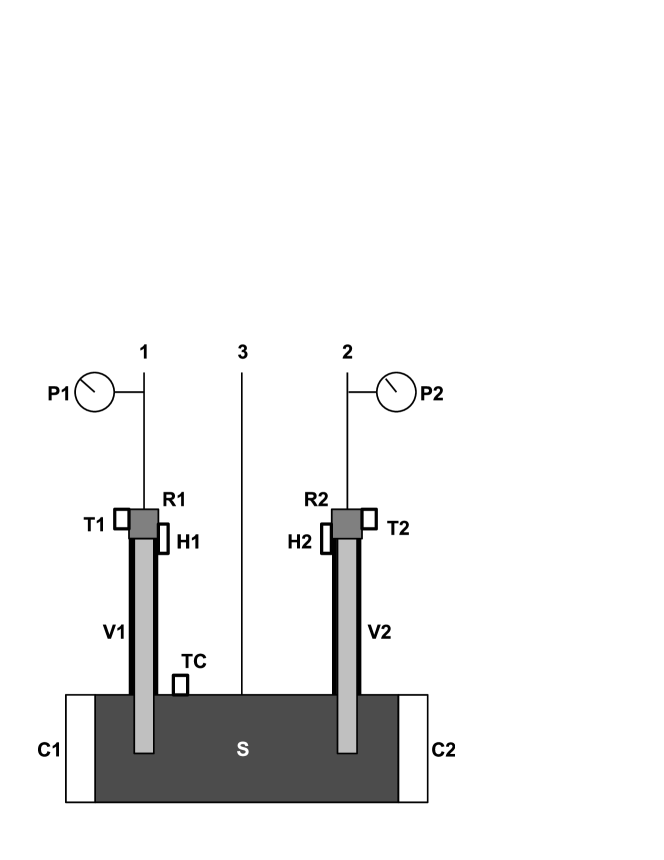
In our typical experimental arrangement, referred to as the UMass SandwichSvistunov (2006) (Fig. 1), a solid helium sample is located between two superfliud-filled Vycor electrodes, which in turn are connected to two superfluid-filled reservoirs. Recently a number of the key experimental results from the UMass group have been confirmed by Cheng et al.Cheng et al. . Instead of applying between two liquid helium reservoirs at the ends of two Vycor rods, they mechanically squeezed solid helium in one chamber and observed a pressure gauge response in another solid helium chamber which was separated from the other by superfluid-filled Vycor. Based on the data from both groups, Cheng et al. concluded that the flux rate reduction at is likely limited not by solid helium itself but by 3He condensation at the interface between solid helium and liquid helium in the Vycor. The UMass group had suggested that this flux reduction at might be due to the condensation of 3He atoms at intersections of dislocation cores or on the dislocations themselvesCorboz et al. (2008). Additional confirmation of evidence for flux through solid helium has been reported recently by Haziot et al.Haziot et al. .
Here we report work that seeks to understand where the limitation of the temperature-dependent mass flux resides for temperatures in the range above , . Is this bottleneck inside the solid helium itself or at the interface between the Vycor and solid helium? We will show evidence that the bottleneck for resides in the solid-filled cell itself and not at the interface between the superfluid in the Vycor and the solid helium.
Solid helium samples are typically grown from the nominally pure (0.17 ppm 3He impurityVekhov et al. (2014)) superfluid by filling the sample cell to near the pressure of the melting curve through a direct-access capillary and subsequently increasing the pressure above the melting curve by use of capillaries connected to the sample cell in series with Vycor rods (porous glass with interconnected pores of diameter about 7 nm) at a constant solid helium temperature, mK. The Vycor rods are 1.40 mm in diameter and 7.62 cm in length.
In our previous work we created chemical potential differences between two superfluid filled reservoirs to study the resulting flux of helium through the solid-filled cell, Fig. 1. To explore the bottleneck for a modification is made to the experimental arrangement and procedure. Using our standard sample cellRay and Hallock (2008, 2009, 2010a, 2010c); Vekhov and Hallock (2012), in this work the top of one Vycor rod, , is plugged by a high enough temperature to avoid superfluid mass flux through this rod. So, only Vycor rod can be a conduit for 4He atoms. The temperature, , of the liquid helium reservoir on the top of is kept in the rage of K while the solid helium sample (in the form of a horizontal cylinder of cm3 volume and cm length) has a temperature K and pressure bar as measured by two in situ capacitance pressure gauges, and , located at the ends of the cylindrical sample cell, 10 mm and 33 mm, respectively, from the end of in the solid. Due to the temperature difference between the solid helium and the liquid helium reservoir, , the thermo-mechanical effect causes a pressure difference between them, . The higher , the larger is the pressure difference between liquid helium in the reservoir at one end of the Vycor rod and the solid helium sample at the other.
Thus, if one wants to change and thereby inject (extract) helium atoms into (from) the solid sample, the temperature has to be decreased (increased) by some amount, . The response of and reveals the presence of pressure gradients, if any, and their time-dependent relaxation along the solid helium sample.
There are several possible bottlenecks that might restrict the flow of 4He atoms for : (a) the interface between the helium in the reservoir and the Vycor rod, (b) the Vycor rod, (c) the interface between the superfluid helium in the Vycor rod and the solid helium, (d) the conduction process in solid helium and (e) the dynamics of edge dislocations which are thought to be responsible for the density changes and pressure changes in the solid helium Ş G. Söyler et al. (2009).
As was shown in Ref. Vekhov and Hallock (2014), to avoid a bottleneck anywhere in the Vycor rod and at the interface to the superfluid reservoir the temperature typically has to be K for a low solid helium temperature, , where the highest flux rates are observed. It was also shown in Ref. Vekhov and Hallock (2014) that can slightly exceed 1.49 K if K. We can control the bottleneck due to the Vycor rod by control of . Next, growth/dissolution of edge dislocations is likely not a bottleneck in the mass flux experiments made earlier Ray and Hallock (2008, 2009, 2010a, 2010c); Vekhov and Hallock (2012, 2014); Vekhov et al. (2014) because those measurements detected the flux through solid helium samples in the presence of a variety of stable pressure gradients inside the solid samples. These various gradients had no effect on the flux. Thus, we are left here to distinguish between two possibilities, (c) and (d). If the mass flux bottleneck for is at the interface between the Vycor rod and the solid helium and not in the solid helium itself, then we might expect that no difference in the behavior of and will be observed when atoms enter or leave the solid through in response to changes in . But, if the bottleneck is in the solid helium sample itself, then we might expect that the time dependent behavior of and will be different due to the difference in the distances of these gauges from the rod.
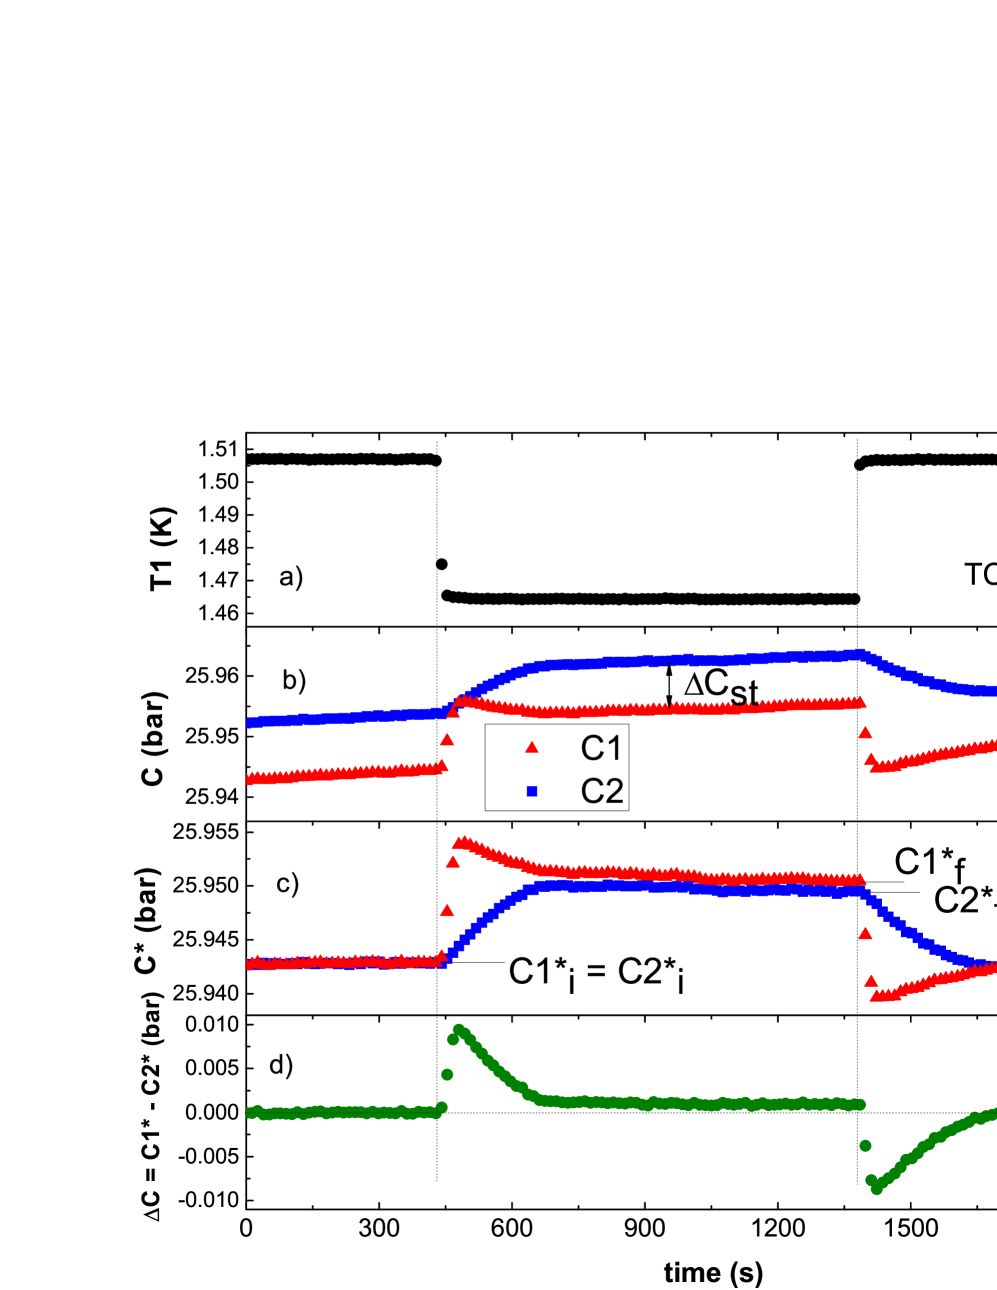
Data that illustrates the procedure of the measurements are shown in Fig. 2 for the case of a solid helium temperature, mK, midrange in the span in which flux has been previously documented. The time interval between data points is about 13 s. Fig. 2 (a) shows a flux-initiating temperature change between and K. One can see that the decrease is slower than its increase. We believe that this is due to the thermal impedance between the reservoir and the connection to our refrigeration. Increases in are prompt because of the proximity of the heater and the reservoir. The rate of decrease of slows at lower solid helium temperatures. During the measurements, the temperature change is much faster than the pressure change in solid helium and does not measurably limit the kinetics of this pressure change. Fig. 2 (b) presents the response of the in situ pressure gauges and . As known from our previous workRay and Hallock (2008, 2009) and can be seen here, and reveal the presence of a steady pressure difference, (in some samples up to 0.1 bar) in this solid helium sample. This anneals at high enough temperatures, usually above 0.7 K. There is a small pressure drift in the solid helium due to a pressure drift in the Vycor filling line which is in turn caused by a level change of liquid helium in the 4K bath of the cryostat. Fig. 2 (c) shows the same and data, but after subtraction of the pressure drift and steady pressure gradient, now denoted and , where the * designates that these subtractions have taken place. This background subtraction allows a determination of the difference in the kinetics and steady state behavior after the relaxation of the and . Next, for clarity, we introduce the subscript i to denote the value of a parameter before an initial change in the reservoir temperature, ; f represents the value of a parameter after a new equilibrium is reached.
In the steady state, there is a small difference between and (see Fig. 2 (c)) after a decrease in and mass addition to the solid. is always larger than and this difference is larger for higher temperatures.
The kinetic behaviors of and are significantly different. The pressure gauge closest to the Vycor rod, , shows a much faster response than the further, , gauge. This leads to the formation and relaxation of a kinetic pressure difference, . The kinetics above mK has non-monotonic behavior as shown in Fig. 2(c): a fast increase/decrease and then relaxation back to a new equilibrium value. The kinetics in turn has a monotonic behavior in the whole range of temperatures studied. This non-monotonic behavior is likely due to a difference between the mass flux conductivity from to and to . The flux from to is faster then from to , apparently due to the difference in distance between and the two detectors.
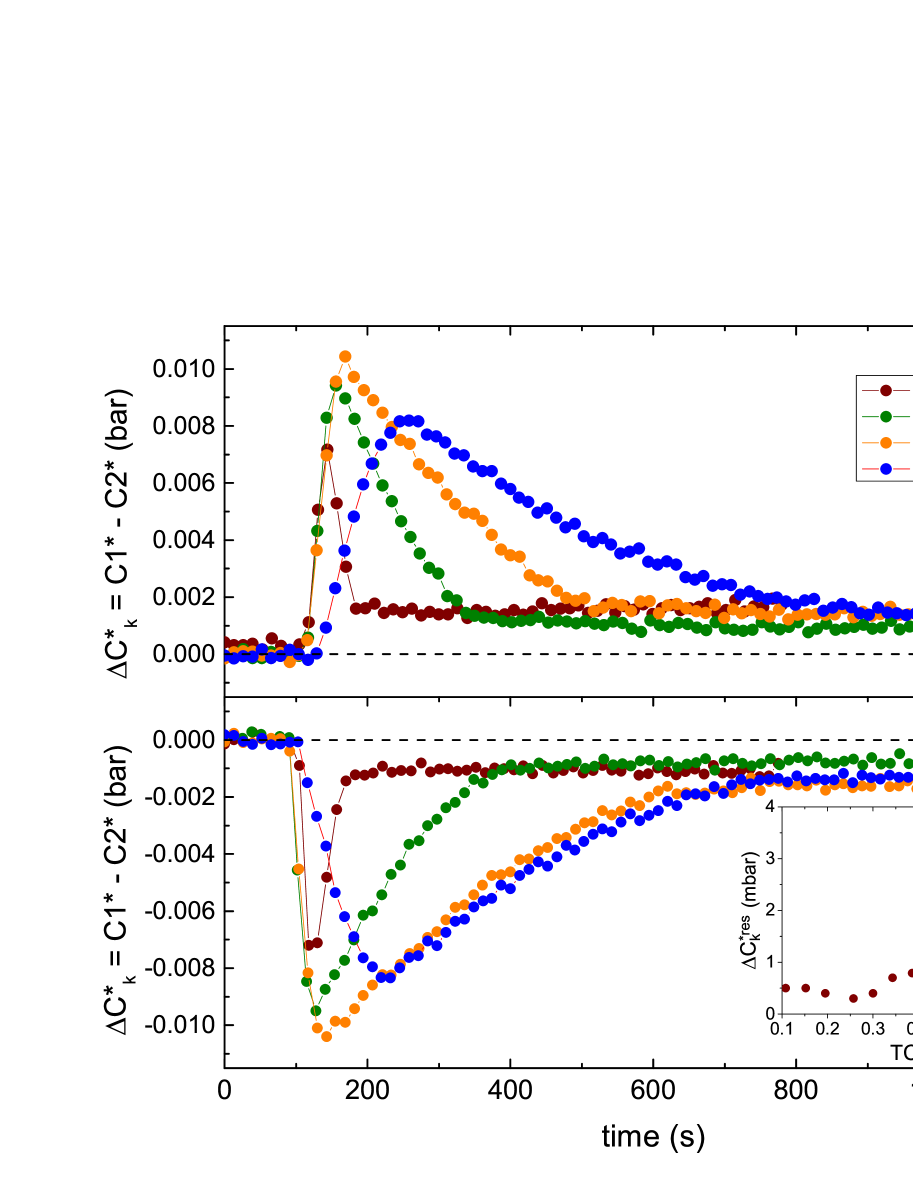
Based on data of the sort presented in Fig. 2(c), the kinetic pressure gradient is shown in Fig. 3 for several temperatures. Thus, Fig. 3(a) [(b)] shows after a temperature decrease [increase], i.e. after adding [subtracting] helium atoms through the Vycor rod. Several features can be noted here: (a) the higher the , the slower the development and its further relaxation; (b) the maximum amplitude of depends non-monotonically on ; (c) never relaxes to the initial zero-level, furthermore, the higher , the larger residual value (see Fig. 3b, insert).
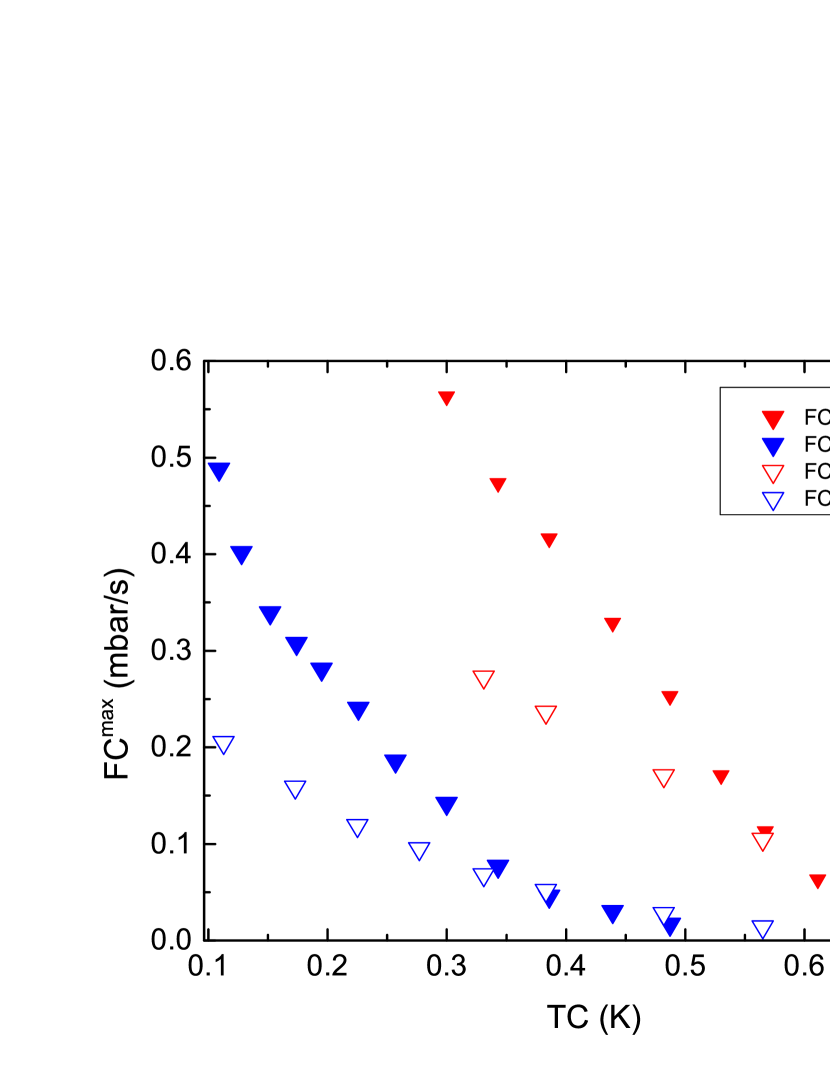
In order to determine a measure of the rate of mass flux from through the Vycor rod to both in situ pressure gauges, and , through the solid helium, the derivatives of the pressures and , , are taken by means of a three-point algorithm and their maximum values for a constant change, , are plotted in Fig. 4 for the same solid helium sample. These data are shown for the case of a increase. One can see that is several times faster than . This flux also monotonically decreases with increasing temperature, which is similar to the temperature dependence found for the mass flux through a solid helium filled cell and measured by the pressure gauges on the top of both Vycor rods in previous work Vekhov and Hallock (2012); Vekhov et al. (2014). The data here are presented for initial sample warming (solid symbols) and subsequent cooling (open symbols). Before warming, the sample had not been annealed. At the highest temperatures the sample starts to anneal resulting in a flux rate decrease seen on cooling.
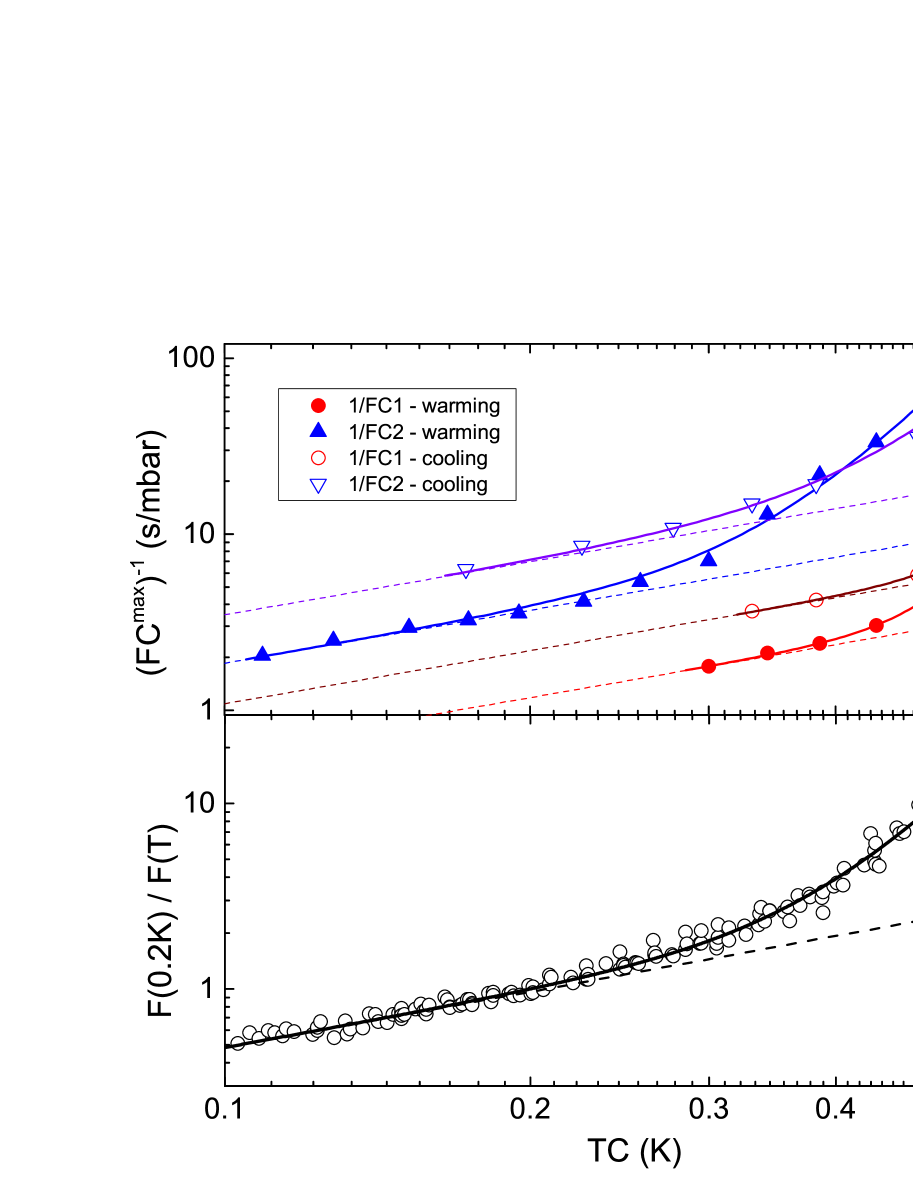
The data from Fig. 4 can be inverted, , to obtain something we might call a flux resistance as shown in Fig. 5(a). When this is done, it appears that there is a crossover in behavior from one conductance regime to another. We note here that our recent mass flux data through many solid samples of various 3He concentrations for (see Ref.Vekhov et al. (2014), Fig.4) demonstrated a universal temperature dependence for the maximum flux, , when normalized, . That same data can also be presented as a flux resistance, , as shown in Fig. 5(b). When that is done we see that it demonstrates a very similar behavior. That is, the flux measured through many samples also shows this apparent crossover behavior.
It is a question for further study to determine what the origin of the contributions to the temperature dependence of the conductance is that gives rise to this apparent crossover behavior. It is possible that quantum phase slipsArutyunov et al. (2008) are responsible, as has been seen for narrow superconducting fibersTian et al. (2005); Pai et al. (2008); Arutyunov et al. (2008).
In conclusion we have shown that measured changes in the pressure in a cell filled with solid helium when mass is injected depend on the relative location of the pressure gauges with which the measurements are made. We interpret these measurements to indicate that the bottleneck to the temperature dependent flux above the temperature is due to superflow dissipation in the solid sample itself and the flux is not limited by interface effects where superfluid in the Vycor contacts the solid helium; the bottleneck for is a bulk phenomena and not a surface effect. Our results support the possibility that the dissipative mass flux seen may be due to the superfluid cores of edge dislocations that carry the flux, but do not conclusively prove it.
We appreciate the early contributions to the apparatus by M.W. Ray and conversations with colleagues in the field, particularly B.V. Svistunov, J. Beamish and M. Chan. This work was supported by the National Science Foundation grant No. DMR 12-05217 and by Trust Funds administered by the Univ. of Mass. Amherst.
References
- Kim and Chan (2004a) E. Kim and M. Chan, Nature 427, 225 (2004a).
- Kim and Chan (2004b) E. Kim and M. Chan, Science 305, 1941 (2004b).
- Day and Beamish (2007) J. Day and J. Beamish, Nature 450, 853 (2007).
- Reppy (2010) J. D. Reppy, Phys. Rev. Lett. 104, 255301 (2010).
- Kim and Chan (2014) D. Y. Kim and M. H. W. Chan, Phys. Rev. B 90, 064503 (2014).
- Ray and Hallock (2008) M. W. Ray and R. B. Hallock, Phys. Rev. Lett. 100, 235301 (2008).
- Ray and Hallock (2009) M. W. Ray and R. B. Hallock, Phys. Rev. B 79, 224302 (2009).
- Ray and Hallock (2010a) M. W. Ray and R. B. Hallock, Phys. Rev. B 81, 214523 (2010a).
- Ray and Hallock (2010b) M. W. Ray and R. B. Hallock, Phys. Rev. Lett. 105, 145301 (2010b).
- Vekhov and Hallock (2012) Y. Vekhov and R. B. Hallock, Phys. Rev. Lett. 109, 045303 (2012).
- Vekhov and Hallock (2014) Y. Vekhov and R. B. Hallock, Phys. Rev. B 90, 134511 (2014).
- Vekhov et al. (2014) Y. Vekhov, W. J. Mullin, and R. B. Hallock, Phys. Rev. Lett. 113, 035302 (2014).
- Boninsegni et al. (2007) M. Boninsegni, A. B. Kuklov, L. Pollet, N. V. Prokof’ev, B. V. Svistunov, and M. Troyer, Phys. Rev. Lett. 99, 035301 (2007).
- Del Maestro and Affleck (2010) A. Del Maestro and I. Affleck, Phys. Rev. B 82, 060515(R) (2010).
- Del Maestro et al. (2011) A. Del Maestro, M. Boninsegni, and I. Affleck, Phys. Rev. Lett. 106, 105303 (2011).
- Svistunov (2006) B. Svistunov, “http://online.itp.ucsb.edu/online/smatter-m06/svistunov/,” (2006).
- (17) Z. Cheng, J. Beamish, A. Fefferman, F. Souris, and S. Balibar, in APS March Meeting 2015, March 2 - 6, San Antonio, Texas.
- Corboz et al. (2008) P. Corboz, L. Pollet, N. V. Prokof’ev, and M. Troyer, Phys. Rev. Lett. 101, 155302 (2008).
- (19) A. Haziot, D. Kim, and M. Chan, in APS March Meeting 2015, March 2 - 6, San Antonio, Texas.
- Ray and Hallock (2010c) M. W. Ray and R. B. Hallock, Phys. Rev. B 82, 012502 (2010c).
- Ş G. Söyler et al. (2009) Ş G. Söyler, A. B. Kuklov, L. Pollet, N. V. Prokof’ev, and B. V. Svistunov, Phys. Rev. Lett. 103, 175301 (2009).
- Arutyunov et al. (2008) K. Arutyunov, D. Golubev, and A. Zaikin, Physics Reports 464, 1 (2008).
- Tian et al. (2005) M. Tian, J. Wang, J. S. Kurtz, Y. Liu, M. H. W. Chan, T. S. Mayer, and T. E. Mallouk, Phys. Rev. B 71, 104521 (2005).
- Pai et al. (2008) G. V. Pai, E. Shimshoni, and N. Andrei, Phys. Rev. B 77, 104528 (2008).