Surveying Galaxy Proto-clusters in Emission: A Large-scale Structure at z=2.44 and the Outlook for HETDEX
Abstract
Galaxy proto-clusters at provide a direct probe of the rapid mass assembly and galaxy growth of present day massive clusters. Because of the need of precise galaxy redshifts for density mapping and the prevalence of star formation before quenching, nearly all the proto-clusters known to date were confirmed by spectroscopy of galaxies with strong emission lines. Therefore, large emission-line galaxy surveys provide an efficient way to identify proto-clusters directly. Here we report the discovery of a large-scale structure at in the HETDEX Pilot Survey. On a scale of a few tens of Mpc comoving, this structure shows a complex overdensity of Ly emitters (LAE), which coincides with broad-band selected galaxies in the COSMOS/UltraVISTA photometric and zCOSMOS spectroscopic catalogs, as well as overdensities of intergalactic gas revealed in the Ly absorption maps of Lee et al. (2014). We construct mock LAE catalogs to predict the cosmic evolution of this structure. We find that such an overdensity should have already broken away from the Hubble flow, and part of the structure will collapse to form a galaxy cluster with by . The structure contains a higher median stellar mass of broad-band selected galaxies, a boost of extended Ly nebulae, and a marginal excess of active galactic nuclei relative to the field, supporting a scenario of accelerated galaxy evolution in cluster progenitors. Based on the correlation between galaxy overdensity and the descendant halo mass calibrated in the simulation, we predict that several hundred proto-clusters with mass of will be discovered in the 8.5 Gpc3 of space surveyed by the Hobby Eberly Telescope Dark Energy Experiment.
Subject headings:
cosmology: observations – galaxies: clusters: general – galaxies: evolution – galaxies: high-redshift1. Introduction
Galaxy proto-clusters at are the “crime scene” of the rapid mass assembly and galaxy growth of present day massive clusters. During this epoch, the most massive dark matter (DM) halos in cluster progenitors are just about to cross the characteristic mass scale of (Chiang et al., 2013b; Wu et al., 2013), coinciding with the increasing dominance of various intra-cluster processes seen in fully formed clusters. The total star formation rate (SFR) of a proto-cluster is predicted to be orders of magnitude higher than that of its descendant (Behroozi et al., 2013), implying a rapid build-up of the stellar content in line with an emerging quiescent galaxy population. Efficient baryon accretion of massive galaxies via cold streams from the gaseous cosmic web might be switching to an inefficient mode due to a uniformly shock-heated medium. Such a transition is expected to take place in the largest halos first, i.e., in cluster progenitors during this epoch (Kereš et al., 2005; Dekel & Birnboim, 2006; Dekel et al., 2009b). The subsequent virialization on both galaxy and cluster scales in about a dynamical timescale largely erases the signatures of the aforementioned processes, placing a fundamental limit on inferences based on the largely archaeological record of cluster formation based upon near-field studies. Direct studies of cluster progenitors thus provide irreplaceable probes to understand the formation of present day massive clusters.
The search for high-redshift cluster progenitors is challenging due to their lack of mature cluster signatures such as extended X-ray emission (Fassbender et al., 2011), the Sunyaev–Zel’dovich effect (Bleem et al., 2015), and the prominent galaxy red sequence (Gladders & Yee, 2005; Gilbank et al., 2011). The fundamental picture of gravitational structure formation implies that the most massive collapsed objects evolved from the densest regions in the early universe on a large scale (Kravtsov & Borgani, 2012, and references therein). The finding of proto-clusters requires identifying galaxy overdensities in three-dimensions using precise redshift measurements (Chiang et al., 2013b).
Active star formation in cluster progenitors implies that (at least for the purpose of proto-cluster search and identification) more focus should be placed on star-forming galaxies instead of the quiescent ones that play a dominant role in traditional cluster studies. The difficulty in mapping the high-redshift cosmic density field is alleviated by the prevalence of emission lines in these star-forming galaxies, for which spectroscopic redshift can be obtained once the line transition is identified. Therefore, nearly all the proto-clusters known to date (see the recent compilation in Chiang et al., 2013b) were found and/or confirmed spectroscopically by overdensities of galaxies with strong emission lines, particularly Ly redshifted into the optical window (Steidel et al., 1998, 2000, 2005; Kurk et al., 2000, 2004; Pentericci et al., 2000, 2002; Venemans et al., 2002, 2004, 2005, 2007; Shimasaku et al., 2003; Palunas et al., 2004; Matsuda et al., 2005; Ouchi et al., 2005; Prescott et al., 2008; Kuiper et al., 2011; Yamada et al., 2012b; Cucciati et al., 2014; Lee et al., 2014b; Lemaux et al., 2014; Saito et al., 2015). Alternatively, H emitters are also used as density tracers (Hatch et al., 2011; Matsuda et al., 2011; Hayashi et al., 2012; Koyama et al., 2013).
Massive proto-clusters at , although having a much larger radius of influence compared with clusters in the local universe, occupy only of the cosmic volume (Chiang et al., 2013b). Their abundance, by definition, is as low as that of galaxy clusters at . An effective survey of proto-clusters thus needs to probe an extremely large volume. Traditional multi-object slit spectroscopy, although providing reliable redshifts and galaxy spectral diagnostics, is expensive as a survey tool of this scale. Narrow-band imaging (with a larger redshift uncertainty than direct spectroscopy) has been successful in finding overdensities of Ly emitters (LAE) in both blank fields (Ouchi et al., 2005) and targeted fields around powerful radio galaxies (see a summary in Venemans et al., 2007). This technique also revealed a puzzling but fascinating population of diffuse Ly halos, the so called Ly “blobs” in overdense regions (Steidel et al., 2000; Prescott et al., 2008; Matsuda et al., 2009; Yang et al., 2009; Erb et al., 2011; Matsuda et al., 2012). However, narrow-band imaging typically requires a region of interest with a known redshift; if used as a survey tool, it probes only a small volume in a thin redshift slice of .
Blind spectroscopy provides an opportunity to largely increase the survey volume. For instance, wide-field slitless grism or prism spectroscopy (e.g., the baseline redshift surveys of the future Wide Field Infrared Survey Telescope (WFIRST; Spergel et al., 2013, 2015) and the Euclid mission (Laureijs et al., 2011)) is particularly suitable for the searches of proto-clusters traced by bright emission-line galaxies. Integral field unit (IFU) spectroscopy has even greater potential, with no trade-off between spectral resolution and the survey depth due to spectral crowding and confusion (compared to grism surveys). For the same reason of source crowding, blind grism spectroscopy strongly demands space-based spatial resolution, while the IFU technique is feasible with ground-based facilities. However, early IFU techniques have focused on achieving sub-arcsecond sampling in a relatively small field of view (e.g., Eisenhauer et al., 2003; Larkin et al., 2006; Bacon et al., 2010, 2015), making them less suitable for proto-cluster searches.
The Hobby Eberly Telescope Dark Energy Experiment (HETDEX; Hill et al., 2008b) is pioneering the instrumentation development and observations of high-redshift large-scale structures using wide-field IFUs. In a 3 year baseline starting from late 2015, HETDEX will leverage the cosmic evolution of the dark energy equation of state with high-redshift () constraints imprinted by the Baryon Acoustic Oscillations (BAO; Eisenstein, 2005) in the early universe. The program will perform a redshift survey of LAEs in 300 deg2 (Spring field) plus 150 deg2 (Fall field) at (with a filling factor of 1/4.5), with a total survey volume of Gpc3. The survey uses the 10-m Hobby–Eberly Telescope (HET; Ramsey et al., 1998) with a wide-field upgrade to reach a arcmin2 field of view. Blind spectroscopy ( in 350–550 nm) with no pre-selection of targets will be performed using the Visible Integral-field Replicable Unit Spectrograph (VIRUS; Hill et al., 2012, 2014). With the LAE redshifts, HETDEX will pinpoint numerous locations of the highest density concentrations at , generating a substantially large and homogeneous sample of cluster progenitors in the key epoch of cluster formation before virialization.
As a proof of concept, the HETDEX Pilot Survey (HPS; Adams et al., 2011) performed blind spectroscopy over a 169 arcmin2 area (divided into four sub-fields) for bright LAEs at , which corresponds to a volume of Mpc3. A total of 105 LAEs were discovered and studied in detail (Adams et al., 2011; Blanc et al., 2011; Finkelstein et al., 2011; Chonis et al., 2013; Hagen et al., 2014; Song et al., 2014).
Among the LAEs discovered in HPS, there is a concentration of nine LAEs across a 71.6 arcmin2 region in the HPS-COSMOS field, which lie in a narrow redshift range at (LAE overdensity of in a comoving volume of ). Here we present a detailed characterization of this structure using HPS data, supplemented with a publicly available catalog of continuum-selected galaxies with photometric redshifts from COSMOS/UltraVISTA. We use a cosmological simulation to model the realistic connection between LAEs and the underlying matter field and the complex nonlinear gravitational structure formation across cosmic history. Our study shows that part of this structure will collapse to form a galaxy cluster with by . The structure (together with another similar overdensity partially covered by HPS) hosts several extended Ly halos, some of which are identified as active galactic nucleus (AGN) in the X-ray. These systems are commonly found in overdense regions at high redshift, perhaps indicating an accelerated co-evolution of massive galaxies and their supermassive black holes in overdense environments.
In § 2, we describe our LAEs and continuum-selected galaxy sample, and we construct a suite of mock LAE catalogs with clustering properties bracketing that of the observed LAEs. In § 3, we present the spatial distributions of galaxies in HPS-COSMOS along the line of sight and on the projected sky. In § 4, we place this structure in the context of cosmic structure formation based on the cosmological simulation connected through the mocks. In § 5, we demonstrate a significant enhancement of diffuse Ly halos and AGN in this structure. In § 6, we present the outlook for proto-cluster identification in the HETDEX survey. We discuss the results in § 7 and conclude this work in § 8. Cosmological parameters based on the 7 year Wilkinson Microwave Anisotropy Probe (Komatsu et al., 2011) are adopted: [ , , , , 0.704, 0.272, 0.728, 0.967, 0.81]. All magnitudes given are in the AB system (Oke & Gunn, 1983).
2. Galaxy Samples and Simulations
Cluster formation is directly driven by the evolution of the matter density field under gravitational processes. However, DM, being the dominant component of the matter density, has no direct electromagnetic signature. We follow the standard formalism using galaxies as (in general, biased) tracers of the underlying density field. Here we describe our HPS LAE sample and the COSMOS/UltraVISTA catalog of continuum-selected (“photo-”) galaxies. We generate mock LAEs matched in bias and stellar mass to bridge the gaps between luminous and DM, and also connect observations in a fixed lightcone to cosmological simulations that model their time evolution.
2.1. Ly Emitters: The HETDEX Pilot Survey
In this work, we use mainly the LAE sample in HPS-COSMOS, the largest contiguous HPS sub-field of 71.6 arcmin2 () near the center of the COSMOS field. The sample contains a total of 52 LAEs at , with four showing X-ray emission (matched with the catalog of Elvis et al., 2009)111In this work we do not exclude AGNs from the LAE sample since all the Ly emitting objects provide reliable redshifts to trace the underlying cosmic density field. We model the clustering properties of the full LAE population in § 2.3. This treatment is favored for future applications of the full HETDEX survey, in which no coordinated deep X-ray observations are planned to cover a significant fraction of the wide HETDEX field.. The field of HPS-COSMOS partially overlaps with several deep surveys that cover the redshift of including CANDELS (PI: Faber, Ferguson), VVDS/VUDS (PI: Le Fèvre), zCOSMOS (PI: Lilly), ZFOURGE (PI: Labbé), 3D-HST (PI: van Dokkum), and a pilot survey of CLAMATO (PI: Lee) for Ly forest tomography. We will refer to some of the findings from these surveys when relevant.
HPS (Adams et al., 2011) is a blind spectroscopic survey of emission-line galaxies using the Mitchell Spectrograph, formerly called the VIRUS-P spectrograph (the VIRUS prototype; Hill et al., 2008a) on the 2.7 m Harlan J. Smith telescope at McDonald Observatory. A single Mitchell Spectrograph pointing covers an area of with a 1/3 filling factor using an array of 246 fibers of each in diameter. With a 6-dither pattern, HPS reaches a complete coverage in the field and sub-fiber-size spatial sampling. The survey contains four sub-fields in COSMOS (71.6 arcmin2), GOODS-N (35.5 arcmin2), MUNICS (49.9 arcmin2), and XMM-LSS (12.3 arcmin2) that are rich in ancillary multi-wavelength data, with a total survey area of 169 arcmin2. The spectra cover a bandpass of 3500–5800 Å with a spectral FWHM of 5 Å ( km s-1 at 5000 Å). The survey probes LAEs at with a single line expected within the bandpass in a total effective volume of Mpc3. Each line detection is matched with a continuum counterpart or an upper limit is determined if undetected. LAEs are then distinguished from lower redshift galaxies with a single line detection (mainly unresolved [O II]3727, 3729 emitters at ) by an equivalent width (EW) criterion, where objects with a rest-frame EW Å are classified as LAEs. The contamination rate is estimated to be 4%–10%. A total of 105 LAEs are discovered in HPS down to a L limit of erg s-1 (roughly constant across the redshift range). Six of the 105 LAEs have X-ray counterparts, indicating the presence of AGNs in of the sample. Among the nine LAEs in the large-scale structure at (see § 3 and Table 1), four are covered by 3D-HST. The HPS LAE identifications for these four sources are all confirmed by at least one 3D-HST metal line detection. An additional two LAEs (and also the four covered by 3D-HST) in the structure are followed up and confirmed using Magellan/IMACS spectroscopy with a spectral resolution of 150 km s-1 FWHM, revealing unique asymmetric line profiles expected for Ly, and excluding the possibilities of being foreground [O II] emitters of 3727, 3729 doublet (Chonis et al. in prep.).
Hagen et al. (2014) estimated the stellar mass of 63 out of the total 74 LAEs in the HPS GOODS-N and COSMOS fields by spectral energy distribution (SED) fitting of individual galaxies, finding a wide distribution of spanning from to .
| HPS | aaWith an uncertainty of based on a 0.5 Å line center uncertainty. | Flux | L | Spectral | Spatial | Counter- | Counter- | EWresteeBased on an interpolation between the two nearest filters for continuum. | FluxX-ray | ||
|---|---|---|---|---|---|---|---|---|---|---|---|
| Index | () | (J2000) | (J2000) | () | () | FWHMbbAfter deconvolution with a 5 Å FWHM instrumental resolution ( km s-1). | FWHMccIncluding a tophat component of the fiber size of and the effects of dither pattern and discrete sampling. | part mR | part Prob.ddProbability of counterpart association (-band). | () | (0.5–10 keV) |
| [deg] | [deg] | [ cgs] | [ cgs] | [km s-1] | [arcsec] | [mag] | [Å] | [ cgs] | |||
| structure | |||||||||||
| 160 | 2.4346 | 150.03587 | 2.29406 | 17.1 | 8.3 | 663 | 5.2 | 27.35 | 0.61 | 1034.3 | |
| 162 | 2.4284 | 150.03637 | 2.25889 | 76.4 | 37.0 | 1063 | 8.3 | 24.45 | 0.20 | 564.3 | 370 |
| 164 | 2.4518 | 150.03729 | 2.28978 | 25.4 | 12.6 | 482 | 11.0 | 24.32 | 0.31 | 126.4 | |
| 182 | 2.4337 | 150.05137 | 2.23778 | 25.6 | 12.5 | 211 | 4.9 | 25.04 | 0.60 | 180.8 | |
| 189 | 2.4515 | 150.05462 | 2.31564 | 12.9 | 6.4 | 509 | 5.1 | 24.99 | 0.64 | 85.3 | |
| 197 | 2.4419 | 150.06121 | 2.29650 | 17.8 | 8.7 | 536 | 4.1 | 25.8 | 0.33 | 258.9 | |
| 263 | 2.4323 | 150.12108 | 2.23589 | 24.1 | 11.7 | 511 | 5.8 | 24.17 | 0.89 | 66.3 | |
| 306 | 2.4390 | 150.16504 | 2.22739 | 38.3 | 18.7 | 766 | 7.1 | 24.07 | 0.72 | 90.4 | |
| 318 | 2.4558 | 150.18387 | 2.26636 | 30.3 | 15.1 | 349 | 8.0 | 23.69 | 0.32 | 74.5 | |
| Other Extended LAEs or AGNs | |||||||||||
| 145 | 2.1751 | 150.02608 | 2.21969 | 84.0 | 31.0 | 1164 | 7.5 | 24.08 | 0.51 | 2380.9 | |
| 148 | 3.4176 | 150.02917 | 2.32439 | 8.6 | 9.5 | 289 | 4.5 | 24.77 | 0.43 | 180.5 | 166 |
| 222 | 2.9430 | 150.07600 | 2.26417 | 87.3 | 67.5 | 983 | 4.7 | 23.55 | 0.98 | 278.1 | 268 |
| 261 | 2.0960 | 150.11904 | 2.29678 | 143.7 | 48.4 | 886 | 8.3 | 23.76 | 0.87 | 536.7 | 2040 |
Adams et al. (2011) performed a curve of growth analysis to obtain robust total Ly fluxes for the HPS LAEs and estimated the spatial extent of Ly emission. As the survey uses diameter fibers with a dither pattern to achieve a discrete sampling of nearest fiber-center distances, no constraint below the scale of few arcsecond is obtained. Nonetheless, sources with an apparent spatial (including the effects of instrument, sampling, and seeing) can be ruled out as point sources with a confidence level of 222The scale of coincides with the sum of the fiber size and the average sampling separation. A source of would be detected (for each at least about half fiber area is filled) by 10–12 fibers, while a source of would be detected by only 4–6 fibers (see Figure 1 in Adams et al., 2011).. Using this criterion, there are a total of 7 (10) extended Ly halos in HPS-COSMOS (full HPS). Table 1 presents the catalog for a selected subset of LAEs of interest in the HPS-COSMOS.
2.2. Continuum-selected Photo-z Galaxies: The COSMOS/UltraVISTA
We supplement the LAEs with continuum-selected galaxies with photometric redshifts (photo-). Although their redshift uncertainty is considerably larger than that of the LAEs, these objects provide a more mass complete sample and over a wider field. We use a publicly available band selected photometric redshift galaxy catalog of Muzzin et al. (2013) in the 1.62 deg2 COSMOS/UltraVISTA survey. The catalog combines photometric datasets from UltraVISTA (McCracken et al., 2012) for near-IR, Subaru/SuprimeCam (Taniguchi et al., 2007) and CFHT/MegaCam (Capak et al., 2007) for optical. Information from the GALEX FUV and NUV (Martin et al., 2005) and IRAC+MIPS mid-IR data (Sanders et al., 2007) are included. The photo- error of galaxies at is, on average, at a level of –. Here we use the sample above the 90% completeness limit of mag, excluding a small fraction () of galaxies showing a broad and/or multi-modal redshift probability distribution. A subsample of galaxies will be referred to as the “bright” sample.
We will also use the galaxy stellar masses provided in Muzzin et al. (2013), derived by SED fitting with the FAST code (Kriek et al., 2009) using a set of population synthesis models from Bruzual & Charlot (2003). Solar metallicity, a Chabrier (2003) initial mass function (IMF), and a Calzetti et al. (2000) dust extinction law are assumed. The uncertainty in stellar mass is dex.
2.3. Bias and Mass Matched Catalogs of Mock LAE
CDM cosmological -body simulations and semi-analytic models (SAM) of galaxy formation provide a framework to model the complex hierarchical growth of DM and galaxies in three-dimensions on the relevant scales, and link the evolution of large-scale structures across cosmic time. To characterize the LAE density concentration in HPS-COSMOS at (see § 3), we generate a set of mock catalogs of LAEs at with realistic clustering properties by post-processing the SAM of Guo et al. (2013) on top of a new run of the Millennium Run (MR) cosmological DM N-body simulation (Springel et al., 2005) with the WMAP7 cosmology (Komatsu et al., 2011). The Guo et al. (2013) model improves upon the extensively tested models of De Lucia & Blaizot (2007) and Guo et al. (2011). Various galaxy properties are reasonably reproduced, and we particularly rely on its agreement with observations for galaxy clustering on large-scales in the “two-halo” regime (Guo & White, 2009; Guo et al., 2011, 2013; Kang et al., 2012; Marulli et al., 2013; Chiang et al., 2014; Kang, 2014; Pujol & Gaztañaga, 2014; Skibba et al., 2014). The galaxy stellar mass is 95% and 60% complete to and ,333The mass completeness is evaluated by comparing with the same galaxy model applied to the Millennium-II Simulation (Boylan-Kolchin et al., 2009) with a higher mass resolution. sufficient for the LAE modeling here.
We aim to match simultaneously the LAE number density, the galaxy bias, and the stellar mass distribution to the observed sample. Correlation length analyses suggest that high-redshift LAEs are less clustered compared to broad-band selected Lyman-break galaxies (of a typical limiting magnitude of ), with an overall linear bias of at (Gawiser et al., 2007; Ouchi et al., 2008; Guaita et al., 2010; Ouchi et al., 2010; Bielby et al., 2015), and 2.5–4 at (Kovač et al., 2007; Ouchi et al., 2008, 2010). Galaxy bias is known to correlate strongly with stellar mass (or color/bolometric luminosity, see Coil, 2013, and references therein) but very weakly with Ly luminosity (Orsi et al., 2008). Therefore the criterion to match the distribution in stellar mass provides constraints on not only the effective galaxy bias of the entire population but also the scatter of the bias (i.e., cosmic variance of the galaxy bias). The effect of the latter cannot be neglected in the case of localized statistics in real space, which usually suffer from having a relatively small number of objects. Conversely, the effect is less important in global statistics of correlation function and power spectrum. A full theoretical modeling of Ly radiative processes and a detailed match in Ly luminosity function and EW distribution are not required since these have negligible impact on the gravitational clustering of LAEs once the criteria in bias and stellar mass are met.
To test the effects of clustering modeling on the final interpretation of the observed structure, we generate a suite of mock catalogs with four different galaxy bias and stellar mass distributions varied continuously to bracket that estimated for the observed LAEs. For each mock catalog, we artificially elevate the SFR of SAM galaxies, such that the same observational selection criteria of Ly emission propagate to selecting model galaxies with different clustering via the positive correlation of SFR versus , the “star-forming main sequence” (e.g., Reddy et al., 2012; Rodighiero et al., 2014). This treatment acknowledges the uncertainties and bypasses the issue that at , most of the state-of-the-art cosmological simulations (both hydrodynamical and SAM, including the one used here) generate a star-forming main sequence with a normalization 0.1–0.4 dex lower than that observed (Speagle et al., 2014, and references therein), and not sufficiently “bursty” across the full range of stellar mass444The deficit of star-bursting objects in simulations across the star-forming sequence at results in a situation that only massive objects (thus high SFR) with low dust content would reach a high Ly luminosity and EW. Such a population is significantly more massive than that observed. Thus we assume that the ranks in SFR for objects with a given stellar mass are statistically realistic in the simulation, but a large fraction of objects should have a higher absolute value of SFR. We will show later that by implementing a systematic SFR offset, other major galaxy properties of interest can be self-consistently reproduced and matched with that observed. This result indicates that the discrepancy in the normalization of the star-forming sequence is the sole fundamental problem at the level relevant to this work, which needs to be resolved in future SAMs. (see discussions in Weinmann et al., 2012; Furlong et al., 2014; Genel et al., 2014; Mitchell et al., 2014; White et al., 2015).
A brief outline of our LAE modeling is as follows. We first systematically “burst” the SFR of SAM galaxies on the star-forming sequence. We then model the intrinsic Ly production by galaxy instantaneous SFR, and the effects of dust attenuation by empirical constraints, effectively generating a broad distribution in galaxy that is consistent with what is found in observations. A high degree of stochasticity (a survival probability, equivalently a Ly duty cycle; see also Nagamine et al., 2010) is then adjusted by hand to match the observed HPS LAE number density in each mock catalog. Finally, an evaluation of the two-point correlation function of the mocks is preformed, which serves as a check of the Ly modeling and of this approach as a tool to study large-scale structure. A summary of the suite of four mock LAE catalogs is given in Table 2. We describe the details of these procedures in the following.
After applying the SFR offset, we first compute, for each SAM galaxy, the intrinsic Ly luminosity generated in star-forming HII regions using the empirical calibration for H (Kennicutt, 1998) and assuming an intrinsic Ly to H ratio under Case B recombination (Brocklehurst, 1971; Osterbrock & Ferland, 2006). This gives
| (1) |
where the proportionality constant has been multiplied by a factor of 1.8 to convert from the Salpeter IMF (Salpeter, 1955) to Chabrier IMF (Chabrier, 2003) assumed in the SAM used here (both in a range of 0.1–100 M⊙).
| Simulation | aaThe offset applied to all galaxies in a given mock to compensate the systematically low and insufficiently bursty SFR of the SAM at this redshift. This offset is used as the sole control variable, which generates mocks with different bias and stellar mass. | bbGalaxy bias calculated at 8 Mpc h-1 comoving. | ccMedian and 16/84 percentiles of the stellar mass distribution. For comparison, the HPS star-forming LAEs at are estimated to have (converted to Chabrier IMF and the cosmological parameters adopted here; Hagen et al., 2014). | ddProbability for star-forming galaxies to have the maximum values of (Equation (2)), or equivalently the Ly duty cycle, tuned to match the observed LAE number density. |
|---|---|---|---|---|
| Mock I | 1.0 | 1.82 | 3% | |
| Mock II | 0.7 | 2.00 | 4% | |
| Mock III | 0.4 | 2.22 | 6% | |
| Mock IV | 0.2 | 2.44 | 9% |
Next, we implement dust attenuation of Ly photons in the host galaxies. Due to the resonant nature of the transition, Ly photons could experience long scattering path-lengths in the neutral interstellar medium (ISM) of the host galaxies. Thus a small amount of dust often produces a significant level of absorption. As a result, only several percent of the full star-forming galaxy population emit observable Ly emission (Hayes et al., 2010; Ciardullo et al., 2014). However, objects observed as LAEs show a level of dust attenuation in Ly roughly following that of the stellar continuum at 1216 Å (Finkelstein et al., 2009, 2011; Blanc et al., 2011; Nakajima et al., 2012; Hagen et al., 2014). Specifically, observed LAEs show a lower limit of Ly optical depth that roughly equals to , the optical depth of stellar continuum at 1216 Å, causing an upper limit in Ly escape fraction,
| (2) |
assuming the extinction of the stellar continuum follows the Calzetti et al. (2000) law (). On the other hand, the observational criteria (mainly EW, but also ) introduce a selection effect such that galaxies with would not be observed as LAEs. Thus we set a Ly escape fraction at the maximum values with the given dust content of a galaxy, selecting those passing the threshold of the HPS, and then drop a large fraction of galaxies according to a survival probability (independent of any galaxy properties) to match the observed LAE number density.555A detailed matching of the simulated and observed Ly luminosity function and EW distribution requires relaxing our simplistic assumption for . As long as the clustering properties of LAEs are reproduced, however, we do not perform a fine-tuning in the probability distribution of , which in principle might correlate with environment and multiple bulk and unresolved galaxy properties other than the total amount of dust. The dropped population corresponds to the large () fraction of star-forming galaxies with , thus produces no observable Ly emission.
We measure galaxy bias of the mocks by calculating the galaxy two-point correlation function and comparing it to that of the underlying DM at the same epoch. Multiple estimators (Peebles & Hauser, 1974; Hewett, 1982; Davis & Peebles, 1983; Hamilton, 1993; Landy & Szalay, 1993) are used; all give consistent results because of the large number () of LAEs per mock catalog. We Fourier transform the matter power spectrum to obtain the matter two-point correlation function, where the power spectrum is calculated using the Cosmic Linear Anisotropy Solving System (CLASS) package (Lesgourgues, 2011a; Blas et al., 2011; Lesgourgues, 2011b). The linear galaxy bias is obtained using the standard definition
| (3) |
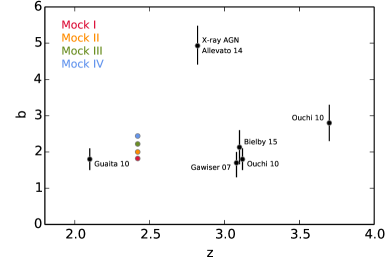
at Mpc h-1 comoving, where the and are the two-point correlation function of galaxies and matter, respectively. The galaxy bias of the set of our four mocks span a range from 1.8–2.4 (Table 2 and the top panel of Figure 1). This agrees well with that of the observed LAEs at roughly the same epoch (Gawiser et al., 2007; Ouchi et al., 2008, 2010; Guaita et al., 2010), where a small fraction of LAEs with X-ray detection have been excluded from these observational clustering analyses. X-ray AGN hosts are found to be more clustered (Allevato et al., 2011, 2014), and thus the inclusion of these objects as in this work, though subdominant, should elevate the sample averaged galaxy bias slightly.
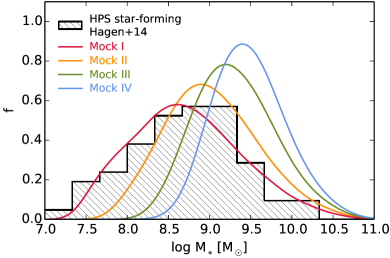
The stellar mass distributions of our mock LAE catalogs are shown in the bottom panel of Figure 1 and summarized in Table 2. The hatched histogram indicates that of the observed non-AGN sample of HPS LAEs (), showing a median and 16/84 percentile scatter of (converted to Chabrier IMF adopted here; Hagen et al., 2014). The decline at both the low and high mass ends of the observed sample are physical: the low-end tail is caused by the declining SFR, thus is the intrinsic Ly production of low mass galaxies; the high-end tail originates from an increasing dust content of high-mass star-forming galaxies. Incompleteness near the detection limit in does not propagate to bias the stellar mass distribution because of the intrinsically poor correlation between and . Our mock LAE catalogs show similar distributions with that of the observed LAEs, particularly in the low median values of log () and a similar wide spread, which is about twice large as that of the (more massive) Lyman break galaxies in the same epoch (e.g., Daddi et al., 2007). LAEs in general represent a heterogeneous population of objects with various levels of gravitational clustering, manifested in a large cosmic variance of the galaxy bias.
Using the empirical modeling of Ly production and dust attenuation, our mock LAEs successfully reproduce the observed galaxy bias and stellar mass distribution simultaneously. For both these properties, the Mock I appears to best match the observed star-forming LAEs. With a small fraction of AGN hosts included, we consider the Mock II () as the fiducial mock of the observed galaxy tracers. With this set of mocks, we will discuss the fate of the large-scale structure at in HPS-COSMOS, and its uncertainty given the uncertainty in the clustering properties of the galaxy tracers.
3. Large-scale Structure at
Here we present the large-scale galaxy concentration found at using the sample of LAEs in HPS-COSMOS supplemented by continuum-selected galaxies with photo- in COSMOS/UltraVISTA. The field of view of the HPS-COSMOS is of the same order as the characteristic angular size of proto-clusters predicted (Chiang et al., 2013b). However, the survey probes an order of magnitude longer depth along the line of sight.
3.1. Redshift Distribution
In the 71.6 arcmin2 field of view of the HPS-COSMOS (outlined in Figure 3), the redshift distributions of LAEs, photo- selected galaxies, and the stellar mass volume density of the photo- galaxies smoothed to a large super-halo scale all show a significant peak at (Figure 2).

The top panel of Figure 2 shows the line of sight distribution of 51 LAEs from to 3.6 in HPS-COSMOS. The dashed line shows the ensemble average redshift distribution derived from the whole sample of LAEs in 4 HPS fields, smoothed with a Gaussian kernel of in redshift (normalized to indicate the expected number of LAEs per redshift bin of 0.05 in the field of view of HPS-COSMOS). A concentration of nine LAEs in the bin at is clearly seen. Their mean Ly redshift is 2.441, indicated by a long thick tick. The ensemble average number density of LAEs at this redshift is . Within the redshift-space bin corresponding to a comoving volume of , the ensemble average LAE number is 1.8. The LAE galaxy overdensity,
| (4) |
is , averaged over this redshift-space bin.666The is scale dependent, thus needs to be interpreted carefully.
The density peak is unlikely to arise from a Poisson sampling of a spatially homogeneous density field, with a -value of . Although it is well known that galaxies are clustered, it suggests that the peak is a genuine large-scale structure of physical origin instead of a statistical fluctuation. The value of together with the moderately low LAE bias of suggest a matter overdensity of , implying that even at this large scale, the matter density field has already evolved to the nonlinear regime. Based on both the linear theory of spherical collapse (e.g., Peacock, 1999) and the observational signatures of cluster progenitors expected in CDM cosmological simulations (Chiang et al., 2013b), the overdensity of this structure at appears more than sufficient for it to collapse and evolve into a cluster ( ) by . In § 4 we will study the fate of the overdensity in more detail by comparing the observed LAE distribution with the mock LAE catalogs described above.
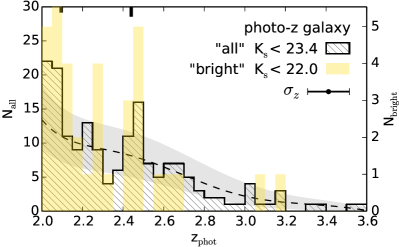
The middle panel of Figure 2 displays the photo- distribution of continuum-selected galaxies in the field of HPS-COSMOS (approximated by an square region). The “bright” galaxy sample with is shown by the yellow histogram (right -axis), and the whole sample is represented by the black hatched histogram. The typical photo- error of at is indicated in the figure legend. The dashed line and gray shaded region are the median and 16/84 percentile scatter of the number counts of galaxies as a function of redshift, calculated by randomly sampling the whole COSMOS field. Although not shown here, the median redshift distribution for the bright sample of would differ slightly, and the scatter would be larger than the gray region for galaxies due to both a larger shot noise and a higher cosmic variance (higher intrinsic clustering). Both the and galaxy number counts clearly reveal a density peak at coinciding with the highest LAE concentration in HPS. The overdensity appears to be more pronounced for bright/massive galaxies, which has been previously seen in other massive proto-clusters (Steidel et al., 2005). Chiang et al. (2014) compared the density peak traced by the identical sample of galaxies with a large set of matched SAM lightcones (post-processed with observational selection effects and redshift errors), and found that even under this level of redshift uncertainties, the overdensity in photo- galaxies suggests, with a confidence level, that this structure will evolve to a cluster with by . We will see in § 4 that the LAE distribution with precise redshifts provides consistent but much stronger constraints on the fate of the structure.
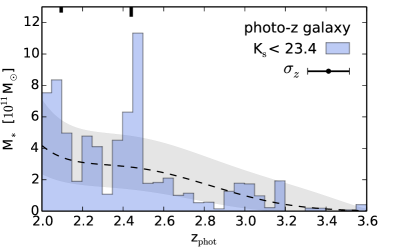
The bottom panel of Figure 2 shows, with the blue histogram, the photo- distribution of stellar mass combining all the continuum-selected galaxies () within each redshift-space bin. The dashed line and gray region show the median and 16/84 percentile scatter of this distribution estimated by randomly sampling the whole COSMOS field. Similar to the previous case of galaxy number count, photo- errors largely smooth out the fluctuation, and slightly reduce the (apparent) cosmic variance, which dominates the gray region. A peak at is, again, clearly present. A stellar mass overdensity can be defined as
| (5) |
where and are the stellar mass density calculated in a given window and the cosmic stellar mass density at the same epoch, respectively. The of the most significant bin at is , with a signal-to-noise ratio of , which is much higher than that of the number counts of the same galaxy sample shown previously. This difference is related to the fact that there is a higher fractional excess of bright galaxies in this structure as shown previously. The inclusion of faint galaxies also plays a role in reducing the noise. The scatter shown with the gray region includes not only the cosmic variance but also the shot noise of galaxy counts and the systematics in SED fitting.
3.2. Projected Spatial Distribution
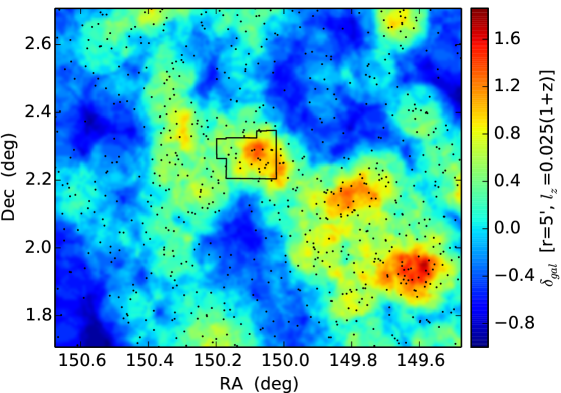
The structure can be seen in the distribution of photo- galaxies projected on the sky. The top panel of Figure 3 presents the overdensity map of continuum-selected galaxies in the central deg2 of COSMOS in a thin redshift slice centered at . Dots represent galaxies with a within a full width of . This map was generated (but not shown) in the work of Chiang et al. (2014) to search for cluster progenitors. We have smoothed the galaxy distribution with a scale of Mpc comoving that corresponds to the typical angular size of proto-clusters. Galaxy overdensity, (as defined in Equation (4)), is calculated in a cylindrical window with a radius and a redshift depth full width of . Regions of local maxima were then identified, and compared with that in a set of matched SAM galaxy lightcones. The three overdense regions shown in red are strong candidate proto-clusters of , with a confidence level of . The feature close to the field center corresponds to the HPS-COSMOS structure discussed in this work, where the HPS field is outlined in black.777The other two, at least equally prominent photo- overdensities in this map have their peak in redshift slices near but not in this slice, which correspond to candidate proto-clusters PC17 () and PC20 (), respectively, in Chiang et al. (2014). They are potentially more massive structures, but the uncertainties in mass overdensity are much larger than that of the HPS structure with LAE redshifts presented in this paper. The confirmations of these two structures require spectroscopic follow-ups. This overdensity roughly fills the whole field of HPS-COSMOS and extends few arcmins to the west. The size of this structure is on the order of 20 Mpc comoving, consistent with that of massive cluster progenitors studied in simulations (Suwa et al., 2006; Chiang et al., 2013b; Stark et al., 2014).
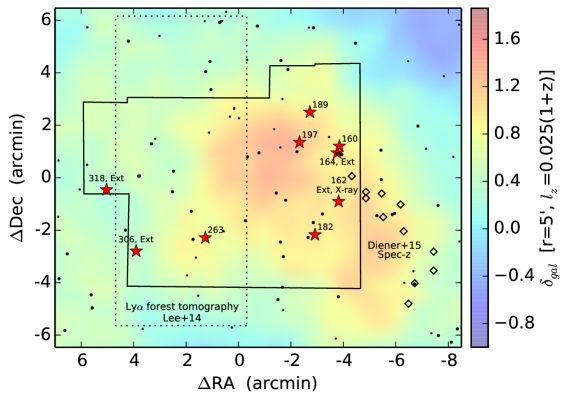
In the bottom panel of Figure 3 we expand the scale to show the HPS-COSMOS field. The background map is the same as that shown in the top panel. The nine LAEs in the redshift spike presented in § 3.1 are indicated by red stars. Dots represent continuum-selected galaxies with a photometric redshift within , and those within are marked by larger symbols.
3.3. Stellar Mass of the Continuum-selected Galaxies
Continuum-selected galaxies () inside the HPS-COSMOS field with have a median stellar mass of (among a sample of 33), which is about double of that of for galaxies outside the overdensity with the same -band limit and redshift.
3.4. Substructures
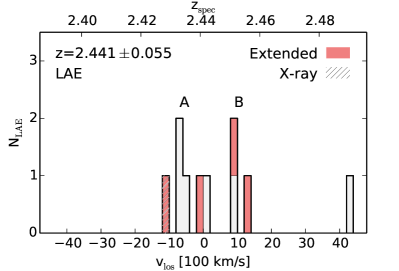
Figure 4 shows the detailed line of sight velocity distribution of HPS-COSMOS LAEs centered at (the mean redshift of the nine LAEs in the overdensity). The nine LAEs span a full range of km s-1 in , with a dispersion of 905 km s-1 (using the gapper estimator for small in Beers et al., 1990). Based on the large spatial extent of the structure on the projected sky, this high is unlikely to be dominated by peculiar velocities of a collapsed structure. There appear to be two substructures labeled A and B in Figure 4 (hereafter groups A and B, though the term “group” here does not refer to galaxies in a common parent halo). These substructures show a of 456 and 221 km s-1 for groups A and B, respectively, with a separation of km s-1 in their mean velocities. This separation corresponds to a line of sight comoving distance of Mpc, which is larger than the HPS-COSMOS field size of Mpc on the sky. Indeed, group A and B both have their members scattered across the entire HPS-COSMOS field on the projected sky.
3.5. Other Evidence of the Structure in the Literature
Using spectroscopic redshifts of continuum-selected galaxies in the zCOSMOS-deep survey, Diener et al. (2013) identified 42 “proto-groups” in COSMOS at . These systems were identified using a working definition of associations of galaxies that pass a linking length criterion,888The algorithm in Diener et al. (2013) is designed to identify groups or group progenitors, thus capturing overdensities with a scale smaller than that considered in this work for cluster progenitors. Their galaxy selection based on broad-band colors and limiting magnitudes (; ) typically excludes LAEs, which by definition, have a large excess of Ly with respect to the stellar continuum. and are expected to each assemble into a single halo by . Strikingly, the richest structure (five galaxies, ID 22 in Diener et al., 2013) found in this large volume is located immediately west of the HPS structure at the same redshift of . It also coincides with the spatial extent of photo- galaxy overdensity as shown previously in § 3.2 and Figure 3. Diener et al. (2015) spectroscopically confirmed a total of 11 galaxies (diamonds in the bottom panel of Figure 3) and gave a central redshift of 2.45. They suggest that this structure will collapse to form a massive cluster of by . With their spectroscopic campaign in a wider field, this result strongly suggests that the HPS structure is indeed large and associated with an extremely rare density concentration.
Lee et al. (2014a) presented a 3-dimensional cosmic density reconstruction in a field in COSMOS at using tomography of Ly absorption seen in the spectra of bright background galaxies. This field (dotted line in the bottom panel of Figure 3) coincides with the east half of the HPS-COSMOS field. As shown in the Figure 3 of Lee et al. (2014a), there is a strong and complex overdensity of Ly absorbing gas (the densest among the survey volume) at , coinciding with our HPS LAE overdensity at . Their figure shows another three spectroscopically-confirmed, broad-band selected LBGs (from Lilly et al., 2007; Le Fèvre et al., 2015) in this structure. This result independently supports the large-scale structure seen in HPS-COSMOS at .
| ID | aaMedian Virial mass of the most massive descendant DM halo (friends-of-friends group central) of a mock structure. | bbNumber of LAEs in each mock structure that will be merged into the same friend of friend group by . | ccAngular separation between the field center targeting a mock structure and the true center of the corresponding proto-cluster (defined to be the center of mass of its member DM halos). | ddFull size (comoving) of a mock structure of nine LAEs along the line of sight in redshift space. | eeFull size (comoving) of a mock structure of nine LAEs along the line of sight in real space. | ffLine of sight velocity dispersion of a mock structure in redshift space. | ggLine of sight velocity dispersion of a mock structure in real space (peculiar velocity only). | hhLine of sight velocity dispersion of the main substructure (criterion 2 in the text) in redshift space. | iiLine of sight velocity dispersion of the main substructure (criterion 2 in the text) in real space (peculiar velocity only). |
|---|---|---|---|---|---|---|---|---|---|
| [arcmin] | [Mpc] | [Mpc] | [km s-1] | [km s-1] | [km s-1] | [km s-1] | |||
| Mock I | |||||||||
| Mock II | |||||||||
| Mock III | |||||||||
| Mock IV |
4. Cosmic Evolution of the Structure
We now examine the fate of the HPS-COSMOS large-scale-structure at using the mock LAE catalogs constructed in § 2.3. A large number of realizations of simulated HPS-COSMOS observations are generated. First, for each simulation box (500 Mpc h-1 comoving) of the four mock LAE catalogs, we generate three projected pseudo-lightcones from the snapshot with a viewing angle along the , , and axes, respectively. Specifically, the apparent redshift of each LAE is determined by its line of sight position (for the component of the Hubble expansion) and peculiar velocity. Galaxy properties are non-evolving to focus on the comparison at . Second, we target each pseudo-lightcone with a large number of fields of that match the area of HPS-COSMOS, each probing a pencil-beam like volume. Third, regions similar to the observed overdensity are identified as mock structures. The main constraints provided by the observations are the level of LAE overdensity and their distribution along the line of sight, including the substructures described above. We define a set of criteria to identify mock structures in simulations: (1) there must be nine LAEs within a full span of 26.7 to 47.2 Mpc comoving along the line of sight, which correspond to the 2- limits of that observed for the HPS-COSMOS overdensity,999Here the number count of LAEs is considered definite, as the effects of the shot noise on the proto-cluster characterization will be captured automatically by selecting a large realizations of mock structures. The uncertainty in the full span of the structure is estimated by bootstrapping the structure centered distances of the nine observed LAEs, with an additional contribution from instrument error ( km s-1). and (2) to match the more compact substructure of group A, six out of the nine LAEs are required to be in a line of sight interval within 23.6 Mpc comoving, the 1 upper limit of that observed. These criteria select a few thousand mock structures per mock LAE catalog. A fraction of the structures represent the same underlying structures seen under different viewing angles and/or covered by different realizations of the HPS-COSMOS pointing on the sky (i.e., different field centers). Finally, we examine the relation between these high-redshift mock LAE structures and their descendant halos.
Table 3 summarizes the main properties of mock HPS structures at and their descendants at . This structure has a large line of sight extent in redshift-space of Mpc comoving. Excluding the contribution from peculiar velocities, the simulations show that its real space full size is Mpc, larger than its . This is a classic signature of the Kaiser effect (Kaiser, 1987), suggesting that the outermost shell (as in the picture of spherical collapse scenario) has already decoupled from the cosmic expansion and started to collapse in comoving space. Most of the LAEs in the structure occupy a distinct DM halo during the observed epoch; these halos have already been influenced by self-gravity as an ensemble, and will combine to form larger halos in later epochs. The most massive descendant halo of this structure is expected to have a virial mass of ( probability with ), corresponding to a massive galaxy cluster. Only LAEs in the structure will be merged onto this main halo by , and are considered to be the true members of the proto-cluster. It is less certain whether the secondary substructure, group B, can evolve to a cluster-scale halo at . Since the whole structure at has already broken away from the Hubble flow, we expect a gravitationally bound, but not entirely virialized, descendant structure at (with a size of several physical Mpc) containing a massive cluster.
Although the structure is most likely to be a genuine proto-cluster with , there is a chance that the most massive descendant halo will have a smaller virial mass of – . In this case the structure would be considered as a massive proto-group (e.g., Diener et al., 2013). Such a slightly lower mass overdensity is often associated with cosmic web filaments, which have been studied in more details at lower redshifts (Sobral et al., 2013; Darvish et al., 2014; Hayashi et al., 2014; Sobral et al., 2015).
The inferences of the mass overdensity and virial mass would stay the same if we exclude X-ray detected LAEs and trace the structure using star-forming LAEs only. In this case the overdensity consists of eight LAEs instead of nine, while a lower biased mock galaxy population (Mock I with ) would be considered as fiducial to interpret the observation, resulting in a nearly identical level of inferred mass overdensity. We caution that our results would be biased if the Ly escape fraction were to depend strongly on large-scale environment. However, a strong environment effect would result in a galaxy two-point correlation function that significantly departs from the power-law form measured for typical star-forming galaxies and DM halos in simulations on relevant scales. Such a departure is not seen for observed LAEs (Gawiser et al., 2007; Kovač et al., 2007; Ouchi et al., 2008, 2010; Guaita et al., 2010; Bielby et al., 2015).
5. Extended Ly halos and AGNs
In the top panel of Figure 2 and in Figure 4, we label the extended Ly sources in red. As described in § 2.1, these systems are robustly ruled out to be point sources, with diameters of several tens of physical kpc (see the the Ly surface brightness profiles of the most extended sources in Adams et al. (2011)). Strikingly, an enhancement of extended LAEs in large-scale overdensities is present. Five out of six extended LAEs in HPS-COSMOS are in large-scale overdense regions: four in our HPS-COSMOS structure at and another one in a structure discovered in the ZFOURGE survey (Spitler et al., 2012; Yuan et al., 2014) with three LAEs detected in HPS-COSMOS (see the Appendix). The tendency for extended LAEs to be in overdense regions is highly significant against random fluctuations with a -value of . Within the structure, four out of the total nine LAEs are extended. These four extended LAEs are distributed in both group A and group B (Figure 4), making this environment—Ly blobs correlation prominent at a scale at least equal or larger than a cluster progenitor, as we have shown that the descendants of the whole structure will still be collapsing around a massive virialized cluster. Also, HPS-261 (see Table 4 in the appendix), the extended LAE associated with the ZFOURGE structure, is Mpc (physical) away from the well-confirmed density peaks of the proto-cluster (Yuan et al., 2014). Therefore, the properties of circumgalactic-scale Ly emission appear to be directly or indirectly connected to the elevated DM and baryon density on a super-halo scale.
Four LAEs are detected in X-ray (hatched regions in the top panel of Figure 2 and Figure 4). Their X-ray luminosity ( erg s-1), being times larger than their observed Ly luminosity, implies that AGN photoionization likely dominates the intrinsic Ly production in these systems. Two out of the four AGNs are in known large-scale overdensities: one in the z=2.10 structure (see the Appendix) and one in the z=2.44 structure. This result gives a moderately low -value of 0.2 against the null hypothesis that AGNs are a random subset of the bulk LAE population drawn from an uniform probability distribution.
Two out of the total six extended Ly sources in HPS-COSMOS are associated with X-ray detected AGNs. The scenario that extended Ly halos tend to host AGNs is significant against random fluctuation, with a -value of 0.06. Furthermore, these AGN powered Ly halos are all in overdense regions, implying possible causations behind the correlation of environment, AGNs, and the size of Ly emission.
6. Proto-clusters in the HETDEX Survey
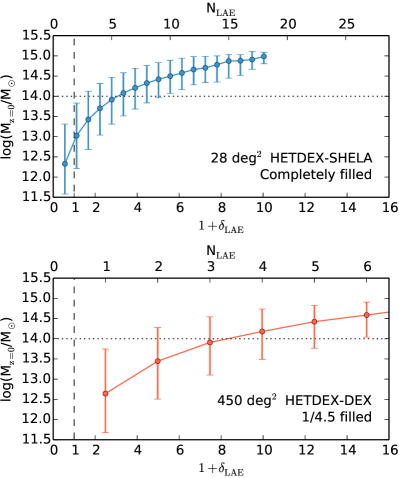
Using the HET and VIRUS, the coming HETDEX survey will perform blind spectroscopy of order a million LAEs at , allowing construction of cosmic density maps for galaxy environmental studies and select a large and homogeneous sample of cluster progenitors. To precisely measure the matter power spectrum at the peak scale of BAO for dark energy science, the main survey (300 deg2 Spring field plus 150 deg2 Fall field, hereafter, HETDEX-DEX) will sample the large area sparsely (Chiang et al., 2013a), with a spatial filling factor (the fraction of sky area covered by IFU fibers). This would impact, unfortunately, the performance of localized studies in real space through increasing shot noise. However, in a deg2 area within the Fall field overlapping with the -HETDEX Exploratory Large Area (SHELA; PI: Papovich) survey and other ancillary photometry (hereafter HETDEX-SHELA); complete coverage (unity filling factor) will be achieved by multiple dithering. Here we examine the performance of proto-cluster identification expected in HETDEX-DEX and HETDEX-SHELA with a counts in cell algorithm applied to our mock LAE catalogs. This analysis essentially uses the correlation between high-redshift local LAE overdensity and the descendant halo mass under the inclusion of observational effects and realistic noise. Implicitly, the input cosmology, gravitational structure formation, and galaxy formation model in the simulation together are used as the prior of the analysis. The difference in the survey filling factor of our two baseline fields here allows us to demonstrate the effects of a generic noise source in density mapping—the shot noise that arises from a discrete and finite sampling of the underlying parent distribution.
Under the wavelength-dependent line sensitivity of HETDEX and assuming a Ly luminosity function of Gronwall et al. (2007) for LAEs with no redshift evolution between , the expected comoving number density of HETDEX LAEs is nearly flat at Mpc-3 at , twice that as in HPS, and decreases to Mpc-3 at . For HETDEX-DEX (1/4.5 filled) and HETDEX-SHELA (completely filled), we generate a mock LAE catalog at , based on the LAE modeling described in § 2.3. These two catalogs have the same clustering properties as the Mock II used for characterizing the HPS structure.101010The slightly deeper Ly luminosity limit of HETDEX compared with that of HPS is expected to have only a limited effect on the bias of LAEs (Orsi et al., 2008). They have different ensemble average LAE number densities, . We implement this feature by tuning for each mock the survival probability described in § 2.3 to account for the uncertain stochasticity of Ly escape, plus, for the case of the HETDEX-DEX, the incompleteness due to a sub-unity survey filling factor.
We then perform a counts in cell analysis of LAE overdensity in the mocks and examine its dependency on the descendant halo mass. A redshift-space cylindrical window of Mpc h-1 comoving and Mpc h-1 comoving (including peculiar velocity) is used to calculate local LAE number and overdensity . This window is ideal for the observed density contrast at between proto-clusters of and field, while a more sophisticated optimization can be performed by varying the window with redshift, targeting , and the filling factor. Thus the performance of proto-cluster identification presented below should be viewed as a lower limit.
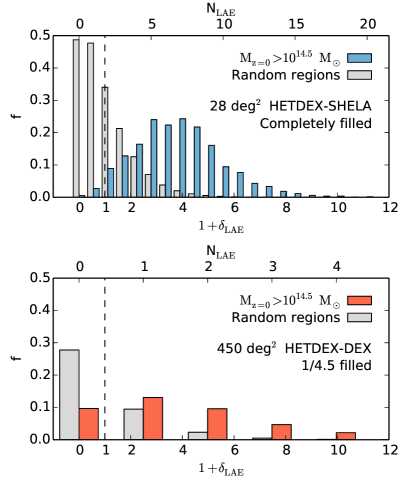
The left panels of Figure 5 show, at , the expected probability distribution of globally (gray histograms) and that of the regions centered on proto-clusters with (color histograms) in the simulation. The upper and bottom panels show the expected results for the HETDEX-SHELA and HETDEX-DEX surveys, respectively. These distributions represent a same intrinsic correlation between large-scale mass budget and their collapsed mass modulated by different levels of shot noise, which fractionally scales with roughly the inverse square root of the true population mean number per window (characterized approximately by a Poisson process). In the case of HETDEX-SHELA, proto-clusters show a significantly higher compared to the ensemble, where a threshold in can be used to separate proto-cluster regions from field. In the case of the HETDEX-DEX, only proto-clusters with the highest can be separated, thus producing a much lower completeness.
Since non-proto-cluster regions occupy the bulk of cosmic volume and can appear dense due to sampling noise and the intrinsic scatter (usually subdominant), it needs to be quantified how well the can be recovered given a measured . We show this correlation for each HETDEX baseline field in the right panels of Figure 5. is the virial mass of the most massive descendant halo (friends-of-friends group central) of the LAEs within a window for measuring . The dots and errorbars indicate, respectively, the median and 16/84 percentile scatter of the at a given . For HETDEX-SHELA, the – correlation is fairly tight. The scatter in shrinks from dex at to dex at , showing that the most massive proto-clusters, while being rare, can be identified robustly in HETDEX-SHELA. On the other hand, the larger shot noise (horizontal scatter in nature) in HETDEX-DEX not only extends the range of possible (also shown in the left panels) but also increases the scatter of this correlation. The median - correlation in HETDEX-DEX lies everywhere below that in HETDEX-SHELA. This result is due to the upward scatter from intrinsically less dense regions, which outweighs the downward scatter because of the much higher abundance of the former, thus the estimated for a genuine dense structure is biased low when the noise is finite. If the structure shows other evidence of overdensity like in the case of the HPS structure at , a deeper Ly observational program is likely to increase the best estimated , and asymptotically approach the true value when having a large .
For proto-clusters and a required purity of 70%, 80%, 90%, the completeness in HETDEX-SHELA is , 30%, 15%, respectively; in the case of HETDEX-DEX, the completeness decreases to 5%, 1%, and nearly 0%, respectively, as the lower scatter in the bottom-right panel of Figure 5 never reaches much above . These estimates represent the minimum performance. An ideal strategy for the case of the wide HETDEX-DEX would be focusing on finding the largest and rarest proto-clusters, where an even larger window can be beneficial since these structures remain overdense on a large scale. A large window is also preferred for a statistical reason—the shot noise, which roughly scales with the volume of the window to the 3/2 power, can be reduced. Unfortunately in this case the accuracy of the positional centering and the handle of substructure remain poor. Additional investigations of these densest structures in HETDEX-DEX are needed to calculate their exact overdensity, and would supplement a massive sample to that found in HETDEX-SHELA.
Conservatively, we expect to obtain a sample (¿90% confidence) of a few tens of proto-clusters and a few hundreds of in HETDEX-SHELA at ; and another hundred proto-clusters in HETDEX-DEX.
7. Discussion
Here we focus our discussion on proto-cluster identification quantified in terms of , the comparison between the HPS structure and other known high-redshift overdensities in the literature, and the dependency of galaxy properties on large-scale environment.
In § 4, we identified regions that match the HPS structure in the four mock LAE catalogs (§ 2.3) of different clustering within the uncertainty of that observed. These four mocks essentially yield the same prediction on the descendant cluster mass of . A key reason for this result is that the abundance of clusters, quantified by the halo mass function, posts a strong prior in determining the fate of the observed high- overdensity (especially in the massive end). A higher LAE overdensity than that of the HPS structure would not increase the inferred substantially; instead, it might pose challenges to the concordance cosmology (in particular, and ) as the probability of finding such a density peak will be extremely low. For Mock I to IV, only 3% to 9% of the HPS-COSMOS realizations (of the same survey volume) have a region that meets the mock structure criteria. Therefore our discovery of this dense structure is perhaps a great coincidence. However, the cluster interpretation is consistent with the “proto-group” study in the zCOSMOS-deep survey (Diener et al., 2013) that no larger structure is found as traced by their spectroscopic sample in the field several times larger than that of the HPS-COSMOS. Our results also imply that an LAE bias of much lower than 2 (thus a higher inferred mass density) would produce a conflict with the concordance cosmology. Similar problems would be raised if the clustering of LAEs was not modeled (see § 2.3) to have a realistically large cosmic variance as constrained by their wide stellar mass distribution.
In § 3.1, we showed that the HPS structure has a higher signal-to-noise ratio in stellar mass overdensity than in galaxy number counts using the same set of continuum-selected galaxies with photo-. In § 3.3, we demonstrated that the stellar mass of galaxies in the overdensity is about twice that outside the overdensity. These results suggest that the onset of star formation in this structure occurred at significantly earlier epochs, supporting the picture of the “cosmic downsizing.” The result agrees quantitatively well with that found in a proto-cluster in the quasar HS1700+643 field at (Steidel et al., 2005), and is consistent with the high formation redshifts inferred from stellar population synthesis of the low-redshift cluster red sequence (e.g., Rettura et al., 2010). It remains to be tested, with a future large sample of proto-clusters, whether the stellar mass excess is generic for high-redshift overdensities.
The cumulative star formation (stellar mass) in a region is a direct consequence of the past accretion and cooling of baryons triggered by the gravitational field of the total matter enclosed, whereas the density contrast in terms of pure number counts in a dense region can be reduced by galaxy mergers as structure/galaxy formation progresses. Therefore it is expected that the stellar mass density field traces the underlying matter density field more tightly. We suggest that in the case of photometric surveys with or without subsequent spectroscopy (where stellar mass can be better measured than in emission-line galaxy surveys), an analysis of stellar mass density contrast should ideally replace galaxy number counts as a standard technique to (1) define galaxy environment and identify possible environmental effects, (2) recover the underlying matter field, and (3) identify proto-clusters and predict their . For most photometric surveys, the resources required for measuring stellar mass do not exceed that for measuring photometric redshift to a sufficient accuracy. Thus a boost of performance for the aforementioned applications can be expected, at no extra cost.
The HPS structure does not have a significantly high level of total instantaneous SFR estimated by SED fitting of the continuum-selected galaxies. This result is in line with the general understanding that galaxy star formation is considerably bursty and could be triggered by sporadic and instantaneous accretion of cold streams from the cosmic web (Dekel et al., 2009b) or violent disk instabilities (Dekel et al., 2009a; Overzier et al., 2009). Therefore a measure of the large-scale SFR density field would be quite noisy compared to that of the stellar mass.
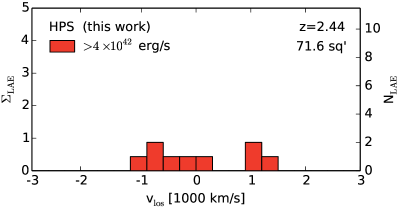
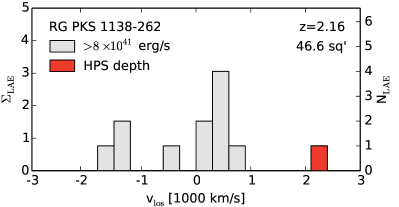
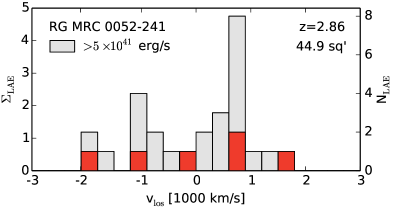
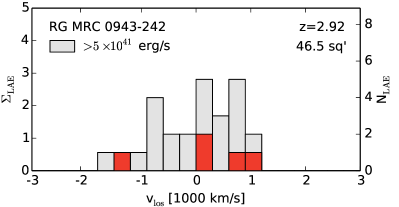
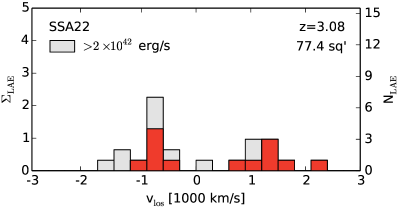
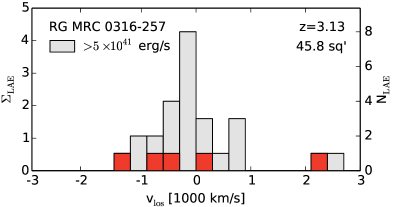
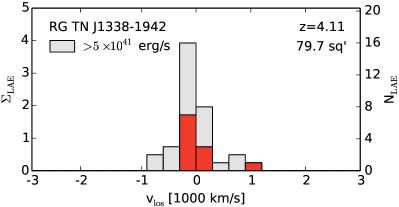
We compare the HPS structure studied in this work with other proto-clusters in the literature. Figure 6 shows the line of sight velocity distribution of LAEs in the HPS structure (same with Figure 4), five previously known LAE overdensities around powerful radio galaxies (Kurk et al., 2000, 2004; Pentericci et al., 2000; Venemans et al., 2002, 2005, 2007), and the structure in the SSA22 field at (Steidel et al., 1998, 2000; Hayashino et al., 2004; Matsuda et al., 2005; Yamada et al., 2012a). These comparison structures were observed with deep narrow-band imaging at the wavelength of Ly of the radio galaxies or, in the case of SSA22, of a serendipitously discovered overdensity in a redshift survey of continuum-selected galaxies. A slightly more relaxed EWLyα criterion of Å (compared to the Å used in HPS) was adopted in the LAE selection in the radio galaxy fields, while a stricter criterion of EW Å was used in the case of SSA22. These narrow-band selected LAEs were then investigated by slit spectroscopy, revealing a redshift-space concentration of a few tens of LAEs for each (gray histograms). Similar to the HPS structure, the structures around radio galaxies are expected to each evolve to a galaxy cluster of several times 1014 by based on the level of LAE overdensity observed; the overdensity of the continuum-selected LBGs in the SSA22 field suggests a slightly higher cluster mass of , (see summaries and discussion in Steidel et al., 1998; Venemans et al., 2007; Chiang et al., 2013b). The detection limit in terms of the Ly luminosity for the HPS structure is relatively shallow compared to these comparison proto-cluster fields. Taking this limiting luminosity into account, the HPS structure shows a LAE excess that is comparable to all the comparison structures (except for PKS 1138-262, which lacks very bright LAEs). In fact, the comoving number density of LAEs in the HPS structure is higher than that of all the radio galaxy structures, and similar to that of the SSA22 structure if observed down to the same HPS depth (red histograms).111111To compare observations with different field of view and at different redshifts, we normalize the histograms to the same scale of surface number density in an arbitrary unit of inverse comoving area (left -axis). Thus a large population of faint LAEs might exist for the HPS structure, requiring deeper observations to confirm. Similarly, the ZFOURGE proto-cluster (see the Appendix) might also hosts a population of faint LAEs yet to be observed. The HPS and radio galaxy structures, all having a similar end point in terms of cluster mass, can provide a rough evolutionary picture of early cluster kinematics across cosmic time. In general, the line of sight velocity dispersion of proto-clusters increases from km s-1 for TN J1338-1942 at to km s-1 for the three structures at (PKS 1138-262, MRC 0052-241, and MRC 0943-242). However, this latter velocity dispersion might be too large for the structures to collapse entirely by (see § 4), and perhaps by coincidence, these three overdensities around radio galaxies all show a bimodal velocity structure. Conversely, the three higher redshift radio galaxy structures (MRC 0943-242, MRC 0316-257, and TN J1338-1942) show a more clear central concentration in velocity space. The perhaps slightly more massive proto-cluster at in the SSA22 field shows a double-peak profile of LAE line of sight velocity distribution, with a combined dispersion of km s-1. Such a velocity distribution suggests, again, that the large structure in the SSA22 field is unlikely to collapse entirely by . A massive descendant cluster of connected with dense filaments, or a pair of slightly lower mass clusters are expected at . In conclusion, this comparison demonstrates that proto-clusters, though they can be characterized with to first order, show a wide variety of topology in the phase-space mass distribution. A larger sample of proto-clusters with different mass and topology at different redshifts is needed for detailed investigations.
In § 5 we demonstrated that there is a boost of extended LAEs and a marginal excess of AGNs in large-scale overdensities. Under the scenario of resonant scattering of Ly in the circumgalactic medium (CGM), the production of Ly photons and the phase-space distribution of the CGM around galaxies together determine the spatial profile of Ly emission (Laursen & Sommer-Larsen, 2007; Laursen et al., 2009a, b; Zheng et al., 2011; Dijkstra & Kramer, 2012; Verhamme et al., 2012). We speculate that the super-halo scale galaxy environment might be connected to the excess of extended Ly halos through (1) triggering AGNs (thus elevating the production of Ly photons) for luminous LAEs and (2) altering the CGM profile and/or inflow/outflow structures of all galaxies in general. These speculations are supported by the correlations of extended LAEs and environment in our HPS data, and also various reports in the literature.
First, the excess of AGNs in high-redshift large-scale overdensities is found in other systems (Pentericci et al., 2002; Lehmer et al., 2009; Martini et al., 2013), possibly triggered by efficient gas accretion and subsequent funneling induced by frequent galaxy interactions. Second, nearly all the luminous Ly blobs ( erg s-1) show signatures of obscured quasars (Overzier et al., 2013), and many of them are located in dense environments. Third, while extremely deep narrow-band imaging suggests that halos of scattered Ly are a generic feature of typical high-redshift star-forming galaxies (Steidel et al., 2011; Momose et al., 2014), the scale lengths of the Ly radial profile are small in the field (Feldmeier et al., 2013) and significantly elevated as super-halo scale galaxy densities increase (Matsuda et al., 2012). The Matsuda et al. (2012) comparison was done while controlling for the UV magnitude, which traces the ionizing photons generated by young stars. This correlation thus needs to be explained beyond the amount of intrinsic Ly production, possibly through a correlation between environment and the phase-space distribution of CGM.
The density gradient of the CGM of galaxies in dense environments might be flattened, as the baryons follow the two-halo term clustering of DM halos at this scale (Zheng et al., 2011). Furthermore, the CGM dynamics and inflow/outflow structures might be affected, manifested in a shorter fallback time scale of the galactic wind launched by galaxies in dense environments (Oppenheimer & Davé, 2008; Davé et al., 2011). This effect is expected to be more prominent for low-mass galaxies, where the local gravitational potential is not deep enough to govern entirely the galaxies’ baryonic cycle. It remains to be explored how efficient this mechanism can be on the scales exceeding a single DM halo, and how CGM dynamics is connected to the resonant scattering and escape of Ly. In the 28 deg2 HETDEX-SHELA survey, where a complete coverage will be achieved by dithering, Ly blobs extended significantly beyond a fiber ( diameter, physical kpc at , 1/3 of that of HPS) can be identified. The correlation between diffuse Ly halos and galaxy environment thus can be quantified with high quality statistics.
In § 6 we presented the expected performance of proto-cluster identification in HETDEX. As shown in § 3 and § 4, the nine LAEs in HPS provide a much more stringent constraint on the of the structure than that of the continuum-selected galaxies with photo- derived from bands in COSMOS/UltraVISTA. Although the technique of stellar mass overdensity enhances the signal of the underlying matter density field, the photo- errors of continuum-selected galaxies significantly increase the noise level (see Figure 13 in Chiang et al., 2013b). The key advantage of emission-line galaxy surveys in proto-cluster searches is the ability to measure precise galaxy redshifts efficiently, thus reducing the effects of line of sight projection. However, broad-band imaging with a wide range of wavelength coverage is still crucial for galaxy population studies. The 28 deg2 HETDEX-SHELA field will be extremely valuable on this subject for its LAE redshifts and deep optical to far-IR photometry (, , , , , , -3.6, 4.5 , Herschel-250, 350, and 500 ).
8. Conclusion
Galaxy proto-clusters at can be found and confirmed efficiently in large emission-line galaxy surveys. In this paper, we presented the discovery and a detailed characterization of a large-scale structure containing a proto-cluster at traced by LAEs in the HETDEX Pilot Survey. The same structure is also seen in continuum-selected photometric redshift catalogs, and appears as a significant overdensity in stellar mass density and gas absorption maps. We constructed a set of mock LAE catalogs matching the clustering properties of the observed LAEs and examined the fate of this HPS structure, and demonstrated the expected performance of proto-cluster identification in the full HETDEX survey, which will confirm a large number of structures similar to the one studied here.
-
•
The HPS, which performed a LAE survey of in COSMOS at , discovered a prominent density concentration of nine bright LAEs at . With the photometric redshift galaxy catalog of COSMOS/UltraVISTA, we demonstrated that this structure is also seen in overdensities of continuum-selected galaxies in both number counts and volume-specific stellar mass. The structure extends Mpc comoving along the line of sight with two subgroups of LAEs, and a Mpc comoving on the sky revealed by the continuum-selected galaxies. Using the zCOSMOS survey and additional spectroscopy, Diener et al. (2013, 2015) identified and confirmed a galaxy overdensity adjacent to the HPS-COSMOS field at , which appears connected to the HPS structure presented in this paper. We find other independent evidence of this structure in the literature, including an excess of Ly absorbing gas (Lee et al., 2014a).
-
•
To compare the HPS structure with simulations of cosmic structure formation, we constructed a set of mock LAE catalogs from the SAM of Guo et al. (2013). The LAEs were modeled based on the Ly production by young stars and an empirical treatment of the escape of Ly in dusty ISM. The modeling self-consistently reproduces the observed LAE galaxy bias and stellar mass distribution. Regions in the mocks as dense as the HPS structure are then identified and tracked to . The HPS structure, although spanning a few tens of Mpc comoving, should have already broken away from the Hubble flow. Part of the structure will collapse to form a galaxy cluster with by .
-
•
Four of the nine LAEs in the HPS structure are significantly extended in Ly emission, and one of them shows an AGN signature in X-ray (is also an extended Ly source). We speculate that a super-halo scale dense environment might facilitate AGN activities and alter the CGM profiles around high-redshift star-forming galaxies, boosting the spatial extent of Ly. The median stellar mass of the continuum-selected galaxies in the HPS structure is about twice that of the field counterparts. These results demonstrate an accelerated co-evolution of massive galaxies and their supermassive black holes in overdense environments.
-
•
Finally, we predict the performance of proto-cluster identification in the coming HETDEX survey, which will observe of order a million LAEs at . In the full deg2 HETDEX, where 1/4.5 of the sky will be covered by IFU fibers, we expect to confirm at least a hundred massive proto-clusters with . In the deg2 HETDEX-SHELA field, where a complete sky coverage will be performed, we expect to obtain a few tens of proto-clusters with , and a few hundreds of . Together with a rich set of ancillary photometry, the HETDEX-SHELA field will provide a powerful data set to study the rapid mass assembly and galaxy growth of present day massive clusters in their formation epoch.
References
- Adams et al. (2011) Adams, J. J., Blanc, G. A., Hill, G. J., et al. 2011, ApJS, 192, 5
- Allevato et al. (2011) Allevato, V., Finoguenov, A., Cappelluti, N., et al. 2011, ApJ, 736, 99
- Allevato et al. (2014) Allevato, V., Finoguenov, A., Civano, F., et al. 2014, ApJ, 796, 4
- Bacon et al. (2010) Bacon, R., Accardo, M., Adjali, L., et al. 2010, in Proceedings of the Society of Photo-Optical Instrumentation Engineers (SPIE), Vol. 7735, 773508
- Bacon et al. (2015) Bacon, R., Brinchmann, J., Richard, J., et al. 2015, A&A, 575, A75
- Beers et al. (1990) Beers, T. C., Flynn, K., & Gebhardt, K. 1990, AJ, 100, 32
- Behroozi et al. (2013) Behroozi, P. S., Wechsler, R. H., & Conroy, C. 2013, ApJ, 770, 57
- Bielby et al. (2015) Bielby, R. M., Tummuangpak, P., Shanks, T., et al. 2015, ArXiv e-prints, arXiv:1501.01215
- Blanc et al. (2011) Blanc, G. A., Adams, J. J., Gebhardt, K., et al. 2011, ApJ, 736, 31
- Blas et al. (2011) Blas, D., Lesgourgues, J., & Tram, T. 2011, J. Cosmology Astropart. Phys, 7, 34
- Bleem et al. (2015) Bleem, L. E., Stalder, B., de Haan, T., et al. 2015, ApJS, 216, 27
- Boylan-Kolchin et al. (2009) Boylan-Kolchin, M., Springel, V., White, S. D. M., Jenkins, A., & Lemson, G. 2009, MNRAS, 398, 1150
- Brocklehurst (1971) Brocklehurst, M. 1971, MNRAS, 153, 471
- Bruzual & Charlot (2003) Bruzual, G., & Charlot, S. 2003, MNRAS, 344, 1000
- Calzetti et al. (2000) Calzetti, D., Armus, L., Bohlin, R. C., et al. 2000, ApJ, 533, 682
- Capak et al. (2007) Capak, P., Aussel, H., Ajiki, M., et al. 2007, ApJS, 172, 99
- Chabrier (2003) Chabrier, G. 2003, PASP, 115, 763
- Chiang et al. (2013a) Chiang, C.-T., Wullstein, P., Jeong, D., et al. 2013a, J. Cosmology Astropart. Phys, 12, 30
- Chiang et al. (2013b) Chiang, Y.-K., Overzier, R., & Gebhardt, K. 2013b, ApJ, 779, 127
- Chiang et al. (2014) —. 2014, ApJ, 782, L3
- Chonis et al. (2013) Chonis, T. S., Blanc, G. A., Hill, G. J., et al. 2013, ApJ, 775, 99
- Ciardullo et al. (2014) Ciardullo, R., Zeimann, G. R., Gronwall, C., et al. 2014, ApJ, 796, 64
- Coil (2013) Coil, A. L. 2013, The Large-Scale Structure of the Universe, ed. T. D. Oswalt & W. C. Keel, 387
- Cucciati et al. (2014) Cucciati, O., Zamorani, G., Lemaux, B. C., et al. 2014, A&A, 570, A16
- Daddi et al. (2007) Daddi, E., Dickinson, M., Morrison, G., et al. 2007, ApJ, 670, 156
- Darvish et al. (2014) Darvish, B., Sobral, D., Mobasher, B., et al. 2014, ApJ, 796, 51
- Davé et al. (2011) Davé, R., Finlator, K., & Oppenheimer, B. D. 2011, MNRAS, 416, 1354
- Davis & Peebles (1983) Davis, M., & Peebles, P. J. E. 1983, ApJ, 267, 465
- De Lucia & Blaizot (2007) De Lucia, G., & Blaizot, J. 2007, MNRAS, 375, 2
- Dekel & Birnboim (2006) Dekel, A., & Birnboim, Y. 2006, MNRAS, 368, 2
- Dekel et al. (2009a) Dekel, A., Sari, R., & Ceverino, D. 2009a, ApJ, 703, 785
- Dekel et al. (2009b) Dekel, A., Birnboim, Y., Engel, G., et al. 2009b, Nature, 457, 451
- Diener et al. (2013) Diener, C., Lilly, S. J., Knobel, C., et al. 2013, ApJ, 765, 109
- Diener et al. (2015) Diener, C., Lilly, S. J., Ledoux, C., et al. 2015, ApJ, 802, 31
- Dijkstra & Kramer (2012) Dijkstra, M., & Kramer, R. 2012, MNRAS, 424, 1672
- Eisenhauer et al. (2003) Eisenhauer, F., Abuter, R., Bickert, K., et al. 2003, in Proceedings of the Society of Photo-Optical Instrumentation Engineers (SPIE), ed. M. Iye & A. F. M. Moorwood, Vol. 4841, 1548–1561
- Eisenstein (2005) Eisenstein, D. J. 2005, New A Rev., 49, 360
- Elvis et al. (2009) Elvis, M., Civano, F., Vignali, C., et al. 2009, ApJS, 184, 158
- Erb et al. (2011) Erb, D. K., Bogosavljević, M., & Steidel, C. C. 2011, ApJ, 740, L31
- Fassbender et al. (2011) Fassbender, R., Böhringer, H., Nastasi, A., et al. 2011, New Journal of Physics, 13, 125014
- Feldmeier et al. (2013) Feldmeier, J. J., Hagen, A., Ciardullo, R., et al. 2013, ApJ, 776, 75
- Finkelstein et al. (2009) Finkelstein, S. L., Rhoads, J. E., Malhotra, S., & Grogin, N. 2009, ApJ, 691, 465
- Finkelstein et al. (2011) Finkelstein, S. L., Hill, G. J., Gebhardt, K., et al. 2011, ApJ, 729, 140
- Furlong et al. (2014) Furlong, M., Bower, R. G., Theuns, T., et al. 2014, ArXiv e-prints, arXiv:1410.3485
- Gawiser et al. (2007) Gawiser, E., Francke, H., Lai, K., et al. 2007, ApJ, 671, 278
- Genel et al. (2014) Genel, S., Vogelsberger, M., Springel, V., et al. 2014, MNRAS, 445, 175
- Gilbank et al. (2011) Gilbank, D. G., Gladders, M. D., Yee, H. K. C., & Hsieh, B. C. 2011, AJ, 141, 94
- Gladders & Yee (2005) Gladders, M. D., & Yee, H. K. C. 2005, ApJS, 157, 1
- Gronwall et al. (2007) Gronwall, C., Ciardullo, R., Hickey, T., et al. 2007, ApJ, 667, 79
- Guaita et al. (2010) Guaita, L., Gawiser, E., Padilla, N., et al. 2010, ApJ, 714, 255
- Guo et al. (2013) Guo, Q., White, S., Angulo, R. E., et al. 2013, MNRAS, 428, 1351
- Guo & White (2009) Guo, Q., & White, S. D. M. 2009, MNRAS, 396, 39
- Guo et al. (2011) Guo, Q., White, S., Boylan-Kolchin, M., et al. 2011, MNRAS, 413, 101
- Hagen et al. (2014) Hagen, A., Ciardullo, R., Gronwall, C., et al. 2014, ApJ, 786, 59
- Hamilton (1993) Hamilton, A. J. S. 1993, ApJ, 417, 19
- Hatch et al. (2011) Hatch, N. A., Kurk, J. D., Pentericci, L., et al. 2011, MNRAS, 415, 2993
- Hayashi et al. (2012) Hayashi, M., Kodama, T., Tadaki, K.-i., Koyama, Y., & Tanaka, I. 2012, ApJ, 757, 15
- Hayashi et al. (2014) Hayashi, M., Kodama, T., Koyama, Y., et al. 2014, MNRAS, 439, 2571
- Hayashino et al. (2004) Hayashino, T., Matsuda, Y., Tamura, H., et al. 2004, AJ, 128, 2073
- Hayes et al. (2010) Hayes, M., Östlin, G., Schaerer, D., et al. 2010, Nature, 464, 562
- Hewett (1982) Hewett, P. C. 1982, MNRAS, 201, 867
- Hill et al. (2008a) Hill, G. J., MacQueen, P. J., Smith, M. P., et al. 2008a, in Proceedings of the Society of Photo-Optical Instrumentation Engineers (SPIE), Vol. 7014, 701470
- Hill et al. (2008b) Hill, G. J., Gebhardt, K., Komatsu, E., et al. 2008b, in Astronomical Society of the Pacific Conference Series, Vol. 399, Panoramic Views of Galaxy Formation and Evolution, ed. T. Kodama, T. Yamada, & K. Aoki, 115
- Hill et al. (2012) Hill, G. J., Tuttle, S. E., Lee, H., et al. 2012, in Proceedings of the Society of Photo-Optical Instrumentation Engineers (SPIE), Vol. 8446, 84460N
- Hill et al. (2014) Hill, G. J., Tuttle, S. E., Drory, N., et al. 2014, in Proceedings of the Society of Photo-Optical Instrumentation Engineers (SPIE), Vol. 9147, 91470Q
- Kaiser (1987) Kaiser, N. 1987, MNRAS, 227, 1
- Kang (2014) Kang, X. 2014, MNRAS, 437, 3385
- Kang et al. (2012) Kang, X., Li, M., Lin, W. P., & Elahi, P. J. 2012, MNRAS, 422, 804
- Kennicutt (1998) Kennicutt, Jr., R. C. 1998, ARA&A, 36, 189
- Kereš et al. (2005) Kereš, D., Katz, N., Weinberg, D. H., & Davé, R. 2005, MNRAS, 363, 2
- Komatsu et al. (2011) Komatsu, E., Smith, K. M., Dunkley, J., et al. 2011, ApJS, 192, 18
- Kovač et al. (2007) Kovač, K., Somerville, R. S., Rhoads, J. E., Malhotra, S., & Wang, J. 2007, ApJ, 668, 15
- Koyama et al. (2013) Koyama, Y., Kodama, T., Tadaki, K.-i., et al. 2013, MNRAS, 428, 1551
- Kravtsov & Borgani (2012) Kravtsov, A. V., & Borgani, S. 2012, ARA&A, 50, 353
- Kriek et al. (2009) Kriek, M., van Dokkum, P. G., Labbé, I., et al. 2009, ApJ, 700, 221
- Kuiper et al. (2011) Kuiper, E., Hatch, N. A., Venemans, B. P., et al. 2011, MNRAS, 417, 1088
- Kurk et al. (2004) Kurk, J. D., Pentericci, L., Röttgering, H. J. A., & Miley, G. K. 2004, A&A, 428, 793
- Kurk et al. (2000) Kurk, J. D., Röttgering, H. J. A., Pentericci, L., et al. 2000, A&A, 358, L1
- Landy & Szalay (1993) Landy, S. D., & Szalay, A. S. 1993, ApJ, 412, 64
- Larkin et al. (2006) Larkin, J., Barczys, M., Krabbe, A., et al. 2006, in Proceedings of the Society of Photo-Optical Instrumentation Engineers (SPIE), Vol. 6269, 62691A
- Laureijs et al. (2011) Laureijs, R., Amiaux, J., Arduini, S., et al. 2011, ArXiv e-prints, arXiv:1110.3193
- Laursen et al. (2009a) Laursen, P., Razoumov, A. O., & Sommer-Larsen, J. 2009a, ApJ, 696, 853
- Laursen & Sommer-Larsen (2007) Laursen, P., & Sommer-Larsen, J. 2007, ApJ, 657, L69
- Laursen et al. (2009b) Laursen, P., Sommer-Larsen, J., & Andersen, A. C. 2009b, ApJ, 704, 1640
- Le Fèvre et al. (2015) Le Fèvre, O., Tasca, L. A. M., Cassata, P., et al. 2015, A&A, 576, A79
- Lee et al. (2014a) Lee, K.-G., Hennawi, J. F., Stark, C., et al. 2014a, ApJ, 795, L12
- Lee et al. (2014b) Lee, K.-S., Dey, A., Hong, S., et al. 2014b, ApJ, 796, 126
- Lehmer et al. (2009) Lehmer, B. D., Alexander, D. M., Geach, J. E., et al. 2009, ApJ, 691, 687
- Lemaux et al. (2014) Lemaux, B. C., Cucciati, O., Tasca, L. A. M., et al. 2014, A&A, 572, A41
- Lesgourgues (2011a) Lesgourgues, J. 2011a, ArXiv e-prints, arXiv:1104.2932
- Lesgourgues (2011b) —. 2011b, ArXiv e-prints, arXiv:1104.2934
- Lilly et al. (2007) Lilly, S. J., Le Fèvre, O., Renzini, A., et al. 2007, ApJS, 172, 70
- Lilly et al. (2009) Lilly, S. J., Le Brun, V., Maier, C., et al. 2009, ApJS, 184, 218
- Martin et al. (2005) Martin, D. C., Fanson, J., Schiminovich, D., et al. 2005, ApJ, 619, L1
- Martini et al. (2013) Martini, P., Miller, E. D., Brodwin, M., et al. 2013, ApJ, 768, 1
- Marulli et al. (2013) Marulli, F., Bolzonella, M., Branchini, E., et al. 2013, A&A, 557, A17
- Matsuda et al. (2005) Matsuda, Y., Yamada, T., Hayashino, T., et al. 2005, ApJ, 634, L125
- Matsuda et al. (2009) Matsuda, Y., Nakamura, Y., Morimoto, N., et al. 2009, MNRAS, 400, L66
- Matsuda et al. (2011) Matsuda, Y., Smail, I., Geach, J. E., et al. 2011, MNRAS, 416, 2041
- Matsuda et al. (2012) Matsuda, Y., Yamada, T., Hayashino, T., et al. 2012, MNRAS, 425, 878
- McCracken et al. (2012) McCracken, H. J., Milvang-Jensen, B., Dunlop, J., et al. 2012, A&A, 544, A156
- Mitchell et al. (2014) Mitchell, P. D., Lacey, C. G., Cole, S., & Baugh, C. M. 2014, MNRAS, 444, 2637
- Momose et al. (2014) Momose, R., Ouchi, M., Nakajima, K., et al. 2014, MNRAS, 442, 110
- Muzzin et al. (2013) Muzzin, A., Marchesini, D., Stefanon, M., et al. 2013, ApJS, 206, 8
- Nagamine et al. (2010) Nagamine, K., Ouchi, M., Springel, V., & Hernquist, L. 2010, PASJ, 62, 1455
- Nakajima et al. (2012) Nakajima, K., Ouchi, M., Shimasaku, K., et al. 2012, ApJ, 745, 12
- Oke & Gunn (1983) Oke, J. B., & Gunn, J. E. 1983, ApJ, 266, 713
- Oppenheimer & Davé (2008) Oppenheimer, B. D., & Davé, R. 2008, MNRAS, 387, 577
- Orsi et al. (2008) Orsi, A., Lacey, C. G., Baugh, C. M., & Infante, L. 2008, MNRAS, 391, 1589
- Osterbrock & Ferland (2006) Osterbrock, D. E., & Ferland, G. J. 2006, Astrophysics of gaseous nebulae and active galactic nuclei
- Ouchi et al. (2005) Ouchi, M., Shimasaku, K., Akiyama, M., et al. 2005, ApJ, 620, L1
- Ouchi et al. (2008) —. 2008, ApJS, 176, 301
- Ouchi et al. (2010) Ouchi, M., Shimasaku, K., Furusawa, H., et al. 2010, ApJ, 723, 869
- Overzier et al. (2013) Overzier, R. A., Nesvadba, N. P. H., Dijkstra, M., et al. 2013, ApJ, 771, 89
- Overzier et al. (2009) Overzier, R. A., Heckman, T. M., Tremonti, C., et al. 2009, ApJ, 706, 203
- Palunas et al. (2004) Palunas, P., Teplitz, H. I., Francis, P. J., Williger, G. M., & Woodgate, B. E. 2004, ApJ, 602, 545
- Peacock (1999) Peacock, J. A. 1999, Cosmological Physics
- Peebles & Hauser (1974) Peebles, P. J. E., & Hauser, M. G. 1974, ApJS, 28, 19
- Pentericci et al. (2002) Pentericci, L., Kurk, J. D., Carilli, C. L., et al. 2002, A&A, 396, 109
- Pentericci et al. (2000) Pentericci, L., Kurk, J. D., Röttgering, H. J. A., et al. 2000, A&A, 361, L25
- Prescott et al. (2008) Prescott, M. K. M., Kashikawa, N., Dey, A., & Matsuda, Y. 2008, ApJ, 678, L77
- Pujol & Gaztañaga (2014) Pujol, A., & Gaztañaga, E. 2014, MNRAS, 442, 1930
- Ramsey et al. (1998) Ramsey, L. W., Adams, M. T., Barnes, T. G., et al. 1998, in Proceedings of the Society of Photo-Optical Instrumentation Engineers (SPIE), ed. L. M. Stepp, Vol. 3352, 34–42
- Reddy et al. (2012) Reddy, N. A., Pettini, M., Steidel, C. C., et al. 2012, ApJ, 754, 25
- Rettura et al. (2010) Rettura, A., Rosati, P., Nonino, M., et al. 2010, ApJ, 709, 512
- Rodighiero et al. (2014) Rodighiero, G., Renzini, A., Daddi, E., et al. 2014, MNRAS, 443, 19
- Saito et al. (2015) Saito, T., Matsuda, Y., Lacey, C. G., et al. 2015, MNRAS, 447, 3069
- Salpeter (1955) Salpeter, E. E. 1955, ApJ, 121, 161
- Sanders et al. (2007) Sanders, D. B., Salvato, M., Aussel, H., et al. 2007, ApJS, 172, 86
- Shimasaku et al. (2003) Shimasaku, K., Ouchi, M., Okamura, S., et al. 2003, ApJ, 586, L111
- Skibba et al. (2014) Skibba, R. A., Smith, M. S. M., Coil, A. L., et al. 2014, ApJ, 784, 128
- Sobral et al. (2013) Sobral, D., Swinbank, A. M., Stott, J. P., et al. 2013, ApJ, 779, 139
- Sobral et al. (2015) Sobral, D., Matthee, J., Best, P. N., et al. 2015, ArXiv e-prints, arXiv:1502.06602
- Song et al. (2014) Song, M., Finkelstein, S. L., Gebhardt, K., et al. 2014, ApJ, 791, 3
- Speagle et al. (2014) Speagle, J. S., Steinhardt, C. L., Capak, P. L., & Silverman, J. D. 2014, ApJS, 214, 15
- Spergel et al. (2013) Spergel, D., Gehrels, N., Breckinridge, J., et al. 2013, ArXiv e-prints, arXiv:1305.5422
- Spergel et al. (2015) Spergel, D., Gehrels, N., Baltay, C., et al. 2015, ArXiv e-prints, arXiv:1503.03757
- Spitler et al. (2012) Spitler, L. R., Labbé, I., Glazebrook, K., et al. 2012, ApJ, 748, L21
- Springel et al. (2005) Springel, V., White, S. D. M., Jenkins, A., et al. 2005, Nature, 435, 629
- Stark et al. (2014) Stark, C. W., White, M., Lee, K.-G., & Hennawi, J. F. 2014, ArXiv e-prints, arXiv:1412.1507
- Steidel et al. (1998) Steidel, C. C., Adelberger, K. L., Dickinson, M., et al. 1998, ApJ, 492, 428
- Steidel et al. (2005) Steidel, C. C., Adelberger, K. L., Shapley, A. E., et al. 2005, ApJ, 626, 44
- Steidel et al. (2000) —. 2000, ApJ, 532, 170
- Steidel et al. (2011) Steidel, C. C., Bogosavljević, M., Shapley, A. E., et al. 2011, ApJ, 736, 160
- Suwa et al. (2006) Suwa, T., Habe, A., & Yoshikawa, K. 2006, ApJ, 646, L5
- Taniguchi et al. (2007) Taniguchi, Y., Scoville, N., Murayama, T., et al. 2007, ApJS, 172, 9
- Venemans et al. (2002) Venemans, B. P., Kurk, J. D., Miley, G. K., et al. 2002, ApJ, 569, L11
- Venemans et al. (2004) Venemans, B. P., Röttgering, H. J. A., Overzier, R. A., et al. 2004, A&A, 424, L17
- Venemans et al. (2005) Venemans, B. P., Röttgering, H. J. A., Miley, G. K., et al. 2005, A&A, 431, 793
- Venemans et al. (2007) —. 2007, A&A, 461, 823
- Verhamme et al. (2012) Verhamme, A., Dubois, Y., Blaizot, J., et al. 2012, A&A, 546, A111
- Weinmann et al. (2012) Weinmann, S. M., Pasquali, A., Oppenheimer, B. D., et al. 2012, MNRAS, 426, 2797
- White et al. (2015) White, C. E., Somerville, R. S., & Ferguson, H. C. 2015, ApJ, 799, 201
- Wu et al. (2013) Wu, H.-Y., Hahn, O., Wechsler, R. H., Mao, Y.-Y., & Behroozi, P. S. 2013, ApJ, 763, 70
- Yamada et al. (2012a) Yamada, T., Matsuda, Y., Kousai, K., et al. 2012a, ApJ, 751, 29
- Yamada et al. (2012b) Yamada, T., Nakamura, Y., Matsuda, Y., et al. 2012b, AJ, 143, 79
- Yang et al. (2009) Yang, Y., Zabludoff, A., Tremonti, C., Eisenstein, D., & Davé, R. 2009, ApJ, 693, 1579
- Yuan et al. (2014) Yuan, T., Nanayakkara, T., Kacprzak, G. G., et al. 2014, ApJ, 795, L20
- Zheng et al. (2011) Zheng, Z., Cen, R., Weinberg, D., Trac, H., & Miralda-Escudé, J. 2011, ApJ, 739, 62
Appendix A Another Structure at at z=2.10
HPS-COSMOS also partially covers another proto-cluster at (indicated by a short thick tick in Figure 2) discovered by galaxy overdensities in a deep medium-bands photometric survey of ZFOURGE (Spitler et al., 2012). Three cores of possibly virialized halos of at the observed epoch are identified. In Chiang et al. (2014), we recovered this structure on a scale of Mpc comoving using the same COSMOS/UltraVISTA photometric redshift galaxy catalog used here, and together revealed other 35 candidate proto-clusters in COSMOS field. Recently, Yuan et al. (2014) has performed a large spectroscopic campaign and confirmed more than 50 objects in this structure, estimating a redshift zero virial mass of . Within the region of the three cores, we do not detect any LAE in HPS, but we did find three LAEs (summarized in Table 4, see also Figure 2) associated with this proto-cluster several arcmins away from the cores, indicating that the overdensity of this structure indeed has a large spatial extent, consistent with what was reported in Chiang et al. (2014) and the theoretical expectation of a forming cluster (Chiang et al., 2013b). In the overdensity/field comparisons of galaxy populations in § 5 and § 7, we have considered these three LAEs located in large-scale overdensity.
| HPS | aaWith an uncertainty of based on a 0.5 Å line center uncertainty. | Flux | L | Spectral | Spatial | Counter- | Counter- | EWresteeBased on an interpolation between the two nearest filters for continuum. | FluxX-ray | ||
|---|---|---|---|---|---|---|---|---|---|---|---|
| Index | () | (J2000) | (J2000) | () | () | FWHMbbAfter deconvolution with a 5 Å FWHM instrumental resolution ( km s-1). | FWHMccIncluding a tophat component of the fiber size of and the effects of dither pattern and discrete sampling. | part mR | part Prob.ddProbability of counterpart association (-band). | () | (0.5–10 keV) |
| [deg] | [deg] | [ cgs] | [ cgs] | [km s-1] | [arcsec] | [mag] | [Å] | [ cgs] | |||
| 244 | 2.0996 | 150.09858 | 2.22000 | 10.4 | 3.5 | 114 | 3.5 | 26.02 | 0.25 | 114.1 | |
| 261 | 2.0960 | 150.11904 | 2.29678 | 143.7 | 48.4 | 886 | 8.3 | 23.76 | 0.87 | 536.7 | 2040 |
| 313 | 2.0975 | 150.16992 | 2.30656 | 25.1 | 8.5 | 249 | 5.0 | 22.75 | 0.98 | 23.9 |