Sentiment cascades in the 15M movement
Abstract
Recent grassroots movements have suggested that online social networks might play a key role in their organization, as adherents have a fast, many-to-many, communication channel to help coordinate their mobilization. The structure and dynamics of the networks constructed from the digital traces of protesters have been analyzed to some extent recently. However, less effort has been devoted to the analysis of the semantic content of messages exchanged during the protest. Using the data obtained from a microblogging service during the brewing and active phases of the 15M movement in Spain, we perform the first large scale test of theories on collective emotions and social interaction in collective actions. Our findings show that activity and information cascades in the movement are larger in the presence of negative collective emotions and when users express themselves in terms related to social content. At the level of individual participants, our results show that their social integration in the movement, as measured through social network metrics, increases with their level of engagement and of expression of negativity. Our findings show that non-rational factors play a role in the formation and activity of social movements through online media, having important consequences for viral spreading.
keywords:
Sentiment cascades in the 15M movement
1 Introduction
The Occupy and 15M movements are recent examples of self-organized social movements that appeared in developed countries in response to a widespread perception of social and economical inequality [1, 2]. While these movements address a wide range of problems in different countries, they share a common factor, their usage of social media to communicate, organize, and deliberate about the purpose of the movement and its actions [3, 4]. Social media allow the participants of these movements to circumvent their lack of influence on state-and private-owned mass media [5], creating an emergent structure without a central actor or decision group. As a side effect, these movements leave public digital traces of their activity, which allows us to analyze their formation, behavior, and organization up to unprecedented scales and resolutions.
Collective actions pose a classical paradox of the tragedy of the commons [6]: A purely rational individual would choose not to participate in a movement it agrees with, as it would receive its collective benefits without the associated costs and risks of taking part on it. Thus, the existence of collective actions and social movements requires considerations beyond rational decisions, including emotions [7] and social influence [8] between the participants of a social movement. In this article, we present a detailed quantitative analysis of the digital traces of the 15M movement, the Spanish precursor of Occupy movements across Europe and America [2]. This decentralized movement emerged in Spain in the aftermath of the so-called Arab Spring as a reaction to public spending cuts and the economic crisis. It was mainly nucleated in online social networks before massive offline demonstrations ended up in several camp sites in many city squares. From that point on, the movement consolidated and lasted for months. Even today the foundations of the 15M movement drives the political agenda of some new parties and associations in Spain.
Our analysis covers its online social structure and the content of the public messages exchanged in Twitter, the main online medium used by the movement. Twitter users create directed links to follow the messages of other users and communicate through short public messages called tweets. We analyze the content of a large set of tweets about the 15M movement, extracting sentiment values and semantic content related to social and cognitive processes. Our aim is to explore the role of social emotions in group activity and collective action. We address how emotional interaction supports the creation of social movements and how emotional expressions lead to the involvement of the participants of the movement.
According to the theory of collective identity of Emile Durkheim, group gatherings contribute to the creation of collective identity by means of rituals and symbols that produce an atmosphere of emotional synchrony [9]. These rituals are often emotionally charged and show an inverse relation between emotional intensity and frequency [10]. The emotions experienced by the participants of these gatherings contribute to social inclusion and identification with the collective, as empirically shown in a variety of experiments [11]. This also holds for the 15M movement, for which survey results show that participants of the large demonstrations across Spain in 2011 felt a stronger emotional communion with the movement, in comparison to those participants who did not attend to the demonstration [12]. In this article, we provide a quantitative analysis of how collective identity and action emerged in the 15M movement, through the analysis of the digital traces of its participants in the Twitter social network. We pay special attention to emotional expression in tweets, social inclusion in the follower network of the participants of the movement, and sentiment polarization in the creation and social response to the movement.
Online media offer large datasets to explore political activity at a large scale, to find out about popularity and mobilization in political campaigns [13], and political alignment based on public messages [14, 15]. Analyzing online social networks, for example by means of the k-core decomposition method, can also reveal relevant information about the role of influential individuals [16, 17] and the social resilience of an online community [18]. Users of online social networks communicate through public messages that provide the breeding ground for collective emotional states, which have the potential to create the identity and mobilization of the movement. Previous states of collective emotional persistence were detected in the short messages of IRC chats [19] and spread through social networks as cascades of emotions [20], forming patterns in which happy individuals are likely to be connected to other happy ones [21].
In our analysis we follow a top-down approach, from the collective level of the movement to the actions of its individuals and their relations. We start by analyzing the dynamic aspect of the 15M movement, identifying cascades of tweets as in previous research [17]. We measure the size of these cascades in terms of the amount of participants communicating in the cascade (spreaders), and the amount of participants exposed to the cascade (listeners). We analyze how cascade sizes depend on collective emotions and the use of terms related to cognitive and social processes. Finally, we zoom into the microscopic level of individuals and their interactions, creating an additional dataset of tweets of each participant of the 15M movement. We relate their expression of emotions, cognitive, and social processes to their activity and social integration in the movement, as quantified by their k-core centrality within the social network.
2 Results
2.1 Sentiment analysis in Spanish
Our adaptation of SentiStrength to the Spanish language [22], explained in the Materials and Methods section, reaches accuracy values above for two test datasets (See SI table II). These results are comparable to state of the art unsupervised techniques of sentiment analysis for the Spanish language [23]. Furthermore, the quality of the sentiment analysis tool does not differ for tweets related to politics and economics (See SI table III). This result shows that our application of SentiStrength is valid, as 15M tweets appear in a context of political protests related to economic measures.
2.2 Activity and information cascades
Previous research has shown a positive relation between retweeting and emotional content [24]. Here, we go beyond a plain retweeting behavior and analyze cascades associated with the 15M topic. We quantify emotions in the tweets related to the 15M movement through sentiment analysis on a dataset of tweets selected by the hashtags related to the 15M movement, as explained in the Materials and Methods section. We focus on the analysis of tweet cascades, also defined in Materials and Methods, to detect how the content of tweets influences both the activity and the volume of information perceived by the participants of the movement.
We define the size of an activity cascade as the number of unique Twitter users that produce a tweet in the cascade, also known as the number of spreaders, . The associated size of an information cascade corresponds to the amount of unique users who receive some tweet of the cascade in their tweet feeds. This concept, commonly known as exposure of the tweets in the cascade, is the sum of the amount of participants who follow at least one spreader, denoted as .
We characterize the collective emotions in a cascade, , using the ratios of positive, neutral, and negative tweets:
| (1) |
where is the set of tweets on cascade , is the emotional content of tweet as given by the sentiment analysis tool, and is the total amount of tweets related to the 15M movement comprising cascade . The collective emotions expressed by the participants of a cascade have the potential to activate additional participants, influencing its activity size and information spreading. To test this possibility, we classify cascades according to their ratios of positive, , and negative, , tweets and compare these with the total ratios of positive tweets, , and negative tweets, . If both and , we label the cascade as neutral. If and , we label it as positive, and if and , we label it as negative. When both and , we label it as bipolar. From the total of cascades we analyzed, are positive (), are negative (), are neutral (), and are bipolar ().
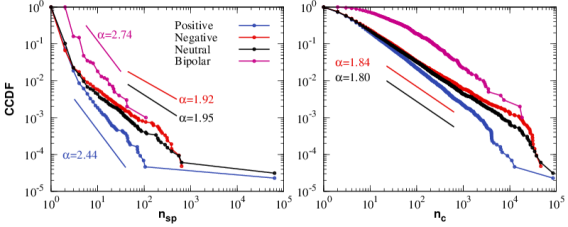
Figure 1 shows the complementary cumulative density function (CCDF) of activity cascade sizes, , and of information cascade sizes, . Bipolar cascades are likely to be larger than positive, negative, and neutral, but we do not observe extremely large bipolar cascades, since they are less frequent in general. We apply the Kolmogorov-Smirnov test (KS) with a tail correction factor, as explained in [25], to test the equality of information and activity cascades across emotion classes. The KS tests validate the observation that cascade sizes (both and ) in bipolar cascades are different from in any of the other three classes (details in SI Table V). Furthermore, the test rejects the null hypothesis that positive cascade sizes are distributed as their negative and neutral counterparts, and only fails to reject the null hypothesis for the case of negative versus neutral information cascades.
To further compare these cascades classes, we fit power law distributions of the form for , to the empirical distributions of and . The power law distribution is characterized by a skewed right tail that starts at a minimum value of and scales with exponent . The estimated value of can reveal important properties of how the mean and variance of the distribution scale with system size, which in our case is the amount of users in the network. For example, implies that both the mean and the variance of increase with the size of the sample [26], and thus the expected cascade size would increase for larger movements. Power law distributions were fitted using the Python package powerlaw [27]. Power law fits reveal that for positive cascades decays with an exponent (see Table VI of the SI for details). This means that the distribution of decreases faster than negative and neutral cascades, with exponents and respectively, but slower than bipolar ones, which are best fitted with an exponent of . The exponents of positive and bipolar activity cascade sizes, right above , imply that their expected size does not scale with system size, i.e. they do not become larger with larger populations. This is not the case for negative and neutral activity cascades, with exponents too close to 2 to arrive at any conclusion.
We also investigate the goodness of the fits by comparing them to fits to other distributions. In this way we are able to identify if a power law behavior is a good description of our data. Specifically, we calculate the likelihood ratio, (see SI Table VI), between the power law and a lognormal distribution, and the corresponding -value indicating the significance for the observed likelihood direction. Positive values of suggest that the most likely model is a power law distribution. However, when these values are obtained in combination with high -values (), the evidence of a power law versus a lognormal distribution is moderated [27].
For the case of information cascades, the distributions of negative and neutral cascade sizes are similar (KS p-value ), but the null hypothesis that they have the same size as the positive ones could be rejected. The fit of power-law distributions reveals that the scaling of positive and bipolar cascade sizes are similar, and respectively, while negative and neutral information cascade size distributions decay with and (see SI Table VI for details). The exponents below 2 imply that the expected size of the audience of negative and neutral cascades increases with system size, while bipolar and positive have exponents too close to to arrive to any conclusion. Furthermore, the log-likelihood analysis indicates that data is better described by a log-normal distribution for positive and bipolar cascades. Although this evidence is moderated (-values and respectively), it suggests that positive and bipolar information cascades are more likely to follow a lognormal distribution than a power law distribution and thus do not scale with system size.
The above results highlight the role of emotional expression inside a social movement: cascades with positive emotions (including bipolar ones) do not seem to trigger more activity nor spread more information than those with more objective and negative expression. This difference for distinct collective emotions opens the question of the role of the first tweet in the cascade. To test if this effect is due to the sentiment of the first tweet in the cascade, we extend our analysis to compare the distributions of cascades sizes for cascades that started with a positive, negative, or a neutral tweet (SI section IV). We find no consistent differences on cascade sizes depending on the emotions expressed in the first tweet of the cascade. This highlights the role of collective emotions in spreading processes: it is not the emotion of the tweet that triggers the cascade what matters, it is the overall sentiment of all the people involved in the cascade.
In addition to the sentiment, the semantic content of tweets can be analyzed with respect to social and cognitive content through psycholinguistic methods (see Materials and Methods). In particular, the content of tweets in relation to social and cognitive processes have the potential to determine the success or failure of the spreading process. To check this we perform an analogous analysis of the distribution of the cascade size for different cascades types. In particular, we apply the same method as in the previous section to classify the collective emotions in cascades, comparing their ratios of social and cognitive terms to the mean values of the whole dataset. This way, each cascade is classified having either high social content or a low social content, and having either a high cognitive content or a low cognitive content.
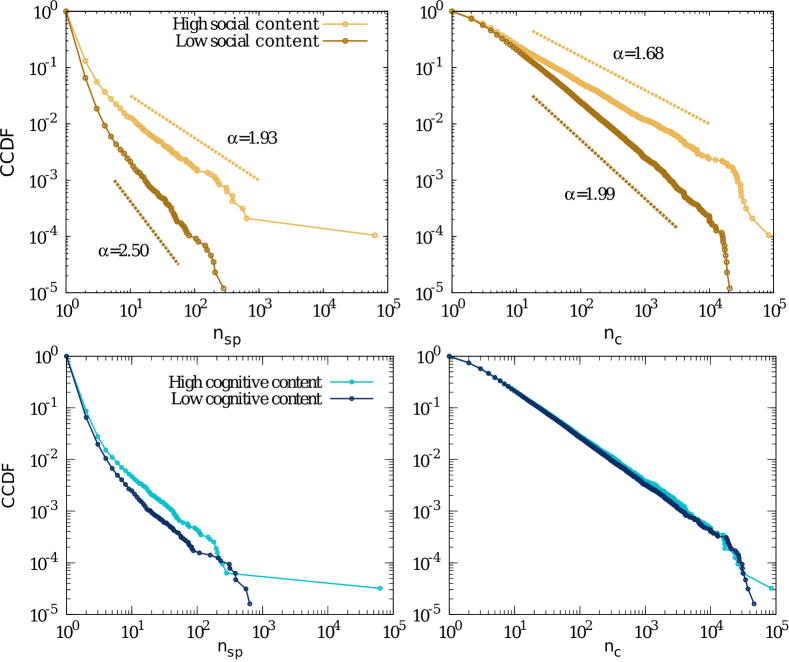
The influence of social processes becomes evident when analyzing the distributions of cascade sizes depending on their social content, shown in Fig 2. The distributions of both information and activity cascade sizes are different for high and low social content, as validated by a KS test (see SI Table IX). Power-law fits indicate that the distribution of the size of activity cascades with high social content have an exponent of , while the distribution for low social content has an exponent of . This difference highlights the role of social processes in cascades during the formation of the 15M movement. Cascades with social expression had an expected size that scaled with the size of the movement, while those that did not include such language were subcritical. For the case of information cascades, the same result seems to hold. In this case, however, information cascades with high social content exhibit a power-law behavior with exponent , which indicates that the expected size scales with the system size. The outcome is not so clear for low social content information cascades, for which is compatible with . However, the latter are best described by a log-normal distribution, as suggested by the log-likelihood ratio , and the expected size of the audience does not scale with the system size (details on these fits can be found in SI Table X).
The above results indicate that the behavior of cascades (both of activity and information) having high social content is different from those where the social content is lower. On the contrary, words associated with cognitive processes did not play such an important role in cascade sizes. The lower panel of Fig 2 shows the CCDF of cascade sizes classified depending on their cognitive content. The cognitive content of the tweets in an information cascade does not make it larger, as validated with a KS test (see SI). For the case of activity cascade sizes, a KS test rejects the hypothesis that they are the same, indicating that high cognitive content have a slightly larger likelihood of involving more spreaders, but not more listeners. Power-law fits show that the exponents of both types of cascades are above ; while both exponents of information cascades are below .
2.3 The movement at the local level
The above analysis shows how expression related to social processes and emotions leads to spreading of activity and information through the social network of 15M. The cascades present in the movement are not just large groups of tweets; participants contribute repeatedly in these, and show heterogeneous levels of engagement in the movement.
In this section, we test the principle of Durkheim’s theory that social integration in a movement leads to higher levels of participation, followed by feelings of emotional synchrony with other participants in group actions. The main group actions of 15M were physical meetings in the center of towns, demonstrations, and assemblies. But other kind of group activities took place in the online medium. Tweet cascades created pockets of interaction within Twitter, such that participants were aware of the large attention that the movement was receiving online. To quantify the social activity of each participant, we compute a vector of user features that quantifies the integration in the movement, its level of activity, and its expressed emotions and levels of social and cognitive content. We estimate participant integration in the movement in terms of the follower/following network, i.e., a network in which a link from user to user is created when the latter follows the former. Thus, the direction of links goes from a user to its followers, indicating the direction in which information flows. We measure the -core centrality of a user, (explained in Materials and Methods), where the higher , the better integrated the user is. We also control for its amount of followers, , and the amount of participants followed by , . The level of engagement in the movement is approximated by the total amount of tweets about 15M created by the participant, . We measure the expression of emotions by means of the ratios of positive, , and negative tweets, , and the ratios of words related to social processes, , and cognitive processes, .
| R2 | |||||||||
|---|---|---|---|---|---|---|---|---|---|
| , , | |||||||||
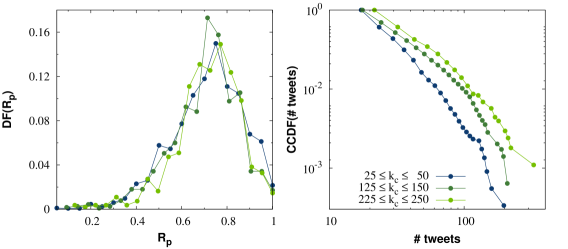
We analyze the correlations between normalized versions of the variables using a series of linear regressions. Table 1 shows the results only for the regression of and , the rest is reported in the SI Table XI. As proposed by Durkheim, the level of engagement in the movement increases with social integration, estimated through the coreness of the user. Other metrics, such as in- and out-degree, are also positively related to the activity of a user, but with weight much smaller than the weight of coreness. The right panel of Fig 3 shows the CCDF of for different participants by their coreness. Integration in the movement is correlated with activity, showing that participants with higher integration in the movement are clearly more active. It must be noted that this analysis does not test the causal nature of this relation, but clearly rejects the null hypothesis of the independence between activity and integration.
As visible in the left panel of Figure 3, positive expression has no significant effect on engagement. Participants with different do not have significantly different ratios of positive tweets about 15M. Negative expression has a positive but small weight in both activity and coreness, as reported in Table 1. We can reject the hypotheses that negative expression is uncorrelated or negatively correlated with integration in the movement, but the size effect of negative expression in both integration and engagement is very low, as shown by the weight in Table 1.
We do not find any significant relation between coreness and cognitive expression. But we find a significant negative weight of social expression in relation to both activity and coreness. This is consistent with our finding that cascades with higher social content activate larger amounts of participants. These cascades potentially start in the core and reach participants with lower integration in the movement. Tweets about topics less related to social processes do not reach the periphery of the movement. In conclusion, less integrated users appear to be driven more by social processes.
An alternative condition for the emotions and the ratios of social and cognitive terms of each participant is the assortativity with other participants. Members of the 15M movement might be more emotional due to the emotional expression of their immediate neighbors, in addition to their social integration within the movement as a whole. To test this, we measure Pearson’s correlation coefficient of the ratios of positive, negative, neutral, social, and cognitive tweet ratios of the participants, with the same ratio calculated over the set of users that each participant follows inside the movement. We replicate this analysis for two datasets, one based only on the tweets about 15M, and the other using an independent sample of 200 tweets per participant (detailed in Materials and Methods). To test the significance of our results against spurious correlations due to the network topology, we also computed correlation coefficients in 1000 shuffled datasets in which the emotion, cognitive, and social scores were permuted [28].
| Dataset | |||||
|---|---|---|---|---|---|
| 15M | 0.063 | 0.068 | 0.065 | 0.035 | 0.128 |
| 15M shuffled | 0.00002 (0.008) | -0.0001 (0.007) | 0.0001 (0.007) | -0.0002 (0.008) | -0.0002 (0.007) |
| individuals | 0.261 | 0.364 | 0.315 | 0.336 | 0.358 |
| ind. shuffled | 0.029 (0.01) | 0.014 (0.009) | 0.017 (0.009) | 0.028 (0.009) | 0.022 (0.009) |
Table 2 reports the correlation coefficients for each dataset. All correlations are significant and positive, indicating that the emotions and semantic content expressed by a participant are correlated with its first neighbors, and thus emotions and psycholinguistic content are shared along social links within the movement. It should be noted that the correlation coefficients for the 15M data are much weaker than for the 200 tweets from each individual, indicating that the latter sample has more power to reveal correlations in psycholinguistic analysis. While the 15M data is sparser and noisier, the conclusions of the analysis of 15M data are consistent with the analysis of 200 tweets per individual, and robust with respect to the shuffled datasets. Furthermore, these results are in line with previous research [21] on emotional expression of subjective well-being, and extend the analysis with the presence of correlations for social and cognitive terms beyond emotional expression in Twitter.
3 Discussion
The present work analyzes the evolution of the 15M movement through sentiment and linguistic analysis of the participants’ communication in the Twitter social network. Using a dataset of tweets related to the 15M movement, we track the activity of 84,698 Twitter users. Our analysis includes 556,334 tweets during a period of 32 days, providing an illustration of the structure of the movement in two ways: (i) at the dynamic aspect of cascades in the discussion between connected users, and (ii) at the individual level of social integration and participation of each user.
We combine psycholiguistics, sentiment analysis, and dynamic cascade analysis, to understand the role of tweet content in the size and reach of collective discussions in Twitter. In line with previous works in social psychology [29], we assess the role of emotions in social interaction and collective action. We test the hypothesis that collective emotions fuel social interaction by analyzing cascades according to their emotional, cognitive, and social content. We find that the sentiment expressed in the first tweet of a cascade does not significantly impact the size of the cascade. Instead, the collective emotions in the cascade are responsible for its size in terms of spreaders and listeners. In particular, cascades without positive content tend to be larger, and their size follows a qualitatively different distribution. The cognitive content of the tweets of a cascade play no role in their spread. On the other hand, our analysis of social content in the cascades reveals a clear pattern: cascades with large ratios of social-related terms have distributions of listener and spreader sizes that scale with system size, in contrast with cascades with low ratios of social-related terms, which follow distributions that have bounded means.
Our analysis at the individual level reveals that users are more integrated in the movement, measured by their k-core centrality, if they exhibit higher levels of engagement and express stronger negativity, in line with the overall negative context of the movement (indignants). Our analysis also reveals that highly integrated and influential users have a lower tendency to express social content in tweets. This indicates that social activation became salient in the periphery of the movement rather than in its core. We emphasize that our findings are consistent with theories in sociology and social psychology and confirm their statements by quantifying, for the first time, social and psychological influence in collective action at large scale.
Our results have implications for research on social movements. The differentiation between social and cognitive processes is evident when analyzing the size of cascades. Larger cascades have higher amounts of social terms, invoking the participation of other users. This is also consistent with our findings at the individual level: social integration is clearly related to activity levels, showing the relevance of nonrational factors in collective action. The members of a movement are not deterministically defined by their demographic background and income. Instead, the amount of social connections they have in the movement and their synchrony with the emotions expressed by the movement as a whole are predictors of their involvement.
Our findings show the added value of including additional psycholinguistic classes into our analysis, i.e. the consideration of social and cognitive terms beyond sentiment analysis. Furthermore, our sentiment analysis adaptation to Spanish demonstrate the relevance of sentiment analysis in languages other than English, offering new opportunities to compare collective phenomena in a wide variety of societies and political systems.
Beyond social movement analysis, our work has implications for studying other online phenomena, such as memes or viral marketing campaigns. Our findings on cascade sizes for different psycholinguistic classes suggest that words related to social processes lead to larger collective responses in Twitter, pushing the virality of content above a critical threshold that produces qualitatively different cascading behavior.
4 Materials and Methods
15M tweets and network. Our dataset comprises activity from Twitter related to the 15M movement in Spain, which brewed for some time in several online social media, and mainly rised with the launch of the digital platform Democracia Real Ya (Real Democracy Now). Twitter and Facebook were utilized to organize a series of protests that took off on the 15th of May, 2011, when demonstrators camped in several cities [30, 31]. From that moment on, camps, demonstrations and protests spread throughout the country, and the 15M became a grassroots movement for additional citizen platforms and organizations. As many of the adherents are online social media users, the growth and stabilization of the movement was closely reflected in time-stamped data of twitter messages. Some of these tweets were extracted from the Twitter API according to a set of pre-selected keywords (see SI Table I), and the collection comprises messages exchanged from the 25th of April at 00:03:26 to the 26th of May at 23:59:55, 2011. The sample of tweets was filtered by the Spanish startup company Cierzo Development LTd., which exploits its own private SMMART (Social Media Marketing Analysis and Reporting Tool) platform, and therefore no further details are available. According to previous reports, the SMMART platform collects 1/3 of the total Twitter traffic. From the sample of tweets we obtained, the follower/following network is extracted: for the active users, i.e. those who posted at least one tweet in the sample collected, the set of followers is retrieved, and the resulting network is filtered to include only the active followers. The resulting network is composed of nodes that represent users, and edges with directionality corresponding to the information flow in Twitter. This way, if a user is a follower of user , there will be a directed link from to in the network.
Sentiment analysis. To detect the sentiment expressed in each tweet, we apply the Spanish adaptation of SentiStrength [15], a state-of-the-art sentiment analysis tool for short, informal messages from social media [22]. SentiStrength is used in a wide variety of applications, from the sentiment analysis of stock markets [32], to reactions to political campaigns [13], and interaction in different social networks [22]. We tailored SentiStrength to the Spanish language based on a sentiment corpus of more than tweets and evaluated it on an independent corpus of more than human-annotated tweets [23]. More details about our application of SentiStrength and the results of this evaluation can be found in the Supplementary Information. After sentiment detection, for each tweet , we have an emotion value associated with the tweet. if the tweet is positive with respect to its emotional charge, if the tweet is neutral, and if the tweet is negative. We abbreviate these as positive, neutral and negative tweets, always referring to their emotional charge.
Linguistic content analysis. We analyze the content of tweets based on frequencies of terms from the Linguistic Inquiry and Word Count lexicon (LIWC) [33]. This lexicon is a standard technique for psycholinguistics, including terms associated to affect, cognition, and social processes. LIWC has been used to predict suicides [34], and to analyze collective mood fluctuations [35]. For each tweet, we apply a simple dictionary detection technique based on the lemmas of the lexicon, stemming the tweets and detecting the use of terms in the LIWC classes of social and cognitive processes. This way, for each tweet we have two counts of social, , and cognitive, , terms as well as the amount of words, , in the tweet.
Cascade detection. Cascades in online networks may be defined in several ways with respect to the variety of online platforms, discussion topics, or interaction means between users. Here we adopt the definition first described in [31] which is based on time-constrained cascades. Time is discretized according to a window width, and tweets posted at consecutive time windows are considered to be part of the same piece of information if users emitting them show a follower/following relationship. Specifically, user posting the tweet at time must follow user sending the tweet at time . Previous works showed the robustness of cascade statistics for different time windows [30, 31]. Here we choose a hours-window to minimize the eventual correlations due to the effect of circadian activity in human online behavior. The content being sent is not required to be the same. This is motivated by three main facts: first, our sample, i.e., the set of tweets, has been previously filtered by topic, allowing us to safely assume that the information circulating is limited to a restricted topic, the 15M movement. Second, the 15M movement is a deliberative process, characterized by discussions and debates about the political and social situation of the country, the organization of protests and demonstrations, and conversations about the strategies to follow. Finally, Twitter is considered to be both a micro-blogging service and a message interchange service, as suggested by the high values of link reciprocity and the mention functionality. Time-constrained cascades allow to take into account these frequent situations in which people discuss about particular topics using their own words to express their ideas, rather than forwarding a restricted piece of information.
A cascade is then an ordered set of consecutive activities of a set of users having follower relations. This way we know who started the cascade and when, and the seed tweet triggering the cascade. We can additionally distinguish between activity cascades and information cascades. The first ones involve only the set of active users, i.e. those responding to the message, whereas information cascades also comprise listeners, i.e. users receiving the message but not participating in the discussion. We want to first investigate if the initial tweet determines the size of the cascade. For instance, one could argue that positive messages can trigger larger cascades, or vice versa, negative messages trigger a debate that can last over several time windows.
k-core centrality. The -core value is an individual measure of importance based on the core structure of the network. A -core is defined as the largest subnetwork comprising nodes of degree at least . Note that to compute this measure we consider the undirected network, i.e., we consider every link as if it was undirected, and therefore a node of degree is a node whose total degree is . The -core decomposition method assigns an integer number to every node in the network, obtained by a recursive pruning of their links. The procedure starts with isolated nodes, which are assigned a -core value . Then, nodes with degree are removed along with their links, and assigned . If any of the remaining nodes is left with connections it is also removed and contained in the core. The process continues with until every node has been assigned to a shell. This metric goes beyond degree, as it takes into account the centrality of the neighbors to define the centrality of a node.
200 tweet timeline data. An extended dataset of tweets from the participants was also extracted. It comprises the last 200 tweets (if available) posted by the set of active users. It consists of a sample of 15,411,025 tweets (see SI Table IV) retrieved the 20th of October, 2013.
Competing interests
The authors declare that they have no competing interests.
Author’s contributions
RA and YM gathered data; RA and DG analyzed the data; RA, DG, YM, FS designed research and wrote the article.
Acknowledgements
DG and FS acknowledge financial support by the Swiss National Science Foundation (CR21I1_146499). RA, FS, and YM acknowledge financial support by EU-FET project MULTIPLEX 317532.
References
- [1] Hughes, N.: Young people took to the streets and all of a sudden all of the political parties got old: The 15m movement in spain. Social Movement Studies 10(4), 407–413 (2011). doi:10.1080/14742837.2011.614109
- [2] Castañeda, E.: The indignados of spain: A precedent to occupy wall street. Social Movement Studies 11(3-4), 309–319 (2012). doi:10.1080/14742837.2012.708830
- [3] Zuckerman, E.: New media, new civics? Policy & Internet 6(2), 151–168 (2014). doi:10.1002/1944-2866.POI360
- [4] Tufekci, Z.: The medium and the movement: Digital tools, social movement politics, and the end of the free rider problem. Policy & Internet 6(2), 202–208 (2014). doi:10.1002/1944-2866.POI362
- [5] Herman, E.S., Chomsky, N.: Manufacturing Consent: The Political Economy of the Mass Media. Random House, London (2008)
- [6] Olson, M.: The Logic of Collective Action: Public Goods and the Theory of Groups. vol. 124. Harvard University Press, Cambridge, Massachusetts (2009)
- [7] Garcia, D., Zanetti, M.S., Schweitzer, F.: The role of emotions in contributors activity: A case study of the gentoo community. In: International Conference on Social Computing and Its Applications (2013). doi:10.1109/CGC.2013.71
- [8] Mavrodiev, P., Tessone, C.J., Schweitzer, F.: Quantifying the effects of social influence. Scientific Reports 3(1360) (2013). doi:10.1038/srep01360
- [9] Durkheim, E.: The Elementary Forms of the Religious Life. George Allen & Unwin, London (1915)
- [10] Atkinson, Q.D., Whitehouse, H.: The cultural morphospace of ritual form: Examining modes of religiosity cross-culturally. Evolution and Human Behavior 32(1), 50–62 (2011)
- [11] Páez, D., Rimé, B.: Collective emotional gatherings: their impact upon identity fusion, shared beliefs, and social integration. In: Von Scheve, C., Salmela, M. (eds.) Collective Emotions. Oxford University Press, Oxford (2013)
- [12] Páez, D., Javaloy, F., Wlodarczyk, A., Espelt, E., Rimé, B.: The 15-m movement: Actions as rituals, social sharing, beliefs, values and emotions. Revista de Psicología Social 28(1), 19–33 (2013)
- [13] Garcia, D., Mendez, F., Serdult, U., Schweitzer, F.: Political polarization and popularity in online participatory media : An integrated approach. In: Proceedings of the First Edition Workshop on Politics, Elections and Data - PLEAD ’12, pp. 3–10 (2012). doi:10.1145/2389661.2389665
- [14] Conover, M.D., Gonçalves, B., Ratkiewicz, J., Flammini, A., Menczer, F.: Predicting the political alignment of twitter users. In: Privacy, Security, Risk and Trust (passat), 2011 Ieee Third International Conference on and 2011 Ieee Third International Conference on Social Computing (socialcom), pp. 192–199 (2011). IEEE
- [15] Garcia, D., Thelwall, M.: Political alignment and emotional expression in spanish tweets. In: Workshop on Sentiment Analysis at SEPLN, pp. 151–159 (2013)
- [16] Kitsak, M., Gallos, L.K., Havlin, S., Liljeros, F., Muchnik, L., Stanley, H.E., Makse, H.A.: Identification of influential spreaders in complex networks. Nature Physics 6(11), 888–893 (2010)
- [17] Baños, R., Borge-Holthoefer, J., Moreno, Y.: The role of hidden influentials in the diffusion of online information cascades. EPJ Data Science 2(1), 1–16 (2013). doi:10.1140/epjds18
- [18] Garcia, D., Mavrodiev, P., Schweitzer, F.: Social resilience in online communities: The autopsy of friendster. In: 1st ACM Conference in Online Social Networks (COSN’13), http://dx.doi.org/10.1145/2512938.2512946, pp. 39–50 (2013). doi:10.1145/2512938.2512946. http://dl.acm.org/citation.cfm?id=2512946
- [19] Garas, A., Garcia, D., Skowron, M., Schweitzer, F.: Emotional persistence in online chatting communities. Scientific Reports 2, 402 (2012). doi:10.1038/srep00402
- [20] Šuvakov, M., Mitrović, M., Gligorijević, V., Tadić, B.: How the online social networks are used: dialogues-based structure of myspace. Journal of The Royal Society Interface 10(79) (2013). doi:10.1098/rsif.2012.0819
- [21] Bollen, J., Gonçalves, B., Ruan, G., Mao, H.: Happiness is assortative in online social networks. Artificial life 17(3), 237–251 (2011)
- [22] Thelwall, M., Buckley, K., Paltoglou, G., Skowron, M., Garcia, D., Gobron, S., Ahn, J., Kappas, A., Kuster, D., Janusz, A.: Damping sentiment analysis in online communication: Discussions, monologs and dialogs. In: Computational Linguistics and Intelligent Text Processing(Lecture Notes in Computer Science), vol. 7817, pp. 1–12 (2013)
- [23] Díaz Esteban, A., Alegría, I., Villena Román, J.: Proceedings of the TASS Workshop at SEPLN 2013. Actas del XXIX Congreso de la Sociedad Española de Procesamiento de Lenguaje Natural. IV Congreso Español de Informática. SEPLN, http://www.congresocedi.es/images/site/actas/ActasSEPLN.pdf (2013)
- [24] Pfitzner, R., Garas, A., Schweitzer, F.: Emotional divergence influences information spreading in twitter. In: The 6th International AAAI Conference on Weblogs and Social Media, pp. 2–5. The AAAI Press, http://www.aaai.org/ocs/index.php/ICWSM/ICWSM12/paper/view/4596 (2012)
- [25] Clauset, A., Shalizi, C.R., Newman, M.E.: Power-law distributions in empirical data. SIAM review 51(4), 661–703 (2009)
- [26] Newman, M.: Power laws, pareto distributions and zipf’s law. Contemporary Physics 46(5), 323–351 (2005). doi:10.1080/00107510500052444
- [27] Alstott, J., Bullmore, E., Plenz, D.: powerlaw: A python package for analysis of heavy-tailed distributions. PLoS ONE 9(4), 95816 (2014)
- [28] Fowler, J.H., Christakis, N.A., et al.: Dynamic spread of happiness in a large social network: longitudinal analysis over 20 years in the framingham heart study. Bmj 337, 2338 (2008)
- [29] Christophe, V., Rime, B.: Exposure to the social sharing of emotion: Emotional impact, listener responses and secondary social sharing. European Journal of Social Psychology 27(1), 37–54 (1997)
- [30] González-Bailón, S., Borge-Holthoefer, J., Rivero, A., Moreno, Y.: The dyanmics of protest recruitment through an online network. Scientific Reports 1(197) (2011)
- [31] Borge-Holthoefer, J., Rivero, A., Moreno, Y.: Locating priviledged spreaders on an online social network. Physical Review E 85(066123) (2012)
- [32] Zheludev, I., Smith, R., Aste, T.: When can social media lead financial markets? Scientific reports 4 (2014)
- [33] Chung, C.K., Pennebaker, J.W.: Linguistic inquiry and word count (liwc): Pronounced “luke,”… and. Applied Natural Language Processing and Content Analysis: Advances in Identification, Investigation and Resolution, 206 (2011)
- [34] Stirman, S.W., Pennebaker, J.W.: Word use in the poetry of suicidal and nonsuicidal poets. Psychosomatic Medicine 63(4), 517–522 (2001)
- [35] Golder, S.A., Macy, M.W.: Diurnal and seasonal mood vary with work, sleep, and daylength across diverse cultures. Science 333(6051), 1878–1881 (2011)