Dust Dynamics in Protoplanetary Disk Winds Driven by Magneto-Rotational Turbulence: A Mechanism for Floating Dust Grains with Characteristic Sizes
Abstract
We investigate the dynamics of dust grains with various sizes in protoplanetary disk winds driven by magnetorotational turbulence, by simulating the time evolution of the dust grain distribution in the vertical direction. Small dust grains, which are well coupled to the gas, are dragged upward with the up-flowing gas, while large grains remain near the midplane of a disk. Intermediate–size grains float near the sonic point of the disk wind located at several scale heights from the midplane, where the grains are loosely coupled to the background gas. For the minimum mass solar nebula at 1 AU, dust grains with size of 25 – 45 float around 4 scale heights from the midplane. Considering the dependence on the distance from the central star, smaller-size grains remain only in an outer region of the disk, while larger-size grains are distributed in a broader region. We also discuss the implication of our result to the observation of dusty material around young stellar objects.
Subject headings:
accretion, accretion disks – dust, extinction – ISM: jets and outflows – planets and satellites: formation – protoplanetary disks – stars: pre-main sequence1. Introduction
Protoplanetary disks are believed to be the birth place of planets (e.g., Safronov, 1972; Hayashi et al., 1976, 1985; Cameron, 1978), and have been extensively studied from both theoretical and observational sides (e.g., Armitage, 2011, and references therein). One of the major unknowns in the evolution of protoplanetary disks is the dispersal mechanism at the final stage. From near infrared observations the typical dissipation time of protoplanetary disks is inferred to be yr (Haisch et al., 2001; Hernández et al., 2008; Yasui et al., 2009; Takagi et al., 2014, 2015). The photoevaporating wind by UV(e.g., Hollenbach et al., 1994; Alexander et al., 2006) and X-ray (e.g. Ercolano et al., 2008) emissions from a central star has been extensively investigated. The disk wind driven by magneto-turbulence, which is the magneto-rotational instability (MRI hereafter; Velikhov, 1959; Chandrasekhar, 1961; Balbus & Hawley, 1991) in a disk, is also proposed as a cooperating process or a powerful alternative in dispersing the gaseous component (Suzuki & Inutsuka, 2009).
In order to promote the mass accretion by the transport of the angular momentum in a protoplanetary disk (Lynden-Bell & Pringle, 1974), the gas has to be in a turbulent state at least in some portions of the disk to keep the effective turbulent viscosity since the microscopic viscosity is negligible. Among various mechanisms, MRI is supposed to be a promising candidate to excite such turbulence. Suzuki & Inutsuka (2009) showed that the MRI- driven turbulence inevitably induces vertical outflows by the Poynting flux of the magnetohydrodynamical turbulence (see also Miller & Stone, 2000), and such disk winds potentially contribute to the dispersal of the gas component of protoplanetary disks (Suzuki et al., 2010), whereas this processes has been extended (Ogilvie, 2012; Bai & Stone, 2013a; Lesur et al., 2013) and the quantitative mass flux carried by the disk wind is still under debate (Fromang et al., 2013).
A spectro-astrometric survey of protoplanetary disks by Pontoppidan et al. (2011) showed non-Keplerian motions that are consistent with wide-angle disk winds, in addition to the component of Keplerian rotation. This might be an indirect evidence of such MRI turbulence-driven vertical outflows. Natta et al. (2014) also reported the observations of slow gaseous outflows with a few km s-1 from protoplanetary disks around T-Tauri stars. Ellerbroek et al. (2014) observed time-variable optical fadings and infrared brightenings, which is supposed to reflect dust grains lifted up high above the disk midplane by a slow wind. Measurement of hydrogen atoms toward young stars show the absorption of the Lyman- band in excess of that is inferred from the circumstellar extinction (McJunkin et al., 2014), which may be also caused by dust grains stirred up to the upper layers. Near-infrared imaging of RY Tau suggested that the disk could have an optically thin and geometrically thick layer above the disk surface (Takami et al., 2013), which may reflect dust grains floating at the upper atmosphere.
The dynamics of dust grains in the MRI turbulence-driven disk winds should be potentially interesting in the context of planetesimal formation but have not been studied yet. In this paper, we investigate the time evolution of the vertical distribution of dust grains with various sizes in the disk wind by simple one-dimensional (1D) simulations.
2. Model
We compute the time evolution of the vertical profile of dust density (Section 2.1) under a fixed background gas component (Section 2.2) in a (1D) vertical box from to , where is the pressure scale height derived from the sound speed, , and the Keplerian rotation frequency, . In order to avoid unphysical effects at the boundaries, we set up an extra region outside the top and bottom boundary, and at the outflow boundary condition is prescribed. As the initial condition, all the dust grains are sedimented at the midplane, , and the total mass of the dust in the computational domain is 1/100 of the total mass of the gas. We use the normalization of and , which gives .
2.1. Dust Component
Dust grains are treated as “pressure-less fluid” in a fixed background gas distribution that is modeled in Section 2.2, namely drag force is exerted on the dust fluid from the background gas component, but the back reaction from the dust to the gas is not taken into account. In this work, we consider dust grains of which size is smaller than a mean free path of the gas. In this case, the gas drag force is in the Epstein’s regime (Adachi et al., 1976; Sekiya, 1983; Paardekooper, 2007). For example, in the minimum mass solar nebula (MMSN hereafter; Hayashi, 1981), the mean free path is 1 cm for distance AU from the central star (Nakagawa et al., 1986); the dust grains we consider here is smaller than this value. Then, the drag force is written as (Schaaf, 1963)
| (1) | |||||
where is the gas density, is the size of a dust grain, is the mean thermal velocity (Takeuchi & Lin, 2002), is the relative velocity of dust to gas and is Mach number of the relative flow, . Equation (1) has the following asymptotic behavior (Adachi et al., 1976; Paardekooper, 2007),
| (2) |
In the small limit, the drag force is from stochastic collision by randomly moving gas particles, and thus, the collision rate is proportional to the thermal velocity, which gives the dependence of on . On the other hand, in the large limit, the dominant factor that determines the collision rate is the relative velocity between dust and gas. Therefore, the dependence on in the drag force for the small limit is replaced by the dependence on for large . In this work, instead of using Equation (1), we adopt a simplified formula that interpolates between these limits (Kwok, 1975; Paardekooper, 2007),
| (3) |
where
| (4) |
The stopping time for the gas drag is defined as , where is the mass of a dust grain. is a time scale for the decay of the relative velocity between the dust and the gas. By normalizing with , we define the nondimensional stopping time, . In this paper we assume that the dust grains have spherical shape with homogeneous internal density, . Since the mass of a dust grain is , then the nondimensional stopping time is rewritten as
| (5) |
For later discussion, we evaluate at the midplane of the MMSN. The relative velocity of dust to gas is much smaller than the sound speed around the midplane. Therefore, the nondimensional stopping time, , at the midplane is
| (6) | |||||
where we adopt in this work (Youdin & Lithwick, 2007), and subscripts “mid” and “1AU” denote that the values are evaluated at the midplane and at AU, respectively. Here, we use, in addition to the relation for the Keplerian rotation, , the scalings for the density at the midplane and the sound velocity of the MMSN (Hayashi, 1981; Sano et al., 2000): with g cm-3 and with km s-1. The nondimensional stopping time, , measures whether dust grains are tightly () or weakly () coupled to the background gaseous flow.
The velocity of dust fluid is subject to the following momentum equation (Takeuchi & Lin, 2002):
| (7) |
where and are the vertical velocity of dust and gas. The first term is the vertical component of the gravitational force by the central star, the second term denotes the gas drag force on the dust from the mean gas flow, and the third term represents turbulent diffusion. is the mass flux due to turbulent diffusion and modeled as
| (8) |
(Takeuchi & Lin, 2002), where is effective kinetic viscosity of gas and expressed as with parameter (Shakura & Sunyaev, 1973). Here, we adopt a constant in the entire calculation region for simplicity. The value of controls the timescale of the upward diffusion of grains that are located initially at to the wind region, . However, the final profile of in the quasi-steady state does not depend on provided that is finite, although smaller requires longer time to achieve the quasi-steady state. The Schmidt number Sc is a ratio of gas and dust diffusion coefficients, , which represents the strength of the coupling between the gas and the dust. For small grains, Sc approaches unity so that the grains have the same diffusivity as the gas, while it becomes infinite for large grains. For intermediate grains, it is (Youdin & Lithwick, 2007). In this paper, we use , because smaller grains with are tightly coupled to the gas. Therefore, the steady state condition is achieved for the dust, and the dust velocity reaches terminal velocity. Thus, applying the time-steady condition () to Equation (7), we have
| (9) |
In addition, by substituting Equation (9) into the continuity equation of dust, , we obtain
| (10) |
where we separate the dust velocity into the mean flow,
| (11) |
and the diffusion component, .
By solving Equation (10), we follow the time evolution of the vertical distribution of the dust fluid.
2.2. Gas Component
We adopt the result of the three-dimensional (3D) MHD simulation in a local shearing box by Suzuki & Inutsuka (2009) for the fixed background gas component. In order to incorporate it into our vertical 1D calculation, the time- and horizontal plane-average is taken for .
Since our computation region, , is larger than the region, , of that 3D simulation, we have to extrapolate and to . To do so, we derive an analytic expression that fits to the profile of the 3D simulation:
| (12) |
By this fitting formula, we bound the flow velocity in the high-altitude region in order to avoid unrealistically high-speed flows.
As for the density distribution, we adopt the following procedure. In , we use the hydrostatic density structure, , which well explains the 3D MHD simulation. In , the 3D simulation shows that the mass flux is constant with . Then, we derive from Equation (12) to give the constant . We linearly connect these two regions between and . Reflecting that approaches in the upper regions, , the density is also bounded by in these regions. Figure 1 presents the derived density and velocity of the gas component.

3. Results
3.1. Time evolution
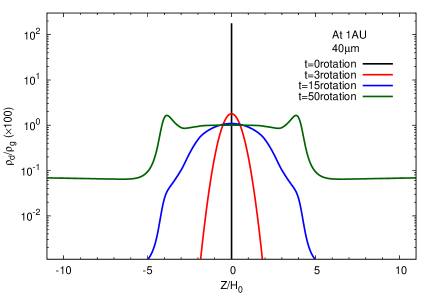
Figure 2 demonstrates the time evolution of dust density, , for a single grain size, m, at AU of the MMSN, or The figure clearly exhibits the dust grains initially located at the midplane are stirred upward with time. After approximately three rotations (red line), the dust grains are diffused by the turbulence up to where the disk winds launch. Around rotations (blue line), the local peaks of the dust-to-gas ratio gradually form at . The locations of the peaks approximately correspond to the sonic points of the background gaseous disk wind where the drag force switches from the small regime to the large regime (Equation 2; see Section 3.2 for more details). The location of the peaks depends sensitively on the size of dust grains. Although in this paper we assume the spherical shape and the uniform solid density for grains, it also depends on the properties of dust in realistic situations. The dust-to-gas ratio further increases with time, and it saturates after rotations (green line) to be in the quasi-steady state. The region inside the peaks, the dust-to-gas ratio approaches the volumetric average value because of the well coupling between the gas and the dust. We continue the simulation further up to 200 rotations to study the quasi-steady-state behavior, which we discuss in the subsequent sections.
3.2. Dependence on Grain Size
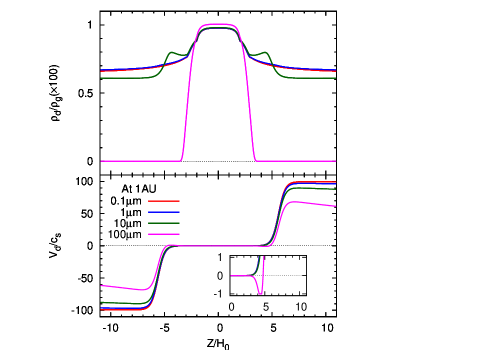
We examine the dependence of the vertical dust distribution on grain size, , or stopping time, . Figure 3 presents the time-averaged steady-state vertical profile of the dust-to-gas ratio (top panels) and the mean flow velocity of the dust, , (Equation (11); bottom panels) for different stopping times. The left panels show the cases with , , , and , which respectively correspond to the grain size of 0.1, 1, 10, and 100 m at 1 AU of the MMSN.
|
In the region around the midplane, , the dust-to-gas ratio is consistent with the volumetric average value, , which is independent from , because the dust is strongly coupled with the gas. However, the value of depends largely on in the high-latitude regions, since the coupling is weaken (the local increases) owing to the decrease of the gas density with elevating height. The dust with the small grain size, , is well coupled to the gas in the entire simulation domain, and is blown upward with the vertical outflows of the gas. On the other hand, the dust with the large grain size, , remains in the disk. The velocity of the mean dust flow, , in the wind region is faster for a smaller grain size (smaller ) owing to the well coupling to the gas. In the case with the largest grain size, , is directed to the midplane, which is however compensated for by the diffusion, in Equation (7). Small grains escape from the simulation domain, which leads to the loss of the total mass of the dust. However, the mass loss is almost negligible during the simulation time, rotations, and then, it is reasonable to treat the system is in the quasi-steady state even for the well-coupled small grains.
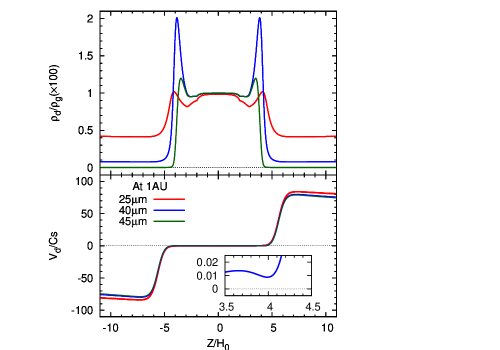
Among the four cases, the dust-to-gas ratio of the case with shows peculiar behavior; increases with an altitude in the high-altitude layers, . On the other hand, the dust remains in the disk and in the high-altitude layers of the case with . In the right panels of Figure 3, we focus on grain sizes with , which lie between these two cases. One can see the peaks of near in these cases (right top panel), which indicates that the dust grains float up to the location around the peaks and stagnate there. The emergence of the peaks can be explained for dust grains of in the following.
The inset of the bottom right panel of Figure 3 zooms in the dust velocity, , near the location of the peak in the positive side. slightly decreases from to , and shows a local minimum at , which almost coincides with the sonic point at of the gaseous disk wind. A quasi-steady state is achieved in the simulation, and thus, const. Therefore, the local minimum of leads to a local maximum of ; dust grains stagnate around this location.
The non-monotonic behavior of can be explained by the variation of the upward drag force against the downward gravity. Below the location of the peak at , the velocity of the gaseous disk wind is still subsonic, . The relative velocity, , of the dust to the gas is also , and the drag force is in the small regime in Equation (2). Therefore, (Equation 4), and increases with height because of the decrease of :
| (13) |
where we normalize with the gas density, at the location, , of the local minimum . In , the coupling between the gas and the dust is lessened with an increasing height. Therefore, the downward gravity gradually dominates the upward gas drag force, which causes the deceleration of in .
However, rapidly increases beyond . The relative velocity, , of the dust to the gas exceeds beyond the sonic point of located at . Then, the drag force switches to the large regime in Equation (2). In the large limit, (Equation 4), which gives const. (Equation 5), where we here assume . This shows that , and therefore , does not increase (the coupling between gas and dust is not weaken), with an increasing altitude in the large regime. As a result, the upward gas drag force increases with the increasing (the 2nd term of Equation 7) and dominates the downward gravity (the 1st term of Equation 7, which gives the rapid acceleration of in .
As explained above, the local peaks of the ratio emerges when dust grains satisfy the condition that they are loosely coupled () to the background gas near the sonic point of the disk wind. By calculating many cases with different stopping times, the range of that gives peaks is
| (14) |
Smaller grains escape from the simulation domain, because they are well coupled to the gas flow even near the sonic point. Larger grains remain in the subsonic region of the disk wind because they cannot be lifted up beyond the sonic point where the effective drag force in the large regime could act. Therefore, dust grains outside the range of Equation (14) do not show local peaks.
3.3. Radial dependence
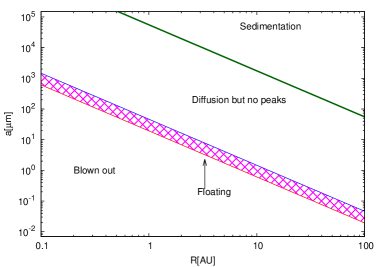
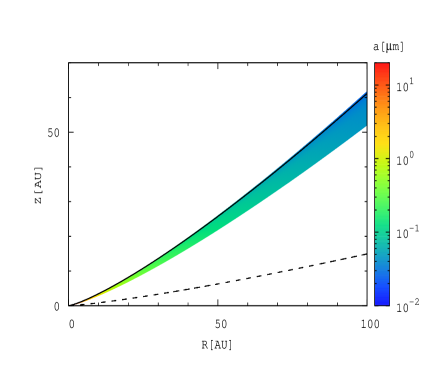
The result based on the local vertical box (Figure 3) has shown that the behavior of the dust is determined by the nondimensional stopping time, , at the midplane. Therefore, once we specify the radial dependence, we can determine the dust properties in an plane. For illustrative purpose, we adopt the MMSN (see Equation 6 and below), and show the basic character of the vertical motions of dust grains as a function of the size and the distance from the central star in Figure 4. The pink hatched region in the top panel indicates the radial dependence of the size, , of the dust grains that floats in the high-altitude layers with the peaks. Reflecting the dependence of (Equation 6), the size of the floating dust grains is smaller for larger distance,
| (15) |
The dust grains above the pink hatched region basically remain in the disk, while those below the pink hatch are blown upward with the vertical gas flow.
The bottom panel of Figure 4 illustrates the pink hatched region in the top panel in an plane. This panel clearly shows that dust grains are floating in a narrow range near or slightly below the sonic point of the background gaseous disk wind. The size of the floating grains decreases for larger . Smaller-size grains remain only in an outer region of the disk, while larger-size grains are distributed in a broader region. For instance, grains with m remain in AU, while grains with m remain in AU. If we consider the time-evolution of a protoplanetary disk, the dispersal of the dust begins with small-size grains
If we focus on dust grains with a certain size, say m, they are blown away by the vertical gas outflow in the inner region, AU, and remain in the disk in the outer region, AU. Therefore, we expect that the evacuation of dust grains is expected to occur in an inside-out manner, which is qualitatively similar to the evolution of the gas component driven by the disk wind (Suzuki et al., 2010).
4. DISCUSSION
4.1. Effect of Reduced Mass Flux of the Disk Wind
In this paper we use a simple model that adopts the time- and horizontal-plane-averaged gas density and velocity derived from the local 3D shearing box simulation solving ideal MHD equations (Suzuki & Inutsuka, 2009) for the background flow.
However, there is uncertainty in the mass flux of disk winds calculated by shearing box simulations. In particular, the outflow mass flux shows an decreasing trend on an increasing vertical box size (Suzuki et al., 2010; Fromang et al., 2013), which implies that the mass flux of the disk wind we have used so far might overestimates an actual value. Therefore, we here check how the distribution of the dust is modified when the outflow mass flux of the gas is smaller. In comparison to the original setup, which we call “Model 1” hereafter, we adopt 10 times smaller vertical mass flux of the gas component, , in “Model 2”, by reducing by 1/10 in the wind region (Figure 5) but leaving unchanged.
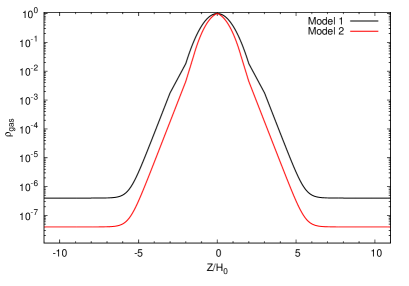
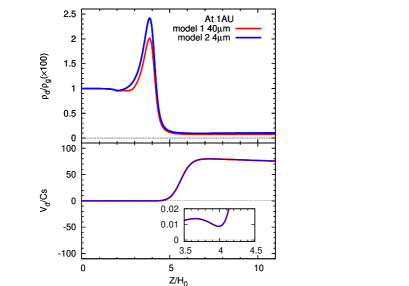
Figure 6 presents the time-averaged steady-state vertical profile of the dust-to-gas ratio (top panel) and the mean flow velocity of the dust, , (bottom panel) of Model 2 in comparison to those of Model 1. The gas density of Model 2 is 1/10 of that of Model 1 in the supersonic region. Since (Equation 5), it is expected that in Model 2 dust grains with smaller at the midplane will give similar results to Model 1 in the supersonic region. Therefore, we adopt in Model 2, which is 1/10 of of Model 1, whereas and correspond to the grain size of m and m at AU of the MMSN, respectively.
Figure 6 shows that the velocity profiles of these two cases are almost the same, and so are the locations of the peaks. This indicates that the dust floating by the stagnation of upflowing grains is a robust feature in a qualitative sense even though the mass flux of the gaseous disk wind might be reduced, whereas the size of floating dust grains is smaller for smaller mass flux of the disk wind. Model 2 shows larger in the subsonic region, , because the gas density of Model 2 there is not as low as 1/10 of that of Model 1. Thus, in the subsonic region of Model 2 is smaller than of Model 1, and a larger amount of dust grains are lifted up by more efficient coupling to the gas.
4.2. Limitations
In the previous subsection, we have discussed the uncertainty of the wind mass flux in the local shearing box approximation. In addition to this, the configuration of large-scale magnetic field is another effect which cannot be taken into account in the local treatment. Gas flows along large-scale magnetic field lines, and the mass conservation should follow const. in realistic situations, where is poloidal magnetic field. Thus, the mass flux, , would probably decreases as the magnetic flux tube expands with altitude, and hence decreases. As a result, the location and detailed shape of peaks might be modified in such situations. However, the physical mechanism that forms a peak near the sonic point of vertical upflows (Section 3) is robust in a qualitative sense.
In this paper, we have assumed the steady-state condition for the background gaseous flows. In reality, however, the disk wind is intermittent with quasi-periodicity of 5-10 rotations (Suzuki & Inutsuka, 2009, 2014). We need to take into account effects of time-dependent vertical upflows on dust grains in more detailed studies (Turner et al., 2010).
The strong coupling approximation adopted in this paper (Equation 9) is basically acceptable for floating dust grains because is kept less than unity near and above the location where they are floating (Section 3). However, if time-dependent vertical upflows were taken into account, grains with might appear locally in a transient manner. For those grains, it is necessary to solve the time-dependent equation of motion (Equation 7).
We treat dust grains as test particles, because we start the simulations from the total dust-to-gas ratio , and the condition, , is satisfied in the throughout the simulations. However, when we consider the depletion of the gas component at later evolutionary stages, might exceeds unity especially near the peak location. In order to treat the long-time evolution of protoplanetary disks, the backreaction from the dust on the gas (e.g., Johansen & Klahr, 2005)
We use the result of the ideal MHD simulation, namely we do not consider the effect of an MRI-inactive region (“dead zone”; e.g., Gammie, 1996). If the effects of non-ideal MHD are taken into account, the turbulence strength, , would be smaller than the adopted value, , and thus it takes time for grains at the midplane at the beginning of the calculations to diffuse upward (see Section 2.1). After the quasi-steady state is achieved, however, a possible existence of dead zone would not change our result on floating dust grains at least in a qualitative sense, because the disk wind is driven from the MRI-active region near the surface where the sufficient ionization is attained. For instance, Suzuki et al. (2010) demonstrated that the mass flux of the disk wind is weaken by half for a typical case with a dead zone. Recent simulations that include various non-ideal MHD effects also show that magnetically driven winds are launched in spite of the strong magnetic diffusion (e.g., Bai & Stone, 2013b; Gressel et al., 2015). Although the size of floating grains might be smaller than that predicted from our results based on the ideal MHD simulations, floating dust grains would be a robust feature even if non-ideal MHD effects were considered.
When we consider dust grains with m at AU, the dispersal timescale is yrs, which is much shorter than the typical lifetime of protoplanetary disks, yrs (Haisch et al., 2001). The main reason of this discrepancy is that the effect of the radial accretion cannot be taken into account in the local box. In realistic situations, dust grains would be supplied from the outer region and the actual dispersal time would be much longer. Suzuki et al. (2010) have done such similar calculations for the gas component and showed that the dispersal of the disk gradually takes place with timescale of yrs even though the dispersal time at AU is yrs in the local treatment. The similar argument is applicable to the dust component, and we expect that the dispersal timescale of small dust grains will turn out to be a reasonable value in a global model.
Since we have restricted our calculations to those in the local vertical box in this paper, local concentrations of floating dust grains are formed by the combination of the vertical component of the gravity and the drag force. In realistic situations, however, the direction of the flow, the gravity, and the drag force are not generally coaligned each other. In such circumstances, upflowing grains could play a role in large-scale circulation of the dust in protoplanetary disks. The disk wind of the gas component is probably accelerated by magneto-centrifugal force to the radially outward direction (e.g., Blandford & Payne, 1982). Dust grains that are well coupled to the gas are uplifted and transported to larger along large-scale magnetic field by such gaseous upward and outward flows. Eventually, the ambient gas density decreases as the magnetic flux tube expands with altitude, which makes the coupling to the gas weaken to give . Those grains will settle down to the midplane by the vertical component of the central-star gravity without sufficient gas drag force in such a distant region. Outflows are expected to blown out intermittently (Suzuki & Inutsuka, 2009), and hence, dust grains are lifted up and settled down in a time-dependent manner in realistic situations, rather than the formation of time-steady local peaks discussed in the previous sections. The dust grains settled down at larger r further accrete inward, being coupled to the accreting gas. Dust grains are also supposed to grow through this large-scale circulation (Shu et al., 1996).
4.3. Observational Implications
Finally we discuss observational implications of floating dust in protoplanetary disks. McJunkin et al. (2014) estimated the column densities of neutral hydrogen around many T-Tauri Stars and Herbig Ae/Be stars by the circumstellar adsorptions of the Lyman- emissions from the central stars. The column densities derived from Lyman- absorption are smaller than the values derived from the dust extinction measurements. A possibility of a high dust-to-gas ratio in the upper-atmosphere of the protoplanetary disks was proposed as a possible solution to the discrepancies. Ellerbroek et al. (2014) observed outflows/winds from a Herbig Ae star. The object shows variability where optical fading events are correlated with near-infrared brightening, which implies that a sizable amount of the dust grains are contained in the variable outflows/winds. The mechanism studied in this paper may provide an explanation for existence of those dusty materials in upper atmospheres of protoplanetary disks.
Also, the scattered light image in circumstellar environment of RY Tau by near-infrared coronagraphic imaging polarimetry indicated that the observed polarized intensity distribution shows a butterfly-like distribution as shown by the observation at millimeter wavelengths (Takami et al., 2013). They performed comparison between the observed polarized intensity distribution and models consisting of gaseous disk and dust. The result suggests the scattered light in the near-infrared is associated with an optically thin and geometrically thick layer at an upper layer. This phenomenon could be explained by the dust grains lifted up by the disk wind. In our future studies, we plan to create pseudo observational images (e.g., Takami et al., 2014) based on a theoretical model for floating dust grains.
5. SUMMARY
We have studied the dynamics of dust grains in the protoplanetary disk winds driven by the MRI-triggered turbulence. Our calculation in the 1D vertical box has shown that the intermediate-size dust grains with float at about 4 scale heights from the midplane. This location corresponds to the sonic point of the background gaseous disk wind, where the drag force from the gas to the dust changes from the small relative velocity regime to the large relative velocity regime. The size of the floating dust grains depends on the distance from the central star; if we take the MMSN for example, we have size of floating dust, ; smaller grains float at larger . The dust grains with the smaller size than that of the floating ones are well coupled to the bulk gas flow and continue to stream out of the simulation domain, while the larger dust grains remain in the disk; this mechanism selectively disperses small grains in an inside-out manner and leaves large grains in protoplanetary disks.
One of the interesting findings in this paper is the characteristic size of the dust grains floating and stagnating at an upper atmosphere of the protoplanetary disk. The size range of those grains is a function of the distance from the central star, i.e., and appears to be relatively narrow as shown in the top panel of Figure 4. Future observations of the emission and/or absorption by those floating dust grains may provide information about the typical size of those grains; i.e., the detection of a dust floating layer may immediately enable us to determine the size of those particles. Combining with the possible observations of the disk temperature , i.e., and density, we will be able to constrain the mass flux of bulk flow, , which is difficult to observe directly. This may provide important observational diagnostics on the dispersal timescale of individual protoplanetary disks.
References
- Adachi et al. (1976) Adachi, I., Hayashi, C., & Nakazawa, K. 1976, Progress of Theoretical Physics, 56, 1756
- Alexander et al. (2006) Alexander, R. D., Clarke, C. J., & Pringle, J. E. 2006, MNRAS, 369, 229
- Armitage (2011) Armitage, P. J. 2011, ARA&A, 49, 195
- Bai & Stone (2013a) Bai, X.-N., & Stone, J. M. 2013a, ApJ, 767, 30
- Bai & Stone (2013b) —. 2013b, ApJ, 769, 76
- Balbus & Hawley (1991) Balbus, S. A., & Hawley, J. F. 1991, ApJ, 376, 214
- Blandford & Payne (1982) Blandford, R. D., & Payne, D. G. 1982, MNRAS, 199, 883
- Cameron (1978) Cameron, A. G. W. 1978, Moon and Planets, 18, 5
- Chandrasekhar (1961) Chandrasekhar, S. 1961, Hydrodynamic and hydromagnetic stability (Oxford: Clarendon)
- Ellerbroek et al. (2014) Ellerbroek, L. E., Podio, L., Dougados, C., et al. 2014, A&A, 563, A87
- Ercolano et al. (2008) Ercolano, B., Drake, J. J., Raymond, J. C., & Clarke, C. C. 2008, ApJ, 688, 398
- Fromang et al. (2013) Fromang, S., Latter, H., Lesur, G., & Ogilvie, G. I. 2013, A&A, 552, A71
- Gammie (1996) Gammie, C. F. 1996, ApJ, 457, 355
- Gressel et al. (2015) Gressel, O., Turner, N. J., Nelson, R. P., & McNally, C. P. 2015, ApJ, 801, 84
- Haisch et al. (2001) Haisch, Jr., K. E., Lada, E. A., & Lada, C. J. 2001, ApJ, 553, L153
- Hayashi (1981) Hayashi, C. 1981, Progress of Theoretical Physics Supplement, 70, 35
- Hayashi et al. (1976) Hayashi, C., Adachi, I., & Nakazawa, K. 1976, Progress of Theoretical Physics, 55, 945
- Hayashi et al. (1985) Hayashi, C., Nakazawa, K., & Nakagawa, Y. 1985, in Protostars and Planets II, ed. D. C. Black & M. S. Matthews, 1100–1153
- Hernández et al. (2008) Hernández, J., Hartmann, L., Calvet, N., et al. 2008, ApJ, 686, 1195
- Hollenbach et al. (1994) Hollenbach, D., Johnstone, D., Lizano, S., & Shu, F. 1994, ApJ, 428, 654
- Johansen & Klahr (2005) Johansen, A., & Klahr, H. 2005, ApJ, 634, 1353
- Kwok (1975) Kwok, S. 1975, ApJ, 198, 583
- Lesur et al. (2013) Lesur, G., Ferreira, J., & Ogilvie, G. I. 2013, A&A, 550, A61
- Lynden-Bell & Pringle (1974) Lynden-Bell, D., & Pringle, J. E. 1974, MNRAS, 168, 603
- McJunkin et al. (2014) McJunkin, M., France, K., Schneider, P. C., et al. 2014, ApJ, 780, 150
- Miller & Stone (2000) Miller, K. A., & Stone, J. M. 2000, ApJ, 534, 398
- Nakagawa et al. (1986) Nakagawa, Y., Sekiya, M., & Hayashi, C. 1986, Icarus, 67, 375
- Natta et al. (2014) Natta, A., Testi, L., Alcalá, J. M., et al. 2014, A&A, 569, A5
- Ogilvie (2012) Ogilvie, G. I. 2012, MNRAS, 423, 1318
- Paardekooper (2007) Paardekooper, S.-J. 2007, A&A, 462, 355
- Pontoppidan et al. (2011) Pontoppidan, K. M., Blake, G. A., & Smette, A. 2011, ApJ, 733, 84
- Safronov (1972) Safronov, V. S. 1972, Evolution of the protoplanetary cloud and formation of the earth and planets.
- Sano et al. (2000) Sano, T., Miyama, S. M., Umebayashi, T., & Nakano, T. 2000, ApJ, 543, 486
- Schaaf (1963) Schaaf, S. A. 1963, Mechanics of Rarefiel Gases (Springer-Verlag, Berlin)
- Sekiya (1983) Sekiya, M. 1983, Progress of Theoretical Physics, 69, 1116
- Shakura & Sunyaev (1973) Shakura, N. I., & Sunyaev, R. A. 1973, A&A, 24, 337
- Shu et al. (1996) Shu, F. H., Shang, H., & Lee, T. 1996, Science, 271, 1545
- Suzuki & Inutsuka (2009) Suzuki, T. K., & Inutsuka, S.-i. 2009, ApJ, 691, L49
- Suzuki & Inutsuka (2014) —. 2014, ApJ, 784, 121
- Suzuki et al. (2010) Suzuki, T. K., Muto, T., & Inutsuka, S.-i. 2010, ApJ, 718, 1289
- Takagi et al. (2015) Takagi, Y., Itoh, Y., Arai, A., Sai, S., & Oasa, Y. 2015, submitted to PASJ
- Takagi et al. (2014) Takagi, Y., Itoh, Y., & Oasa, Y. 2014, PASJ, 66, 88
- Takami et al. (2013) Takami, M., Karr, J. L., Hashimoto, J., et al. 2013, ApJ, 772, 145
- Takami et al. (2014) Takami, M., Hasegawa, Y., Muto, T., et al. 2014, ApJ, 795, 71
- Takeuchi & Lin (2002) Takeuchi, T., & Lin, D. N. C. 2002, ApJ, 581, 1344
- Turner et al. (2010) Turner, N. J., Carballido, A., & Sano, T. 2010, ApJ, 708, 188
- Velikhov (1959) Velikhov, E. P. 1959, Zh. Eksp. Teor. Fiz., 36, 1398
- Yasui et al. (2009) Yasui, C., Kobayashi, N., Tokunaga, A. T., Saito, M., & Tokoku, C. 2009, ApJ, 705, 54
- Youdin & Lithwick (2007) Youdin, A. N., & Lithwick, Y. 2007, Icarus, 192, 588