New candidates for extremely metal-poor emission-line galaxies in the SDSS/BOSS DR10
We present a spectroscopic study of eight extremely low-metallicity candidate emission-line galaxies with oxygen abundances possibly below 12 +log O/H = 7.35. These galaxies were selected from Data Release 10 of the Sloan Digital Sky Survey/Baryon Oscillation Spectroscopic Survey (SDSS/BOSS DR10). We will call these extremely metal-deficient galaxies XMD galaxies. The electron temperature-sensitive emission line [O iii] 4363 is detected in three galaxies and marginally detected in two galaxies, allowing for abundance determination by a “direct” method. Because of large uncertainties in the [O iii]4363Å line fluxes, we also calculated oxygen abundance in these galaxies together with the remaining three galaxies using a strong-line semi-empirical method. This method gives oxygen abundances higher than 7.35 for three galaxies with detected [O iii]4363Å line and lower than 7.35 for the remaining five objects of the sample. The newly-discovered galaxies represent excellent targets for follow-up spectroscopic observations with the largest telescopes to improve the oxygen abundance determination and to increase the number of these very rare low-metallicity objects. The extreme location of the most massive and luminous XMD galaxies and XMD candidates in the stellar mass-metallicity diagram implies that these galaxies may be genuine young objects. With stellar masses of up to 107 - 108, the galaxies are not chemically enriched and strongly deviate to lower metallicity as compared to the relation obtained for a large sample of low-redshift, star-forming galaxies.
Key Words.:
galaxies: abundances — galaxies: irregular — galaxies: evolution — galaxies: formation — galaxies: ISM — H ii regions — ISM: abundances1 Introduction
Searching for extremely metal-poor emission-line galaxies is very important for several reasons. One of them is that these galaxies are the most promising young galaxy candidates in the local Universe (Guseva et al. 2003; Izotov & Thuan 2004b). In this paper we consider extremely metal-deficient (hereafter XMD) emission-line galaxies, searching for targets with oxygen abundances 12 + logO/H 7.35.
The physical conditions in the interstellar medium (ISM) of XMDs provide insights into a variety of aspects of fundamental physics, cosmology, and astronomy. These galaxies have very low, but not pristine element abundances, hinting at pre-enrichment by e.g. Population III stars (Thuan et al. 2005). Large enough statistics is needed to confirm this idea. The galaxies with very low metallicity share many properties of Ly emitting galaxies and Ly-break galaxies (Prochaska et al. 2003; Nakajima et al. 2013; Shirazi et al. 2014; Shapley et al. 2014). Thanks to the fact that XMDs can be excellent local proxies for their high- counterparts. These chemically unevolved galaxies are also the best objects for the determination of the primordial 4He abundance (e.g. Izotov & Thuan 2004a; Izotov et al. 2007; Izotov & Thuan 2010; Izotov et al. 2013, 2014b). A more detailed review of their properties can be found in Izotov et al. (2012).
Many efforts were undertaken recently to search for these very rare objects (see e.g. Pustilnik et al. 2005; Izotov et al. 2006b; Izotov & Thuan 2007; Guseva et al. 2007; Izotov & Thuan 2009; Pustilnik et. al. 2011; Izotov et al. 2012; Berg et al. 2012). More than ten galaxies with 12+log O/H 7.35 were found among the galaxies from the Sloan Digital Sky Survey Data Release 7 (SDSS DR7) (Izotov et al. 2012). To further increase the number of these objects, we searched for new XMD candidates among the objects from the extention of the SDSS survey, SDSS-III, namely among the galaxies that appeared in the SDSS/BOSS Data Release 10 (DR10).
| Name | R.A.(J2000.0)a | Dec.(J2000.0)a | redshift | b | Mgc | Mstarsd | 12+logO/He | |
|---|---|---|---|---|---|---|---|---|
| Te-method | strong-line method | |||||||
| J0100$-$0028 | 01:00:56.93 | 00:28:43.9 | 0.0192 | 20.85 | 14.43 | 6.62 | … | 7.10 |
| J0122$+$0048 | 01:22:41.61 | 00:48:42.0 | 0.0574 | 21.62 | 16.16 | 6.45 | 7.22 0.15 | 7.35 |
| J0143$+$1958f | 01:43:15.15 | 19:58:06.1 | 0.0017 | 21.76 | 7.66 | 4.28 | … | 7.28 |
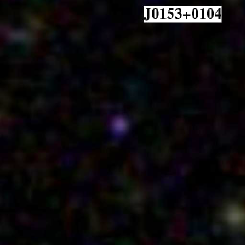
| J0153$+$0104 | 01:53:11.96 | 01:04:40.1 | 0.0632 | 21.51 | 16.23 | 6.34 | 7.34 0.12 | 7.60 |
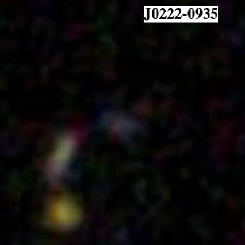
| J0222$-$0935 | 02:22:38.55 | 09:35:35.2 | 0.1148 | 21.61 | 17.30 | 8.04 | 7.29 0.32 | 7.43 |
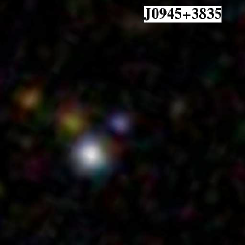
| J0945$+$3835 | 09:45:19.55 | 38:35:52.9 | 0.0723 | 21.78 | 16.82 | 7.24 | 7.33 0.20 | 7.48 |
| J1036$+$2036 | 10:36:39.47 | 20:36:15.8 | 0.0549 | 21.59 | 15.61 | 6.82 | 7.32 0.34 | 7.35 |
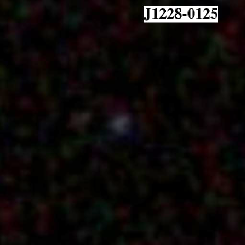
| J1228$-$0125 | 12:28:45.54 | 01:25:26.9 | 0.0728 | 22.09 | 15.58 | 6.99 | … | 7.33 |
aEquatorial coordinates.
bSDSS magnitude.
cAbsolute magnitude.
dLog of stellar mass in unit of solar mass.
eThis paper.
fJ01431958 is part of galaxy UGCA 20.
The data and the element abundance determination are described in Section 2. The results are presented in Section 3. More specifically, we consider XMD emission-line galaxies with respect to the luminosity metallicity relations in Section 3.1, their location in the emission-line diagnostic diagram in Section 3.2, and in the mass-metallicity diagram in Section 3.3. Our main conclusions are summarised in Section 4.
2 The data
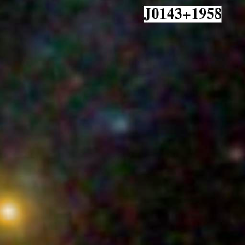
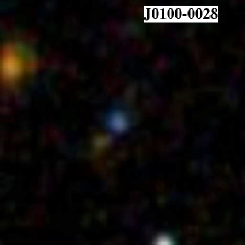
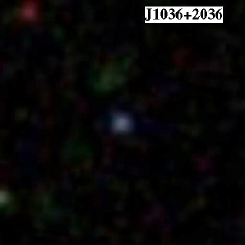
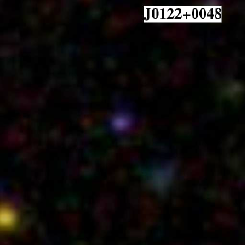
We use a sample of 9000 star-forming galaxies by Izotov et al. (2014a) selected from the spectroscopic database of the SDSS/BOSS DR10 (Ahn et al. 2014). The details of data selection can be found in Izotov et al. (2014). Out of this large sample, we could only identify eight candidates that may represent extremely low-metallicity emission-line galaxies with 12 + logO/H 7.35. The general characteristics of these galaxies, such as the name of galaxy, coordinates, redshift, apparent magnitude, absolute magnitude, and stellar mass are collected in Table 1. The last two columns of the table show oxygen abundances we derived using two methods (see below). SDSS images of the galaxies with labelled names and ordered following increasing redshift are shown in Fig. 1. The rest-frame SDSS spectra of the galaxies arranged with increasing redshift are presented in Fig. 2.
We measured the line fluxes and their errors using the IRAF111IRAF is the Image Reduction and Analysis Facility distributed by the National Optical Astronomy Observatory, which is operated by the Association of Universities for Research in Astronomy (AURA) under cooperative agreement with the National Science Foundation (NSF). SPLOT routine. The line flux errors is later propagated into the calculation of abundance errors. We derived the internal extinction from the Balmer hydrogen emission lines after correction for the Milky Way extinction. The line fluxes were corrected for both reddening (Whitford 1958) and underlying hydrogen stellar absorption by the application of an iterative procedure (Izotov et al. 1994). The observed line intensities ()/(H), the extinction-corrected line intensities ()/(H), multiplied by 100, and equivalent widths of emission lines are shown in Table 2 (available only in the online version of the paper) together with extinction coefficients (H), observed H fluxes, and equivalent widths (abs) of the hydrogen absorption stellar lines.

Finally, we selected the five XMD candidates with the detected [O iii]4363Å emission line. This allows for a reliable oxygen abundance determination using the direct -method and following the prescriptions of Izotov et al. (1994, 1997) and Thuan et al. (1995). The temperature (O iii) is calculated based on the [O iii]4363/(4959+5007) line ratio. For the remaining three XMD candidates the semi-empirical method by Izotov & Thuan (2007) was applied to derive (O iii). We adopt a two-zone photoionised H ii region model: a high-ionisation zone with temperature (O iii), where [O iii] and [Ne iii] lines originate, and a low-ionisation zone with temperature (O ii), where [O ii] lines originate. For (O ii), we use the relation between the electron temperatures (O iii) and (O ii) obtained by Izotov et al. (2006a) from the H ii photoionisation models of Stasińska & Izotov (2003).
We derived ionic and total oxygen and neon abundances using expressions for ionic abundances and the ionisation correction factor for neon by Izotov et al. (2006a). In Table 3 (available only on line) the electron temperatures (O ii) and (O iii), and oxygen and neon abundances are given for three galaxies with detected and for two galaxies with marginally detected [O iii]4363 line. All five XMD candidates have very low oxygen abundances 12 + log O/H 7.35 (Table 3). The oxygen abundance in the remaining three galaxies with undetected [O iii]4363 lines is derived with the strong-line semi-empirical method (Table 4). These three galaxies also have very low oxygen abundances 12 + log O/H 7.35.
Because of large uncertainties in the [O iii]4363Å line fluxes, we also recalculated oxygen abundance for the five galaxies with detected and marginally detected [O iii]4363Å (Table 3) using a strong-line semi-empirical method. This method gives oxygen abundances higher than 7.35 for three galaxies with detected 4363Å line (see Table 4). The largest difference is found for the galaxy J0153+0104 with the best derived flux of the [O iii]4363Å line and the best determination of the oxygen abundance with the -method. This fact indicates that strong-line methods may not be used for accurate abundance determination. Instead higher-quality observations are needed to improve oxygen abundances in the considered galaxies. We do not show the sulfur abundances derived by using [S iii]9069 and 9531 in Table 3 and 4. These lines are observed in noisy parts of the spectra with numerous residuals of night sky lines, making sulfur abundances uncertain.
3 Results
In this section, we discuss the oxygen abundances and the distributions of the extremely metal-deficient galaxies in the broad-band luminosity-metallicity, H luminosity-metallicity, diagnostic Baldwin-Phillips-Terlevich, and mass-metallicity diagrams. Throughout this Section we compare the XMD candidates with previous samples of similar emission-line galaxies, analysing all these data in a uniform way (Izotov et al. 2006a; Izotov & Thuan 2007; Izotov et al. 2011, 2012, 2014).
It is seen from Table 3 and 4 that no galaxy with an oxygen abundance 12 + logO/H 7.1 was found. A similar conclusion was obtained in previous studies (e.g. Izotov et al. 2012). This supports the idea discussed by, e.g., Thuan et al. (2005) that the matter from which dwarf emission-line galaxies were formed was pre-enriched to a level 12 + log O/H 6.9 (or 2% of the abundance 12 + log O/H = 8.69 of the Sun, Asplund et al. 2009). They also showed that BCDs spanning a wide range in ionised gas metallicities all have H i envelopes with about the same neutral gas metallicity of 7.0. This is also the metallicity found in Ly absorbers (Prochaska et al. 2003). Taken together, the available data suggest that the primordial neutral gas may have been previously enriched to a common metallicity level 12 + log O/H 6.9 - 7.0, possibly by Population III stars.
The number of XMDs with 12 + logO/H 7.35 is yet very small. Only eight XMD candidates out of 9000 emission-line galaxies extracted from SDSS DR10, or 0.1%, were found, indicating that these objects are very scarce in the Local Universe.
3.1 Luminosity-metallicity relations
The existence of the relation between optical luminosities and metallicities of galaxies, the so called - relation, was established by Lequeux et al. (1979) and later confirmed by Skillman et al. (1989) and Richer & McCall (1995). The metallicity of a galaxy is a measure of the abundance of metals relative to hydrogen in the interstellar medium and is most commonly quoted in terms of the oxygen abundance 12 + log O/H. As a measure of the optical luminosity, we use the absolute magnitude obtained from the apparent SDSS magnitudes (Table 1), at variance with early studies of the - relation, in what the apparent magnitude was commonly used. However, Papaderos et al. (2008) have shown that SDSS magnitudes are very similar to magnitudes of star-forming galaxies. The distances to the galaxies are derived from their radial velocities, adopting a Hubble constant = 70 km s-1 Mpc-1.
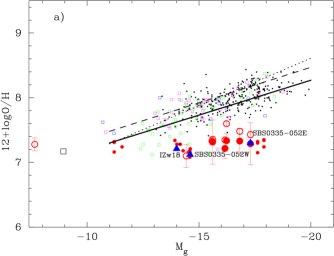
In Fig. 3a the absolute magnitude metallicity relation for SDSS galaxies by Izotov et al. (2006a), as a representative sample, is plotted in black dots. We want to examine how much the XMDs differ from the star-forming galaxies in “standard” samples. The solid line represents the linear regression to SDSS galaxies (Izotov et al. 2006a) and to all galaxies from Izotov & Thuan (2007). The position of all XMD candidates from this paper and from Izotov & Thuan (2007) and Izotov et al. (2012) are also plotted.
Berg et al. (2012) studied a sample of 42 low-luminosity galaxies aiming to fill the relatively sparse low-luminosity end of the relation with intrinsically faint galaxies. For comparison we show their data in small open squares in magenta. Aiming to find the low-metallicity emission-line galaxies in the voids Pustilnik et. al. (2011) discovered some objects with low metallicity, which are plotted in Fig. 3 with green open squares. Blue diffuse dwarf (BDD) galaxies with star-formation activity from James et al. (2014) are shown with open blue squares. The most-metal-deficient BCDs I Zw 18, SBS 0335–052W, and SBS 0335–052E are shown in filled blue triangles and are labelled. One of the most metal-deficient star-forming nearby dwarf galaxies, Leo P (Skillman et al. 2013) is plotted with a large open black square. We also plotted the relation derived by Richer & McCall (1995) (dotted line) and the relation of Berg et al. (2012) (dashed line), which are not very different from the relation by Izotov & Thuan (2007).
Most XMDs occupy the same region in the diagram as the well-known metal-deficient BCDs I Zw 18 and SBS 0335–052E. All these galaxies are systematically shifted to lower metallicities relative to the “standard” line for every bin of the range from 12 to 18 mag. Considering a higher oxygen abundance cutoff 12 + log(O/H) 7.65 Kniazev et al. (2003) and Guseva et al. (2009) found a large scatter of galaxies filling the gap between the solid line in Fig. 3a and the location of XMDs with 12 + log(O/H) 7.35.
Several possible evolutionary scenarios were suggested for these galaxies. One of them implies that they are genuine chemically unevolved (or young) galaxies with low metallicity. At 17 they are shifted down by about 0.5-0.6 dex relative to the “standard” line. This implies that about 0.09% of quite typical emission-line galaxies, populating the Local Universe, show a sizable deficiency of oxygen, amounting to not more than 2 - 4% of the metallicity compared to the bulk of galaxies used for producing the relation.
A likely alternative interpretation of the observed shift is an increase in luminosity at a given metallicity because of strong SF activity (e.g. Guseva et al. 2009). Most extreme XMD outliers are shifted from the “standard” relation (represented, for instance, with the relation of Richer & McCall 1995) by more than 6-7 mags (Fig. 3a). Including most-metal deficient galaxies, especially those with strong and very strong ongoing star formation, leads to a shallower slope of the relation (Guseva et al. 2009). In particular, XMDs with 12 + log(O/H) 7.35 and XMD candidates do not show a dependence on metallicity at all.
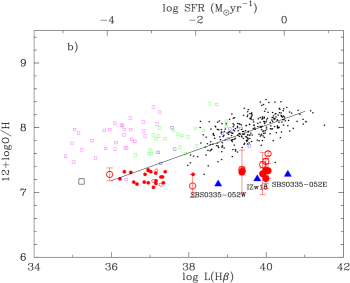
In Fig. 3b, the diagram H luminosity (H) metallicity is plotted for the same galaxies as in Fig. 3a. The upper axis is a scale for the star formation rate (SFR), derived from the H luminosity as defined by Kennicutt (1998). As seen in Fig. 3b, XMDs have a large spread of H luminosity from 1036 to 1040 erg s-1. Six out of eight galaxies from our new XMD candidate sample are characterised by strong SF activity, which results in the presence of high-excitation H ii regions with strong emission lines. Their SFRs are in the range 0.01 - 0.5 yr-1 and are close to the SFRs of I Zw 18 and the SBS 0335–052 system. Only one object from our newly discovered XMDs, J0143+1958, has an H luminosity corresponding to one late O or early B star assuming that a single O5V star produces the H luminosity of 4.81036 erg s-1 (leftmost outlying open circles in Figs. 3a and 3b, Leitherer 1990). This is in fact not a galaxy, but an H ii region in the nearby low-surface-brightness dwarf galaxy UGCA 20, while our other XMDs are more distant compact galaxies with spectra, which are representative for the entire galaxy.
3.2 The emission-line diagnostic diagram
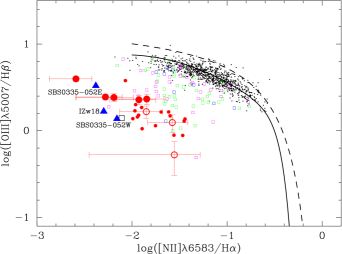
In Fig. 4 we plot the location of XMDs in the Baldwin-Phillips-Terlevich (BPT) diagnostic diagram (Baldwin et al. 1981). As seen in the figure, the newly discovered most metal-poor galaxies are located at the same place as the XMDs with 12 + logO/H 7.35 collected by Izotov et al. (2012). All these galaxies are far below the region, where the luminous compact galaxies (LCGs) by Izotov et al. (2011) are located (black dots). Solid and dashed lines are the lines by Stasińska et al. (2006) and Kauffmann et al. (2003), respectively, separating star-forming galaxies and AGNs. Similar to Fig. 3 the location of most newly discovered XMD candidates in Fig. 4 is close to that of the most metal-deficient BCDs I Zw 18 and SBS 0335–052E+W. The XMDs presently known populate a region that is so far almost empty. Thus, our discovery of these very scarce objects in the Local Universe appreciably increases the statistics needed to understand the nature of these galaxies.
3.3 Mass-metallicity relation
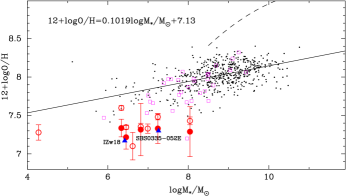
The relation between the stellar mass and its metallicity is a fundamental relation linking these two global galaxy properties. Mass is more fundamentally related to metallicity than luminosity. The luminosity of a galaxy is enhanced (active phase) or not enhanced (passive phase) by ongoing star formation, while stellar mass and metallicity are both determined by a galaxy’s evolution in the past. We show our XMD candidates on the stellar mass-metallicity (-) diagram (Fig. 5). The solid line is the - relation obtained by Izotov et al. (2014) for SDSS DR7 emission-line galaxies with robust metallicity determinations (black dots). For these galaxies, the errors of the [O iii] 4363 emission-line fluxes do not exceed 25%.
To derive stellar masses we modelled spectral energy distributions (SEDs) in the entire spectral range of 3600-10300Å, and subtracted gaseous line and continuum emission. The method is based on fitting a series of model SEDs to the observed SED and finding the best fit (Guseva et al. 2006, 2007; Izotov et al. 2011). Star formation history was approximated by a recent short burst in ages 10 Myr, which accounts for the young stellar population, and a prior continuous star formation responsible for older stars of ages, that vary between 10 Myr and 15 Gyr.
Our eight XMD candidates are shown in large red circles. All of them, except the low-mass H ii region in UGCA 20, are located in the same area, as I Zw 18 and SBS 0335–052E. They are shifted by several orders of magnitude to high stellar masses as compared to stellar masses defined by the - relation for SDSS DR7 emission-line galaxies. For the range of stellar masses of these galaxies of 2106 - 108, their oxygen abundances are 3-4 times lower than predicted from the - relation for the SDSS DR7 emission-line galaxy sample. These differences may likely be due to the relatively young ages of XMDs, which had not enough time to evolve to higher metallicities, and support the idea that these least chemically evolved galaxies are genuine young galaxies. Many XMD galaxies are interacting systems (Ekta et al. 2008). Ekta & Chengalur (2010) proposed an alternative hypothesis that XMD galaxies deviate from the - and - relations because of a combination of having low effective chemical yields and higher gas fractions due to tidal interactions.
Presently, XMDs are characterised by very high specific star formation rates (sSFR) of 10 – 100 Gyr-1. These high sSFRs contradict the conclusion by Shi et al. (2014) that the star formation efficiences in dwarf low-metallicity galaxies are less than a tenth of the one found in normal metal-rich galaxies and that therefore star formation may have been inefficient in the early Universe.
4 Conclusions
We present a spectroscopic study of eight candidates for extremely metal-deficient (XMD) emission-line galaxies selected from the Sloan Digital Sky Survey/Baryon Oscillation Spectroscopic Survey Data Release 10 (SDSS/BOSS DR10), a part of the SDSS-III survey. We merged this sample with analogous XMD galaxies from the SDSS DR7 (Izotov et al. 2012) and from previous investigations. Our main results are as follows.
We find that oxygen abundances in all eight galaxies are very low and classify them as XMD candidates. The oxygen abundances in five XMD candidates with detected or marginally detected [O iii]4363 emission line were derived by the “direct” method. Note, however, the large uncertainties in the weak [O iii]4363 line in some galaxies. Six out of eight newly discovered XMD candidates are characterised by strong SF activity and high SFRs, similar to those in the well-known BCDs I Zw 18 and SBS 0335–052E (Sargent & Searle 1970; Izotov et al. 1990).
No emission-line galaxies with 12 + logO/H 7.0 were found in the entire combined SDSS DR7 and DR10 surveys and among other galaxies collected from the literature (this paper and Izotov et al. 2012). This finding supports conclusions by Thuan et al. (2005) and Izotov et al. (2012) that the matter, from which XMDs were formed, was probably pre-enriched to this level prior to their formation.
The XMDs with strong SF activity are the most prominent outliers in the luminosity-metallicity () and H luminosity-metallicity ((H) - ) relations, increasing the dispersion in the low-metallicity end of the relations.
Extreme positions of the most massive and luminous XMDs in the mass-metallicity diagrams imply that the galaxies could be genuinely young. These galaxies with stellar masses in the range of 107 - 108 are not yet chemically enriched.
Acknowledgements.
Y.I.I. and N.G.G. thank the hospitality of the Max-Planck Institute for Radioastronomy, Bonn, Germany. Funding for the Sloan Digital Sky Survey (SDSS-III) has been provided by the Alfred P. Sloan Foundation, the Participating Institutions, the National Science Foundation, the U.S. Department of Energy, the National Aeronautics and Space Administration, the Japanese Monbukagakusho, and the Max Planck Society, and the Higher Education Funding Council for England.References
- Ahn et al. (2014) Ahn, C. P., Rachael, A., Prieto, A. et al. 2014, ApJS, 211, 17
- Asplund et al. (2009) Asplund, M., Grevesse, N., & Sauval, A. J. & Scott, P. 2009, ARAA, 47, 481
- Baldwin et al. (1981) Baldwin, J. A., Phillips, M. M., & Terlevich, R. 1981, PASP, 93, 5
- Berg et al. (2012) Berg, D. A., Skillman, E. D., Marble, A. R., et al. 2012, ApJ, 754, 98
- Ekta & Chengalur (2010) Ekta, B., & Chengalur, J. N. 2010, MNRAS, 406, 1238
- Ekta et al. (2008) Ekta, B., Chengalur, J. N., Pustilnik, S. A. 2008, MNRAS, 391, 881
- Guseva et al. (2003) Guseva, N. G., Papaderos, P., Izotov, Y. I., et al. 2003, A&A, 407, 105
- Guseva et al. (2006) Guseva, N. G., Izotov, Y. I., & Thuan, T. X. 2006, ApJ, 644, 890
- Guseva et al. (2007) Guseva, N. G., Izotov, Y. I., Papaderos, P. & Fricke, K. J. 2007, A&A, 464, 885
- Guseva et al. (2009) Guseva, N. G., Papaderos, P., Meyer, H., Izotov, Y. I., & Fricke, K. J. 2009, A&A, 505, 63
- Izotov & Thuan (2004a) Izotov, Y. I., & Thuan, T. X. 2004a, ApJ, 602, 200
- Izotov & Thuan (2004b) Izotov, Y. I., & Thuan, T. X. 2004b, ApJ, 616, 768
- Izotov & Thuan (2007) Izotov, Y. I., & Thuan, T. X. 2007, ApJ, 665, 1115
- Izotov & Thuan (2009) Izotov, Y. I., & Thuan, T. X. 2009, ApJ, 690, 1797
- Izotov & Thuan (2010) Izotov, Y. I., & Thuan, T. X. 2010, ApJ, 710, L67
- Izotov et al. (1990) Izotov, Y. I., Guseva, N. G., Lipovetsky, V. A., Kniazev, A. Y., & Stepanian, J. A. 1990, Nature, 343, 238
- Izotov et al. (1994) Izotov, Y. I., Thuan, T. X., & Lipovetsky, V. A. 1994, ApJ, 435, 647
- Izotov et al. (1997) Izotov, Y. I., Thuan, T. X., & Lipovetsky, V. A. 1997, ApJS, 108, 1
- Izotov et al. (2006a) Izotov, Y. I., Stasińska, G., Meynet, G., Guseva, N. G., & Thuan, T. X. 2006a, A&A, 448, 955
- Izotov et al. (2006b) Izotov, Y. I., Papaderos, P., Guseva, N. G., Fricke, K. J., & Thuan, T. X. 2006b, A&A, 454, 137
- Izotov et al. (2007) Izotov, Y. I., Thuan, T. X., & Stasińska, G. 2007, ApJ, 662, 15
- Izotov et al. (2011) Izotov, Y. I., Guseva, N. G., & Thuan, T. X. 2011, ApJ, 728, 161
- Izotov et al. (2012) Izotov, Y. I., Thuan, T. X. & Guseva, N. G. 2012, A&A, 546, 122
- Izotov et al. (2013) Izotov, Y. I., Stasinska, G., Guseva, N. G. 2013, A&A, 558, 571
- Izotov et al. (2014) Izotov, Y. I., Guseva, N. G., Fricke, K. J., & Henkel, C. 2014a, A&A, 561, 33
- Izotov et al. (2014b) Izotov, Y. I., Thuan, T. X., Guseva, N. G., 2014b, MNRAS, 445, 778
- Izotov et al. (2014a) Izotov, Y. I., Guseva, N. G., Fricke, K. J., & Henkel, C. 2014c, submitted to MNRAS
- James et al. (2014) James, B. L., Koposov, S., Stark, D. P. et al. 2014, MNRAS, arXiv: astro-ph 1411.7371.v1
- Kauffmann et al. (2003) Kauffmann, G., Heckman, T. M., Tremonti, C., et al. 2003, MNRAS, 346, 1055
- Kennicutt (1998) Kennicutt, R. C., Jr. 1998, ARA&A, 36, 189
- Kniazev et al. (2003) Kniazev, A. Y., Grebel, E. K., Hao, L., Strauss, M. A., Brinkmann, J., & Fukugita, M. 2003, ApJ, 593, 73
- Leitherer (1990) Leitherer, C. 1990, ApJS, 73, 1
- Lequeux et al. (1979) Lequeux, J., Rayo, J. F., Serrano, A., Peimbert, M., & Torres-Peimbert, S. 1979, A&A, 80, 155
- Nakajima et al. (2013) Nakajima, K., Ouchi, M., Shimasaku, K., Hashimoto, T., Ono, Y., Lee, J. C. 2013, ApJ, 769, 3
- Papaderos et al. (2008) Papaderos, P., Guseva, N. G., Izotov, Y. I., & Fricke, K. J. 2008, A&A, 491, 113
- Prochaska et al. (2003) Prochaska, J. X., Gawiser, E., Wolfe, A. M., Castro, S., & Djorgovski, S. G. 2003, ApJ, 595, L9
- Pustilnik et al. (2005) Pustilnik, S. A., Kniazev, A. Y., & Pramskij, A. G. 2005, A&A, 443, 91
- Pustilnik et. al. (2011) Pustilnik, S. A., Teplyakova, A. L., Kniazev, A. Y. 2011, Astrophys. Bull., 66, 255
- Richer & McCall (1995) Richer, M. G., & McCall, M. L. 1995, ApJ, 445, 642
- Sargent & Searle (1970) Sargent, W. L. W., & Searle, L. 1970, ApJ, 162, L155
- Shapley et al. (2014) Shapley, A. E., et al., 2014, arXiv:1409.7071
- Shi et al. (2014) Shi, Y., Armus, L., Helou, G., et al., 2014, nature, 514, 335
- Shirazi et al. (2014) Shirazi, M., Brinchmann, J., Rahmati, A. 2014, ApJ, 787, 120
- Skillman et al. (1989) Skillman, E. D., Kennicutt, R. C., Jr. & Hodge, P. W. 1989, ApJ, 347, 875
- Skillman et al. (2013) Skillman, E. D., Salzer, J. J., Berg, D. A. et al, 2013, AJ, 146, 3
- Stasińska (1990) Stasińska G. 1990, A&AS, 83, 501
- Stasińska & Izotov (2003) Stasińska, G., & Izotov, Y. I. 2003, A&A, 397, 71
- Stasińska et al. (2006) Stasińska, G., Cid Fernandes, R., Mateus, A., Sodré, L., & Asari, N. V. 2006, MNRAS, 371, 972
- Thuan et al. (1995) Thuan, T. X., Izotov, Y. I., & Lipovetsky, V. A. 1995, ApJ, 445, 108
- Thuan et al. (1997) Thuan, T. X., Izotov, Y. I., & Lipovetsky, V. A. 1997, ApJ, 477, 661
- Thuan et al. (2005) Thuan, T. X., Lecavelier des Etangs, A., & Izotov, Y. I. 2005, ApJ, 621, 269
- Tremonti et al. (2004) Tremonti, C., et al. 2004, ApJ, 613, 898
- Whitford (1958) Whitford, A. E. 1958, AJ, 63, 201
| Galaxy | |||||||
| J0143+1958 | J0100–0028 | ||||||
| Ion | ()/(H) | ()/(H) | EWa | ()/(H) | ()/(H) | EWa | |
| 3727 [O ii] | 159.1 36.7 | 141.8 39.0 | 15.7 | 94.2 31.2 | 106.6 37.7 | 8.0 | |
| 4340 H | 37.0 16.6 | 46.9 25.0 | 6.1 | 42.7 19.5 | 46.7 24.0 | 6.6 | |
| 4861 H | 100.0 25.1 | 100.0 28.7 | 20.7 | 100.0 30.0 | 100.0 32.2 | 14.9 | |
| 4959 [O iii] | 48.6 17.4 | 43.1 17.4 | 8.9 | 19.0 18.9 | 18.4 18.8 | 1.8 | |
| 5007 [O iii] | 139.9 31.1 | 124.2 31.1 | 23.3 | 54.7 22.5 | 52.7 22.2 | 6.6 | |
| 6563 H | 318.1 62.1 | 287.9 68.8 | 113.8 | 343.1 79.8 | 288.3 74.8 | 69.7 | |
| 6716 [S ii] | 19.1 11.2 | 16.9 11.3 | 5.1 | 17.8 13.4 | 14.7 11.5 | 4.0 | |
| 6731 [S ii] | 9.9 10.0 | 8.8 10.0 | 2.7 | 21.9 14.7 | 18.1 12.6 | 4.3 | |
| 9531 [S iii] | … | … | … | 47.8 16.5 | 34.1 14.0 | 29.1 | |
| (H) | 0.005 | 0.205 | |||||
| (H)b | 1.40 | 0.97 | |||||
| EW(abs)a Å | 2.61 | 0.33 | |||||
| Galaxy | |||||||
| J1036+2036 | J0122+0048 | ||||||
| Ion | ()/(H) | ()/(H) | EWa | ()/(H) | ()/(H) | EWa | |
| 3727 [O ii] | 88.2 13.5 | 91.5 14.7 | 31.3 | 48.7 5.7 | 57.0 6.9 | 29.0 | |
| 3869 [Ne iii] | 19.5 7.6 | 20.1 7.9 | 5.2 | 21.5 3.8 | 24.6 4.4 | 18.3 | |
| 3889 He i + H8 | … | … | … | 23.7 3.9 | 27.5 5.9 | 24.2 | |
| 3968 [Ne iii] + H7 | … | … | … | 25.4 3.9 | 29.0 5.4 | 31.9 | |
| 4101 H | 26.8 6.8 | 28.0 8.2 | 20.2 | 27.6 4.1 | 30.9 5.5 | 33.0 | |
| 4340 H | 46.8 8.9 | 48.1 10.5 | 27.6 | 47.7 5.3 | 51.2 6.2 | 78.5 | |
| 4363 [O iii] | 7.3 5.6 | 7.4 5.7 | 3.2 | 9.2 2.8 | 9.8 3.0 | 10.3 | |
| 4861 H | 100.0 14.1 | 100.0 14.7 | 78.9 | 100.0 8.8 | 100.0 9.1 | 147.5 | |
| 4959 [O iii] | 72.5 11.6 | 71.9 11.6 | 32.5 | 86.7 7.9 | 85.5 7.8 | 179.6 | |
| 5007 [O iii] | 229.9 27.5 | 227.6 27.4 | 91.3 | 249.8 18.5 | 244.8 18.3 | 468.7 | |
| 5876 He i | … | … | … | 11.2 2.5 | 10.0 2.3 | 22.7 | |
| 6300 [O i] | … | … | … | 1.4 1.6 | 1.2 1.3 | 3.2 | |
| 6312 [S iii] | … | … | … | 0.6 1.5 | 0.5 1.3 | 1.5 | |
| 6563 H | 287.8 33.2 | 273.9 34.6 | 238.2 | 324.5 23.4 | 272.6 21.5 | 1015.0 | |
| 6716 [S ii] | 13.4 4.9 | 12.7 4.7 | 11.3 | 4.0 1.8 | 3.3 1.5 | 9.4 | |
| 6731 [S ii] | 10.0 4.5 | 9.5 4.3 | 8.3 | 3.8 1.7 | 3.1 1.4 | 9.0 | |
| 9069 [S iii] | … | … | … | 1.8 1.1 | 1.3 0.8 | 17.9 | |
| 9531 [S iii] | … | … | … | 20.7 3.1 | 14.6 2.4 | 56.6 | |
| (H) | 0.060 | 0.225 | |||||
| (H)b | 3.10 | 8.10 | |||||
| EW(abs)a Å | 0.44 | 0.41 | |||||
| Galaxy | |||||||
| J0153+0104 | J0945+3835 | ||||||
| Ion | ()/(H) | ()/(H) | EWa | ()/(H) | ()/(H) | EWa | |
| 3727 [O ii] | 23.3 3.5 | 25.6 4.0 | 34.1 | 103.1 12.9 | 129.9 17.2 | 41.2 | |
| 3869 [Ne iii] | 38.0 4.5 | 41.1 5.0 | 47.0 | 35.0 6.6 | 42.7 8.3 | 19.7 | |
| 3889 He i + H8 | 20.1 3.4 | 22.4 5.5 | 24.6 | 32.6 5.8 | 39.7 7.6 | 57.2 | |
| 3968 [Ne iii] + H7 | 29.6 3.9 | 32.2 5.2 | 49.8 | 31.2 6.1 | 37.5 9.3 | 22.9 | |
| 4101 H | 26.7 3.6 | 28.7 4.8 | 48.3 | 26.9 5.5 | 31.4 7.8 | 25.0 | |
| 4340 H | 46.5 4.9 | 48.6 5.6 | 98.2 | 50.0 7.7 | 55.4 9.7 | 42.8 | |
| 4363 [O iii] | 14.5 2.8 | 15.0 2.9 | 31.2 | 10.1 3.9 | 11.1 4.3 | 9.4 | |
| 4686 He ii | … | … | … | 6.3 3.7 | 6.5 3.8 | 4.6 | |
| 4861 H | 100.0 8.2 | 100.0 8.5 | 215.5 | 100.0 12.2 | 100.0 12.9 | 87.6 | |
| 4959 [O iii] | 132.5 10.2 | 131.1 10.2 | 180.7 | 86.4 10.5 | 84.7 10.4 | 79.4 | |
| 5007 [O iii] | 401.9 26.7 | 396.3 26.5 | 582.4 | 248.8 25.5 | 241.9 25.0 | 246.3 | |
| 5876 He i | 9.9 2.1 | 9.0 2.0 | 41.6 | 14.5 3.8 | 12.3 3.3 | 27.2 | |
| 6563 H | 303.1 20.6 | 272.5 20.3 | 1432.0 | 350.1 34.5 | 271.5 29.3 | 440.3 | |
| 6716 [S ii] | 1.8 1.2 | 1.6 1.1 | 10.0 | … | … | … | |
| 6731 [S ii] | 1.8 1.2 | 1.6 1.1 | 9.2 | … | … | … | |
| 9069 [S iii] | 4.1 1.3 | 3.4 1.2 | 38.2 | … | … | … | |
| (H) | 0.135 | 0.330 | |||||
| (H)b | 9.35 | 3.98 | |||||
| EW(abs)a Å | 0.75 | 0.22 | |||||
| Galaxy | |||||||
| J1228–0125 | J0222–0935 | ||||||
| Ion | ()/(H) | ()/(H) | EWa | ()/(H) | ()/(H) | EWa | |
| 3727 [O ii] | 130.1 22.7 | 127.5 23.9 | 23.3 | 109.9 17.4 | 108.1 19.3 | 83.5 | |
| 3869 [Ne iii] | 12.6 9.9 | 12.3 9.9 | 2.8 | 24.3 7.7 | 23.8 8.1 | 15.7 | |
| 3889 He i + H8 | … | … | … | 15.1 6.1 | 17.8 7.9 | 16.7 | |
| 3968 [Ne iii] + H7 | … | … | … | 16.4 7.2 | 23.3 11.7 | 7.5 | |
| 4101 H | 30.0 10.5 | 35.5 13.9 | 9.6 | 16.0 6.6 | 20.4 9.4 | 10.8 | |
| 4340 H | 39.9 11.3 | 44.7 13.8 | 14.1 | 39.9 9.3 | 42.9 10.9 | 28.0 | |
| 4363 [O iii] | … | … | … | 10.0 6.4 | 9.6 6.5 | 4.8 | |
| 4861 H | 100.0 17.5 | 100.0 17.9 | 99.8 | 100.0 16.3 | 100.0 17.6 | 53.4 | |
| 4959 [O iii] | 56.8 12.9 | 55.6 12.9 | 22.1 | 86.0 14.6 | 80.5 14.6 | 50.6 | |
| 5007 [O iii] | 169.3 26.4 | 166.0 26.4 | 65.1 | 248.3 33.8 | 232.1 33.7 | 73.7 | |
| 6563 H | 264.7 37.8 | 261.0 41.3 | 340.8 | 299.7 39.4 | 271.1 41.3 | 284.3 | |
| 6716 [S ii] | … | … | … | 23.6 6.7 | 21.0 6.5 | 22.6 | |
| 6731 [S ii] | … | … | … | 12.5 5.4 | 11.1 5.2 | 10.2 | |
| (H) | 0.000 | 0.065 | |||||
| (H)b | 2.08 | 2.41 | |||||
| EW(abs)a Å | 2.00 | 3.45 | |||||
aIn angstroms.
bIn units of 10-16 ergs s-1 cm-2.
| Galaxy | |||||
| Property | J1036+2036 | J0122+0048 | J0153+0104 | J0945+3835 | J0222-0935 |
| (O iii) (K) | |||||
| (O ii) (K) | |||||
| O+/H+ (104) | |||||
| O++/H+ (104) | |||||
| O/H (104) | |||||
| 12 + log(O/H) | |||||
| Ne++/H+ (105) | |||||
| ICF | 1.153 | 1.125 | 1.043 | 1.243 | 1.198 |
| log(Ne/O) | |||||
| Galaxy | ||||
| Property | J0143+1958 | J0100–0028 | J1036+2036 | J0122+0048 |
| (O iii) (K) | ||||
| (O ii) (K) | ||||
| O+/H+ (104) | ||||
| O++/H+ (104) | ||||
| O/H (104) | ||||
| 12 + log(O/H) | ||||
| Ne++/H+ (105) | … | … | ||
| ICF | … | … | 1.138 | 1.092 |
| log(Ne/O) | … | … | ||
| Galaxy | ||||
| Property | J0153+0104 | J0945+3835 | J1228–0125 | J0222–0935 |
| (O iii) (K) | ||||
| (O ii) (K) | ||||
| O+/H+ (104) | ||||
| O++/H+ (104) | ||||
| O/H (104) | ||||
| 12 + log(O/H) | ||||
| Ne++/H+ (105) | ||||
| ICF | 1.026 | 1.156 | 1.215 | 1.145 |
| log(Ne/O) | ||||