The unification of powerful quasars and radio galaxies
and their relation to other massive galaxies
Abstract
The unification model for powerful radio galaxies and radio-loud quasars postulates that these objects are intrinsically the same but viewed along different angles. Herschel Space Observatory111Herschel is an ESA space observatory with science instruments provided by European-led Principal Investigator consortia and with important participation from NASA. data permit the assessment of that model in the far-infrared spectral window. We analyze photometry from Spitzer and Herschel for the distant 3CR hosts, and find that radio galaxies and quasars have different mid-infrared, but indistinguishable far-infrared colors. Both these properties, the former being orientation dependent and the latter orientation invariant, are in line with expectations from the unification model. Adding powerful radio-quiet active galaxies and typical massive star-forming galaxies to the analysis, we demonstrate that infrared colors not only provide an orientation indicator, but can also distinguish active from star-forming galaxies.
1 Introduction
Active Galactic Nuclei (AGN) show a large variety of observational properties despite being universally driven by accretion of matter onto supermassive black holes. Their ubiquitous nature and complex interplay with their host galaxies make AGN essential elements of any model of galaxy evolution. Since their discovery in the 1950s, AGN have been observationally classified into a number of different types depending on the particular wavelength range used for the observations. Unification models for AGN (Barthel, 1989; Antonucci, 1993; Urry & Padovani, 1995) were developed later, explaining the differences between some AGN types solely in terms of viewing angle. An essential part of these models is the so-called AGN ’torus’: a geometrically and optically thick structure filled with molecular gas and dust surrounding the active nucleus. The AGN torus has a geometry that allows radiation to escape freely in certain directions but not in others, rendering samples of objects selected at X-ray, ultra-violet (UV) and visible wavelengths largely inapplicable for testing unification models.
Radio-selected AGN are particularly well-suited for testing the unification model, because when selected based on their extended (well outside the torus), low-frequency, transparent (i.e. optically thin) radio emission they show no bias with respect to orientation. The unification model for powerful radio-loud AGN postulates that radio galaxies (RGs) are viewed edge-on so that the torus obscures the active nucleus and nearby broad-line emitting regions, while quasars (QSRs) are the same objects, but viewed with a face-on torus so that the nuclear regions and broad emission lines are directly visible. The validity of the unification model for powerful radio-loud AGN has been examined using a variety of orientation-dependent properties (recently reviewed in Antonucci, 2012), in the radio (Barthel, 1989; Singal, 1993), mid-infrared (MIR) (Ogle et al., 2006; Cleary et al., 2007; Haas et al., 2008; Leipski et al., 2010), and X-ray (Wilkes et al., 2013) domains.
2 Infrared properties
If the unification model holds, then any isotropic (orientation invariant) property must be comparable for samples of RGs and QSRs with matched low-frequency radio properties. One such an isotropic candidate is the far-infrared (FIR) emission, which is dominated by star-formation-heated dust on the scale of the host galaxy, but may also include a contribution from optically thin, AGN-powered emission from the torus. Due to sensitivity issues, earlier FIR studies relied on relatively small samples of mostly nearby, less luminous sources, and therefore failed to provide robust conclusions on the unification model for powerful radio-loud AGN in the FIR (e.g., Hes et al., 1995; van Bemmel et al., 2000; Meisenheimer et al., 2001; Haas et al., 2004). The Herschel Space Observatory (Pilbratt et al., 2010), with its unprecedented sensitivity, resolution, and wavelength coverage for the first time permits rest-frame FIR tests of unification for distant radio-loud AGN which have hitherto been outside the reach of infrared space missions. In order to test the unification model in the FIR, we study the complete 3CR sample of powerful (L178MHz 5 1028 W Hz-1) radio-loud AGN (Spinrad et al., 1985) using the two Herschel imaging photometers: PACS at 70 and 160 m (Poglitsch et al., 2010) and SPIRE at 250, 350, and 500 m (Griffin et al., 2010). The extreme luminosities of our sample objects ensure that all objects are highly accreting (in quasar-mode, e.g., Best & Heckman, 2012); none of them is classified as a low-ionization emission-line source (e.g., Ogle et al., 2006).
In addition to the Herschel data, the availability of ancillary Spitzer (Werner et al., 2004) data at wavelengths between 3.6 and 24 m (Haas et al., 2008) allows us to obtain physical properties of the 3CR hosts by fitting their full infrared spectral energy distributions (SEDs) with a combination of four components, as explained in detail in Barthel et al. (2012) and Podigachoski et al. (2015). These components include emission from the circumnuclear, AGN-heated torus dust (Hönig & Kishimoto, 2010), from the extended star-formation-heated cold dust, from the evolved stellar populations, and from hot nuclear graphite dust. The best-fit SEDs of our 61 3CR hosts were recently presented in Podigachoski et al. (2015). Twenty-three hosts in the sample (presented in Table 1) have good signal-to-noise detections in at least three Herschel bands, typically the three shortest bands, resulting in estimated star formation rates (SFRs) of order hundreds of solar masses per year, coeval with the black hole activity (Podigachoski et al., 2015). Such prodigious SFRs, at the level of ultra-luminous infrared galaxies, have similarly been inferred in other studies of high- radio galaxies (e.g. Ogle et al., 2012; Drouart et al., 2014; Tadhunter et al., 2014).
3 MIR/FIR colors – a powerful tool
A simpler but revealing way to look at the shapes of SEDs is to employ colors. Infrared color-color diagrams are widely used to separate AGN from non-AGN in wide-/deep-field galaxy surveys (e.g., Lacy et al., 2004; Stern et al., 2005; Donley et al., 2012; Kirkpatrick et al., 2013). Using the best-fit SEDs of the 23 3CR objects detected in at least three Herschel bands, we create rest-frame color-color diagrams from their hosts’ dust emission at 5, 20, 70, and 100 m. The emission at the former two wavelengths is mainly AGN-powered (e.g., Rowan-Robinson, 1995), whereas the emission at the latter two wavelengths is predominantly star-formation-powered (Schweitzer et al., 2006).
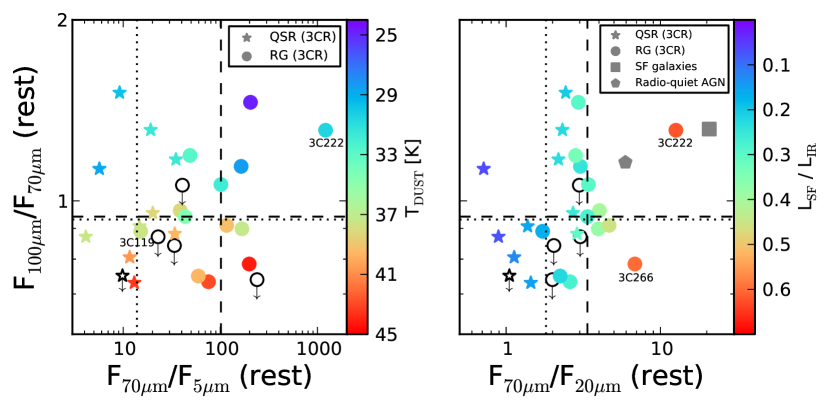
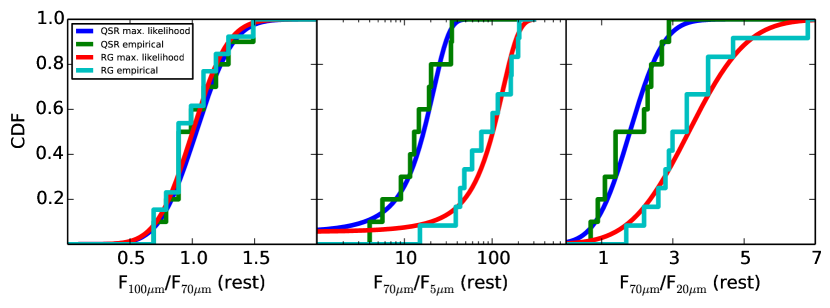
In Fig. 1 we show infrared color-color diagrams for this sample of 13 RGs and 10 QSRs. The distributions of F100μm/F70μm222monochromatic flux densities are given in units of erg s-1 cm-2 Hz-1 color for RGs and QSRs in Fig. 1 are nearly identical, with median values 0.9. The color coding in Fig. 1 (left) demonstrates that the factor of 2 scatter around the median FIR colors results from differences in the cold dust temperatures of individual objects, which range from to K (Podigachoski et al., 2015). The emission from hosts with dust temperatures 33 K peaks at wavelengths 70 m resulting in F100μm/F70μm 1. We apply both maximum likelihood and empirical methods to statistically compare the measured RG and QSR F100μm/F70μm colors. Assuming that the colors are normally distributed, we compute the parameters of the distributions which maximize the probability of measuring such colors. The means and standard deviations of these maximum likelihood distributions are 1.0 and 0.2, respectively, for both the RGs and QSRs. The corresponding maximum likelihood cumulative distribution functions and the empirical (measured) cumulative distributions are presented in Fig. 2 (left). The Kolmogorov-Smirnov (KS) test reveals that the two samples are drawn from the same distribution (KSstatistic=0.07, p=1). We conclude that the FIR colors of these 3CR RGs and QSRs are indistinguishable (i.e., orientation invariant), as expected in the unification model for AGN host galaxies with similar star formation rates.
In contrast, the RGs and QSRs show clear separation in their F70μm/F5μm colors (Fig. 1, left): their median colors are 101.4 and 13.9, respectively. One RG, 3C 119, has colors which overlap the QSRs in Fig. 1 (left), not surprisingly, because 3C 119 is a well-known (de Vries et al., 1997) borderline source where some of the hot dust is visible, and the UV/visible AGN continuum is only partly hidden. The 5 m emission of another RG, 3C 222, is only weakly constrained (Podigachoski et al., 2015), resulting in an unusually red F70μm/F5μm color for this object. Considering this particular value as an upper limit, we obtain KSstatistic=0.92 (p=510-5), and maximum likelihood distributions as plotted in Fig. 2 (middle). These clearly different distributions are driven by the differences between the RG and QSR SEDs at 5 m. RGs are fainter than QSRs at 5 m, as expected if their hot inner torus dust emission is obscured due to its edge-on viewing angle (Haas et al., 2008; Leipski et al., 2010; Dicken et al., 2014). Our results support the hypothesis that F70μm/F5μm to a large extent reveals the level of obscuration in powerful radio-loud objects, and as such is an orientation indicator for that AGN population. However, intrinsic differences in this ratio for individual objects are not ruled out, and may contribute to the observed scatter.
Although our adopted SED-fitting approach is physically grounded and provides us with a close approximation of the objects’ infrared SEDs, we further explore the robustness of the results presented above without using dust emission models. To this end, we employ a simple (model-independent) linear interpolation of the observed flux values to obtain the rest-frame colors and create the color-color diagrams. We apply this method to the sample of objects detected in at least three Herschel bands, and find that the RGs and QSRs remain clearly separated in the F70μm/F5μm color, with median values of 83.9 and 12.3, respectively. Their respective median F100μm/F70μm colors (1.0 and 0.9) remain indistinguishable, similarly to the results obtained when following the SED-fitting approach.
In addition to the 23 3CR hosts detected in at least three Herschel bands, seven hosts are detected in only the two PACS bands while remaining below the detection limit in the SPIRE bands. Given the low redshift range () of five of these seven hosts, the PACS 160 m band probes their cold dust emission at rest-frame 70 m allowing their inclusion (empty symbols) in the color-color diagrams presented in Fig. 1. While this inclusion does not change the trends discussed above, their F70μm/F5μm colors tend to be somewhat bluer than the median colors of the 23 objects detected in at least three Herschel bands. This is likely a consequence of their lower levels of star formation (Podigachoski et al., 2015). As such, it is important to note that the present FIR test of unification can directly be applied only to the long wavelength detected, i.e., the star-forming objects from the high- 3CR sample. The 31 remaining hosts from the sample, which are either detected only in the PACS 70 m band or not detected at all, have weak or absent star formation and thus no definitive conclusions can be drawn. Nevertheless, the non-detection fractions at SPIRE 250 m for RGs and QSRs are comparable ( and respectively), and thus do not represent evidence against the unification model.
The high level of obscuration in the MIR prevents the F70μm/F5μm color from directly probing the relative importance of the SF and AGN activity. We therefore use the AGN-powered circumnuclear dust emission at 20 m (near the peak emission from the torus, e.g., Hönig & Kishimoto, 2010), and employ the F70μm/F20μm color to probe the dominant power source in the infrared. As shown in Fig. 1 (right), the F70μm/F20μm RG and QSR colors are closer to each other than the F70μm/F5μm colors, but still have an offset, with median values of 3.4 and 1.8 respectively (KSstatistic=0.65, p=0.01; see Fig. 2, right), confirming that the level of obscuration at 20 m is substantially lower than that at 5 m. The symbols in Fig. 1 (right) are color-coded according to the fractional star formation luminosity, LSF/LIR, as inferred in Podigachoski et al. (2015). This color-coding demonstrates that, despite the strong star formation activity of several hundreds of solar masses per year, the total infrared luminosity of the 3CR hosts is generally dominated by their AGN activity, regardless if that activity is obscured or not (Podigachoski et al., 2015). The only exceptions are two RGs, 3C 266 and 3C 222, which have similar LSF but lower IR AGN luminosities than the other RGs (Podigachoski et al., 2015). However, a general increase in the LSF/LIR ratio of 3CR objects, from to , is observed when progressing to larger F70μm/F20μm values, i.e., to redder colors.
We examine this trend further by comparing the 3CR AGN infrared colors to those of typical star-forming (SF) galaxies where the infrared emission draws uniquely from star formation. The SFR strongly correlates with stellar mass and redshift (Elbaz et al., 2007); we therefore select SF galaxies from Kirkpatrick et al. (2012) with stellar masses and redshifts comparable to those of the 3CR hosts (which have Mstellar 1011 M⊙, e.g., Best et al., 1998; De Breuck et al., 2010). Given that stars in these SF galaxies are formed at rates (Kirkpatrick et al., 2012) comparable to those in the 3CR hosts, the LSF/LIR1 of the SF galaxies are consistent with their red F70μm/F20μm colors (Fig. 1 right). The bluer F70μm/F20μm colors of the powerful 3CR AGN are likely a consequence of the strong torus emission at 20 m. The average cold dust temperature of the SF galaxies is 282 K (Kirkpatrick et al., 2012), hence their FIR colors are also consistent with the temperature trends found for the 3CR hosts. The F70μm/F20μm colors of powerful AGN are offset from those of SF galaxies, and hence, in addition to being indicators of orientation, FIR/MIR colors also distinguish between active and SF galaxies in the most luminous star-forming objects, analogous to the case for local Seyfert galaxies (e.g., de Grijp et al., 1985).
A limitation for the general unification discussion is the fact that radio-loud AGN, such as the 3CR sources investigated here, represent a small () fraction of the complete AGN population. It is therefore important to compare the colors of the powerful 3CR radio-loud AGN to those of powerful radio-quiet AGN. To achieve this, we select a sample of distant ( 1.9), luminous, radio-quiet AGN (L2-10keV 51044 erg s-1) hosted by massive (Mstellar 1011 M⊙) star-forming galaxies, from Kirkpatrick et al. (2012). As shown in Fig. 1 (right) the radio-quiet AGN have F70μm/F20μm colors redder than those of the 3CR RGs, but bluer than those of the SF galaxies. Given that the SF activity in these radio-quiet AGN accounts for 56% of the total infrared luminosity (Kirkpatrick et al., 2012), this finding agrees with the trend of increasing LSF/LIR towards larger F70μm/F20μm values for the 3CR objects discussed above.
4 Conclusion
In conclusion, far- to mid-infrared colors represent a useful diagnostic of the orientation of powerful radio-loud AGN, and support the unification model for these objects. At wavelengths longer than 20 m, where obscuration is a small effect, these colors are also indicators of the relative contributions of star formation and nuclear activity in galaxies. These diagnostics may prove useful in future studies of large samples of dusty star-forming galaxies/AGN to investigate the duty cycle of nuclear activity, feedback, and AGN and galaxy growth.
References
- Antonucci (1993) Antonucci, R. 1993, ARA&A, 31, 473
- Antonucci (2012) Antonucci, R. 2012, Astronomical and Astrophysical Transactions, 27, 557
- Barthel (1989) Barthel, P. D. 1989, ApJ, 336, 606
- Barthel et al. (2012) Barthel, P., Haas, M., Leipski, C., & Wilkes, B. 2012, ApJ, 757, LL26
- Best et al. (1998) Best, P. N., Longair, M. S., & Roettgering, H. J. A. 1998, MNRAS, 295, 549
- Best & Heckman (2012) Best, P. N., & Heckman, T. M. 2012, MNRAS, 421, 1569
- Cleary et al. (2007) Cleary, K., Lawrence, C. R., Marshall, J. A., Hao, L., & Meier, D. 2007, ApJ, 660, 117
- De Breuck et al. (2010) De Breuck, C., Seymour, N., Stern, D., et al. 2010, ApJ, 725, 36
- de Grijp et al. (1985) de Grijp, M. H. K., Miley, G. K., Lub, J., & de Jong, T. 1985, Nature, 314, 240
- de Vries et al. (1997) de Vries, W. H., O’Dea, C. P., Baum, S. A., et al. 1997, ApJS, 110, 191
- Dicken et al. (2014) Dicken, D., Tadhunter, C., Morganti, R., et al. 2014, ApJ, 788, 98
- Donley et al. (2012) Donley, J. L., Koekemoer, A. M., Brusa, M., et al. 2012, ApJ, 748, 142
- Drouart et al. (2014) Drouart, G., De Breuck, C., Vernet, J., et al. 2014, A&A, 566, AA53
- Elbaz et al. (2007) Elbaz, D., Daddi, E., Le Borgne, D., et al. 2007, A&A, 468, 33
- Griffin et al. (2010) Griffin, M. J., Abergel, A., Abreu, A., et al. 2010, A&A, 518, LL3
- Haas et al. (2004) Haas, M., Müller, S. A. H., Bertoldi, F., et al. 2004, A&A, 424, 531
- Haas et al. (2008) Haas, M., Willner, S. P., Heymann, F., et al. 2008, ApJ, 688, 122
- Hes et al. (1995) Hes, R., Barthel, P. D., & Hoekstra, H. 1995, A&A, 303, 8
- Hönig & Kishimoto (2010) Hönig, S. F., & Kishimoto, M. 2010, A&A, 523, AA27
- Kirkpatrick et al. (2012) Kirkpatrick, A., Pope, A., Alexander, D. M., et al. 2012, ApJ, 759, 139
- Kirkpatrick et al. (2013) Kirkpatrick, A., Pope, A., Charmandaris, V., et al. 2013, ApJ, 763, 123
- Lacy et al. (2004) Lacy, M., Storrie-Lombardi, L. J., Sajina, A., et al. 2004, ApJS, 154, 166
- Leipski et al. (2010) Leipski, C., Haas, M., Willner, S. P., et al. 2010, ApJ, 717, 766
- Meisenheimer et al. (2001) Meisenheimer, K., Haas, M., Müller, S. A. H., et al. 2001, A&A, 372, 719
- Ogle et al. (2006) Ogle, P., Whysong, D., & Antonucci, R. 2006, ApJ, 647, 161
- Ogle et al. (2012) Ogle, P., Davies, J. E., Appleton, P. N., et al. 2012, ApJ, 751, 13
- Pilbratt et al. (2010) Pilbratt, G. L., Riedinger, J. R., Passvogel, T., et al. 2010, A&A, 518, LL1
- Podigachoski et al. (2015) Podigachoski, P., Barthel, P. D., Haas, M., et al. 2015, A&A, 575, AA80
- Poglitsch et al. (2010) Poglitsch, A., Waelkens, C., Geis, N., et al. 2010, A&A, 518, LL2
- Rowan-Robinson (1995) Rowan-Robinson, M. 1995, MNRAS, 272, 737
- Schweitzer et al. (2006) Schweitzer, M., Lutz, D., Sturm, E., et al. 2006, ApJ, 649, 79
- Singal (1993) Singal, A. K. 1993, MNRAS, 262, L27
- Spinrad et al. (1985) Spinrad, H., Marr, J., Aguilar, L., & Djorgovski, S. 1985, PASP, 97, 932
- Stern et al. (2005) Stern, D., Eisenhardt, P., Gorjian, V., et al. 2005, ApJ, 631, 163
- Tadhunter et al. (2014) Tadhunter, C., Dicken, D., Morganti, R., et al. 2014, MNRAS, 445, L51
- Urry & Padovani (1995) Urry, C. M., & Padovani, P. 1995, PASP, 107, 803
- van Bemmel et al. (2000) van Bemmel, I. M., Barthel, P. D., & de Graauw, T. 2000, A&A, 359, 523
- Werner et al. (2004) Werner, M. W., Roellig, T. L., Low, F. J., et al. 2004, ApJS, 154, 1
- Wilkes et al. (2013) Wilkes, B. J., Kuraszkiewicz, J., Haas, M., et al. 2013, ApJ, 773, 15
| Name | Type | F70μm/F5μm | F70μm/F20μm | F100μm/F70μm | TDUST [K] | LSF/LIR | |
|---|---|---|---|---|---|---|---|
| 3C 002 | QSR | 1.04 | 19.2 | 2.3 | 1.3 | 31.6 | 0.23 |
| 3C 014 | QSR | 1.47 | 4.1 | 0.9 | 0.9 | 37.5 | 0.08 |
| 3C 068.2 | RG | 1.57 | 163.7 | 3.0 | 1.1 | 28.5 | 0.25 |
| 3C 119 | RG | 1.02 | 15.1 | 1.7 | 0.9 | 37.6 | 0.17 |
| 3C 124 | RG | 1.08 | 101.4 | 3.4 | 1.1 | 31.9 | 0.30 |
| 3C 190 | QSR | 1.20 | 34.9 | 2.2 | 1.2 | 31.7 | 0.23 |
| 3C 205 | QSR | 1.53 | 11.7 | 1.1 | 0.8 | 40.7 | 0.13 |
| 3C 222 | RG | 1.34 | 1212.7 | 12.6 | 1.3 | 30.6 | 0.62 |
| 3C 245 | QSR | 1.03 | 5.7 | 0.7 | 1.1 | 28.8 | 0.07 |
| 3C 256 | RG | 1.82 | 75.6 | 2.6 | 0.7 | 43.0 | 0.27 |
| 3C 257 | RG | 2.47 | 38.6 | 4.0 | 1.0 | 38.2 | 0.40 |
| 3C 266 | RG | 1.27 | 198.3 | 6.8 | 0.8 | 44.2 | 0.60 |
| 3C 270.1 | QSR | 1.52 | 13.0 | 1.4 | 0.7 | 43.5 | 0.15 |
| 3C 297 | RG | 1.41 | 204.5 | 2.9 | 1.5 | 24.9 | 0.30 |
| 3C 298 | QSR | 1.44 | 14.7 | 1.4 | 0.9 | 37.5 | 0.16 |
| 3C 305.1 | RG | 1.13 | 43.4 | 3.4 | 0.9 | 34.7 | 0.28 |
| 3C 318 | QSR | 1.57 | 34.0 | 2.9 | 0.9 | 39.6 | 0.31 |
| 3C 324 | RG | 1.21 | 59.3 | 2.2 | 0.7 | 39.6 | 0.23 |
| 3C 368 | RG | 1.13 | 166.8 | 4.0 | 0.9 | 37.3 | 0.38 |
| 3C 432 | QSR | 1.80 | 9.2 | 2.4 | 1.5 | 29.8 | 0.21 |
| 3C 454.0 | QSR | 1.76 | 20.2 | 2.7 | 1.0 | 38.3 | 0.26 |
| 3C 454.1 | RG | 1.84 | 116.4 | 4.7 | 0.9 | 39.3 | 0.45 |
| 3C 470 | RG | 1.65 | 48.4 | 2.8 | 1.2 | 32.8 | 0.34 |
| Objects detected in only two Herschel bands | |||||||
| 3C 013 | RG | 1.35 | 238.8 | 2.0 | 0.7 | ||
| 3C 210 | RG | 1.17 | 40.7 | 3.0 | 1.1 | ||
| 3C 220.2 | QSR | 1.16 | 9.8 | 1.0 | 0.8 | ||
| 3C 356 | RG | 1.08 | 33.7 | 2.0 | 0.8 | ||
| 3C 469.1 | RG | 1.34 | 22.9 | 3.0 | 0.9 | ||