Towards Real-Time Detection and Tracking of Spatio-Temporal Features: Blob-Filaments in Fusion Plasma
Abstract
A novel algorithm and implementation of real-time identification and tracking of blob-filaments in fusion reactor data is presented. Similar spatio-temporal features are important in many other applications, for example, ignition kernels in combustion and tumor cells in a medical image. This work presents an approach for extracting these features by dividing the overall task into three steps: local identification of feature cells, grouping feature cells into extended feature, and tracking movement of feature through overlapping in space. Through our extensive work in parallelization, we demonstrate that this approach can effectively make use of a large number of compute nodes to detect and track blob-filaments in real time in fusion plasma. On a set of 30GB fusion simulation data, we observed linear speedup on 1024 processes and completed blob detection in less than three milliseconds using Edison, a Cray XC30 system at NERSC.
Index Terms:
Big data analytics, spatio-temporal feature, real-time detection and tracking, blob-filaments, fusion plasma.1 Introduction
Awide variety of “big data” such as simulations of diesel combustion and images of tissue from biopsy, are spatiotemporal in nature [1, 2]. When analyzing these data sets, a common task is to find coherent structure in space and time, for example, ignition kernels in combustion, and cancerous cells in medical images. There are many possible approaches to identify such a feature based on the application requirements [3, 4, 5, 6]. However, when faced with tight time constraints many of these techniques are too slow to produce an satisfactory answer.
Our work was originally motivated by the need to detect spatio-temporal feature associated with instabilities in fusion plasma. Magnetic confinement fusion has the potential to be an inexhaustible source of clean energy; and billions of dollars have been invested in developing fusion reactors, like the ITER project [7]. However, steady-state plasma confinement is often interrupted by blob filaments driven by the edge turbulence. A blob filament (or blob) is a magnetic-field-aligned plasma structure that appears near the edge of the confined plasma, and has significantly higher density and temperature than the surrounding plasma [8]. Blobs can also be considered as outliers because they are rare events that convect filaments of plasma outwards towards the containment wall, causing substantial heat loss, degradation of the plasma confinement, and erosion of the containment wall. By identifying and tracking these blob filaments from fusion plasma data streams, physicists can improve their understanding of the dynamics and interactions of such coherent structures (blobs) with edge turbulence.
Fusion experiments and simulations could easily produce many terabytes per second; and features such as blobs have to be detected in milliseconds in order for the control system to have a chance to take mitigating actions. Though there are many well known feature extraction methods for detecting outliers, they often have some shortcomings. Classical multi-dimensional outlier detection techniques are designed to detect global outliers. However, these techniques do not distinguish between non-spatial attributes and spatial attributes and do not consider apriori information about the statistical distribution of the data [9]. Since spatio-temporal data types have unique characteristics and their relations are more complicated than ordinary data, dedicated outlier detection techniques are typically required to examine anomalies in data across space and time[5]. In this work, we propose an approach for detecting and tracking spatio-temporal features such as blobs by breaking down the process into three steps: (1) find cells that satisfying application specific requirements, (2) group cells into spatial features, and (3) track features by the amount of overlap in space. By varying the first step, this procedure could be applying to different applications. Earlier, this approach was applied to data from regular meshes [10, 2]. In this work, we will demonstrated that it can also be effectively applied to irregular mesh data.
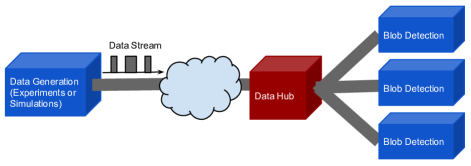
This work addresses several challenges exemplified by the detection of blobs in fusion plasma. First off, fusion experiments and numerical simulations can easily generate massive amounts of data per run. During a magnetic fusion device experiment (or ”shot”), terabytes of data are generated over short time periods (on the order of hundreds of seconds). In the XGC1 fusion simulation [11, 12], a few tens of terabytes can be generated per second. Timely access to this amount of data can already be a challenge [13, 14], but analyzing all this data in real time is impractical. Currently, there are three types of analyses in most of fusion experiments: in-shot-analysis, between-shot-analysis, and post-run-analysis. All existing blob detection methods address post-run-analysis, but in this work, we focus on the more challenging first two cases to provide a real-time analysis so that scientists can monitor the progress of fusion experiments. Figure 1 presents a real-time analysis frame for finding blob-filaments in fusion plasma data streams. To perform this data analysis in real time, we utilize effectively modern supercomputers to address the high volume and velocity challenges arising from fusion plasma big data.
This work has been integrated into the International Collaboration Framework for Extreme Scale Experiments (ICEE), a wide-area in-transit data analysis framework for near real-time scientific applications [15]. ICEE takes advantage of an efficient IO solution ADIOS [16], and a cutting-edge indexing solution FastBit [10], to design and construct a real-time remote data processing framework over wide-area networks for international collaborations such as the ITER project. In this system, a blob detection algorithm is used to monitor the health of fusion experiments at the Korea Superconducting Tokamak Advanced Research (KSTAR). However, existing data analysis approaches are often single-threaded, only for post-run analysis, and take a long time to produce results. Also, compared to the simulation data, the resolution of the raw camera data may be coarse, but interesting features can still be identified after normalization. In order to meet real-time feedback requirement, we develop a real-time blob detection method, which can leverage in-situ raw data in the ICEE server and find blob-filaments efficiently during fusion experiments. Our blob detection algorithm is not limited to KSTAR only, and can be applied to other fusion experiments and simulations.
In this research, we apply the three-step approach to detect and track blob structures in fusion data, with the goal of achieving millisecond response time on terabytes of data. With this response space, it is possible for the control system of the magnetic confinement fusion reactor to implement mitigating strategies in real time. To the best of our knowledge, this is the first time a blob detection method could satisfy the millisecond time requirement. Additional contributions of this work include:
-
•
We illustrate how to adopt the three-step approach to detect and track blob-filaments as an example of spatial-temporal feature on an irregular mesh.
-
•
We propose a two-phase region outlier detection method for finding blob-filaments. In the first phase, we apply a distribution-based outlier detection scheme to identify blob candidate points. In the second phase, we adopt a fast two-pass connected component labeling (CCL) algorithm from [17] to find different region outliers on an irregular mesh.
-
•
We develop a high-performance blob detection approach to meet real-time feedback requirements by exploiting many-core architectures in a large cluster.
-
•
We propose a scheme to efficiently track the movement of region outliers by linking the centers of the region outlier over consecutive frames.
-
•
We have implemented our blob detection algorithm with hybrid MPI/OpenMP, and demonstrated the effectiveness and efficiency of our implementation with a set of data from the XGC1 fusion simulations. Our tests show that we can achieve linear time speedup and complete blob detection in two or three milliseconds using a cluster at NERSC. In addition, we demonstrate that our method is more robust than recently developed state-of-the-art blob detection methods in [18, 19].
The rest of paper is organized as follows. In Section II, we give the problem formulation of the blob detection and discuss related work. In Section III we describe in detail our three-step approach consisting of a two-phase region outlier detection algorithm and a tracking scheme for identifying and tracking blobs. We then present a real-time blob detection approach by leveraging MPI/OpenMP parallelization in a large cluster in Section IV. The blob detection and tracking results and its real time evaluation are shown in Section V. We conclude the paper, and give our future plans in Section VI.
2 Problem Definition and Related Work
In this section, we introduce our problem definition and discuss previous work related to our study. For related work, we first discuss existing research work on outlier detection, and then review previous work on blob detection in fusion plasma domain.
2.1 Problem Definition
Extracting spatial-temporal features play an important role in analyzing scientific and engineering applications, including behavior recognition [20], bioinformatics [21], video analysis c[22], and health informatics [23]. Depending on the applications, mining spatial features in one time frame and relationships among spatial objects in and across time frames are extremely challenging tasks due to three reasons. First, the extent and shape of a feature could be an important indicator in determining its influence. However, due to various data type (regular and irregular), it is not easy to apply a generic approach for all applications. Second, effectively incorporating the temporal information in the overall analysis is a necessity to uncover interesting upcoming events. Finally, how to process very large data sets in real time demands appropriately responding to extreme scale computing and big data challenges. In this work, we attack this problem by presenting a three-step approach for detecting and tracking spatio-temporal features in the context of blob-filament detection in fusion plasma.
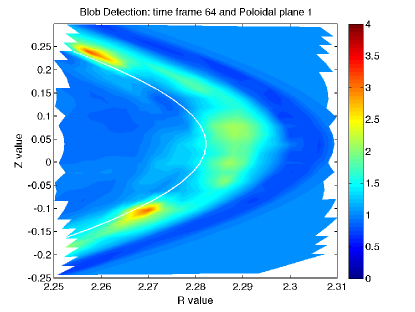
The definition of a blob is varied in the literature depending on fusion experiments or simulations as well as available diagnostic information for measurements [8]. This makes blob detection a challenging task. Figure 2 plots local normalized density distribution in the regions of interest in one time frame. We can observe that there are two reddish spots located at the left portion of the figure, which are associated with blob-filaments and are significantly different from their surrounding neighbors. It is clear that a reddish spot is not a single point but a group of connected points or a region. Therefore, we formulate the blob detection problem as a region outlier detection problem. Similar to the spatial outlier [9], a region outlier is a group of spatial connected objects whose non-spatial attribute values are significantly different from those of other spatial surrounding objects in its spatial neighborhood. Figure 2 shows blobs are region outliers. The number of region outliers detected is determined by pre-defined criteria provided by domain experts.
The problem is to design an efficient and effective approach to detect and track different shapes of region outliers simultaneously in fusion plasma data streams. By identifying and monitoring these blob-filaments (region outliers), scientists can gain a better understanding about this phenomena. In addition, a data stream is an ordered sequence of data that arrives continuously and has to be processed online. Due to the high arrival rate of data, the blob detection must finish processing before the next data chunk arrives [24]. Therefore, another critical problem is to develop a high-performance blob detection approach in order to meet the real-time requirements.
2.2 Outlier Detection
The problem of outlier detection has been extensively studied and can be generally classified into four categories: distance-based, density-based, clustering-based, and distribution-based approaches [25, 3].
Distance-based methods [26] use a distance metric to measure the distances among data points. If the number of data points within a certain distance from the given point is less than pre-defined threshold, then this point is determined as an outlier. This approach could be very useful with accurate pre-defined threshold. However, it may not be proper to use a simple threshold if different densities in various regions of the data exhibit across space or time.
Density-based methods [27] assign a local outlier factor (LOF) to each sample based on their local density. The LOF determines the degree of outlierness, where samples with high LOF value are identified as outliers. This approach does not require any prior knowledge of underlying distribution of the data. However, it has a high computational complexity since pair-wise distances have to be computed to obtain each local density value.
Clustering-based methods [28] conduct clustering-based techniques on the sample points of the data to characterize the local data behavior. Since this method does not focus on outlier detection, the outliers are produced as by-products and it is not optimized for outlier detection.
Distribution-based methods [9] applies machine learning techniques to estimate a probability distribution over the data and develop a statistical test to detect outliers. These methods use all dimensions to define a neighborhood for comparison and typically do not distinguish non-spatial attributes from spatial attributes.
In the context of data streams, a line of research has been devoted to develop efficient outlier detection techniques [29, 30, 31, 32, 33, 24]. But their main focus is to solve the problem of event detection in sensor network [29], query processing [32, 30], clustering [31], and graph outliers [33]. Therefore, these methods cannot be easily generalized to region outlier detection problems. In addition, the problem of blob detection presents a special challenge, because the spatiotemporal attributes of the blob-filaments has to be considered together to study their various characteristics including speed, direction, movement, and size. More importantly, these methods are mostly single-threaded which cannot cope with real-time requirements in fusion plasma.
A number of distributed outlier detection methods have also been studied in [29, 34, 35, 36, 37]. Most of these methods are seeking an efficient way to parallelize classical outlier detection methods such as distance-based outliers [37, 35], distribution-based outliers [29], density-based outliers [35], density-based outliers [36], and PCA-based techniques [34]. However, there methods are not generally applicable to region outlier detection and tracking. In particular, in order to tackle high volume and velocity challenges arising from fusion plasma big data, specialized outlier detection scheme and suitable high performance computing technique are demanded to complete blob detection in the order of milliseconds.
In the first two steps of our proposed approach, we apply distribution-based outlier detection to detect outlier points by considering only non-spatial attributes and then leverage fast CCL to construct the region outliers by taking into account spatial-attributes. We choose distribution-based outlier detection since it can solve the problem of finding outliers efficiently if an accurate approximation of a data distribution can be properly found [9, 29]. Normally the distribution of the stream data may change over time [5]. However, this assumption may not hold in fusion experiments since a fusion experiment lasts very short time period from a few seconds to hundreds of seconds. Therefore, we consider the simpler problem of fixed distribution parameters, noting that several fusion devices have shown similar distribution functions of blob events. Then we can perform exploratory data analysis to compute best fitted distribution parameters offline and then build an accurate online distribution model. We leave the more complicated problem of real-time distribution estimation for future work.
2.3 Blob Detection in Fusion Plasma
Independently, fusion blob detection problems have been researched by the physics community in the context of coherent structures in fusion plasma [8]. Various post-run blob detection methods have been proposed to identify and track these structures, to study the impact of the size, movement and dynamics of blobs. A plasma blob is most commonly determined by some threshold, computed statistically in the local plasma density signal [38, 39, 40]. However, the exact criteria have varied from one experiment to another, which reflects the intrinsic variability and complexity of the blob structures. In [38], a conditional averaging approach is applied to analyze spatio-temporal fluctuation data. When the vorticity is larger than one standard deviation at some time frame, a blob is considered to be detected by the probe. In [39], the conditional averaging technique is also used to study the evolution of the blob-filaments using Langmuir probes and a fast camera.
Without using a conditional averaging technique, [40] searches for blob structures can be done using local measurements of the 2D density data obtained from a 2D probe array. Identification of a blob is based on the choices of several constraints such as the threshold intensity level, the minimum distance of blob movement, and the maximum allowed blob movement between successive frames. The trajectories of the different blobs can be computed with the blob centers based on identification results in each time frame. The seminal work by Zweben, et. al.[40] was the first attempt to take only individual time frame data into account to detect blobs and track their movements, although the process of identification of a blob was somewhat arbitrary and oversimplified.
Due to the emergence of fast cameras and beam emission spectroscopy in the last decade, the situations of insufficient diagnostic access and limited spatial and temporal resolution have been greatly improved. In the context of computer version, a number of methods have been developed to tackle blob detection problem, which is aimed to detect points or regions in the image that either brighter or darker than the surrounding [41]. Among them, scale-space methods based on the Laplacian of Gaussian [42, 43, 44] and Watershed detection methods based on local extrema in the intensity landscape [45] are two main classes of blob detectors. In [46], Love and Kumath made the first attempt to apply an image analysis using Watershed techniques for identifying blobs in fusion plasma. The images are first processed to remove the noise spikes, followed by further smoothing using a Gaussian filter, and then identified by various image segmentation techniques. However, due to noise and lack of a ground truth image, this approach can be sensitive to the setting of parameters, and it is hard to use generic method for all images. In addition, the output from visualization is not convenient to feed into other analysis [2]. The regions of interest computed from this work can be more conveniently fed into other analyses. For instance, one can compute blobs in the regions of interest very quickly and transmit these compact meta information over internet to remote domain scientists for real-time analysis.
Recently, several researchers [18, 47, 19] have developed a blob-tracking algorithm that uses raw fast camera data directly with GPI technique. In [18, 19], they leverage a contouring method, database techniques and image analysis software to track the blob motion and changes in the structure of blobs. After normalizing each frame by an average frame created from roughly one thousand frames around the target time frame, the resulting images are contoured and the closed contours satisfying certain size constraints are determined as blobs. Then, an ellipse is fitted to the contour midway between the smallest level contours and the peak. All information about blobs are added into a SQL database for more data analysis. This method is close to our approach but it can not be used for real-time blob detection since they compute time-averaged intensity to normalize the local intensity. Additionally, only closed contours are treated as blobs, which may miss blobs at the edges of the regions of interest. Finally, these methods are still post-run-analysis, which cannot provide real-time feedback in fusion experiments.
3 Our proposed approach
Given a fusion data stream, which consists of a time ordered sequence of sample frames that arrive continuously from fusion experiments or numerical simulations through remote direct memory access protocols. Our data sets are simulated electron density from the fusion simulation code XGC1 [11, 12]. In the present data sets, simulation data is captured every 2.5 microseconds for a total time window of 2.5 milliseconds. Each point in a time frame has a spatial attribute which defines its location in a triangulated measurement grid, and some non-spatial attributes including all important plasma quantities such as electron density as well as connectivity information in a poloidal plane. The spatial neighborhoods are defined for each point from the connectivity database in a triangulated grid. Formally, an region outlier responding to a blob is defined as a spatial area in the regions of interest where a subset is a group of connected points .
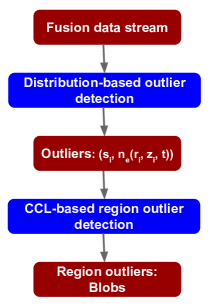
Our overall goal is to develop an approach to detect and track spatial region outliers (blobs) over time using a stream of fusion data. To achieve this, we break down the process into three steps: (1) find outlier points in the region of interests, (2) group these outlier points as different region outliers, and (3) track these regions outliers by the overlapping in space. We address the first two steps by presenting a two-phase approach, as shown in Figure 3. In the first phase, we apply a distribution-based outlier detection algorithm to the fusion data stream in order to detect outlier points which have significantly higher non-spatial attributes than other points. The outputs of this step are tuples , the 2D spatial attributes, and non-spatial attributes such as electron density. These tuples, as well as connectivity information, are used as input for the second phase, where region outlier are detected by applying a fast CCL [17] to efficiently find different connected components on the triangular mesh. The outputs of the CCL-based region outlier detection algorithm are a set of connected components with outlier points inside, which are associated with blobs if some criteria are satisfied. We address the last step by proposing an efficient blob tracking algorithm by leveraging cues from changes of blobs area and distance of center of blobs. Note that, by varying the first step, this procedure could be applying to different applications.
In the following section, we describe the proposed two-phase region outlier detection in detail.
3.1 Distribution-Based Outlier detection
The main task of this phase is to perform efficient outlier detection to determine outlier points which form the region outliers associated with blobs. To facilitate this goal, we propose a novel distribution-based outlier detection algorithm based on the electron density with various criteria for fusion plasma data streams. We separate spatial attributes from non-spatial attributes and consider the statistical distribution of the non-spatial attributes to develop a test based on distribution properties, since it is more suitable for detecting spatial outliers [9]. As claimed in [29], it is very efficient to find outliers by using a data distribution approximation if we estimate the underlying distribution of data accurately. Values for various criteria are determined by domain experts or subjectively by examining the resulting plotting and adjusting them until satisfied.
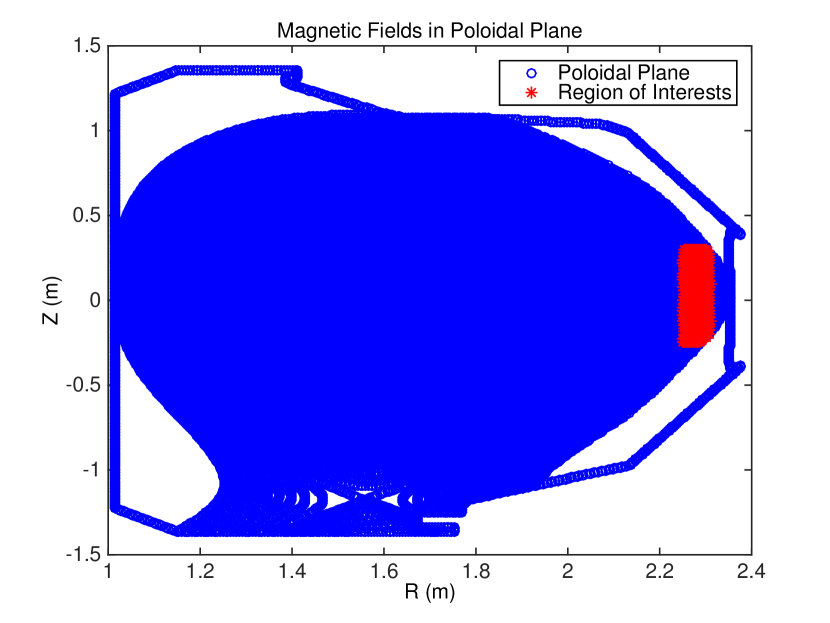
In the proposed outlier detection we firstly preprocess the sample frame to compute needed quantities in the region of interests, as shown in Figure 4(a). Then it is analyzed by normalizing the total electron density (which includes fluctuations) with respect to the initial background electron density, (if using real diagnostic data from, e.g. GPI, actual emission intensity would be used instead of electron density). Note that using the initial time frame as the benchmark is an important factor to achieve real-time blob detection. The normalized electron density in the subsequent time frames can be easily computed, especially compared to the time-average electron density with a long time interval [19].

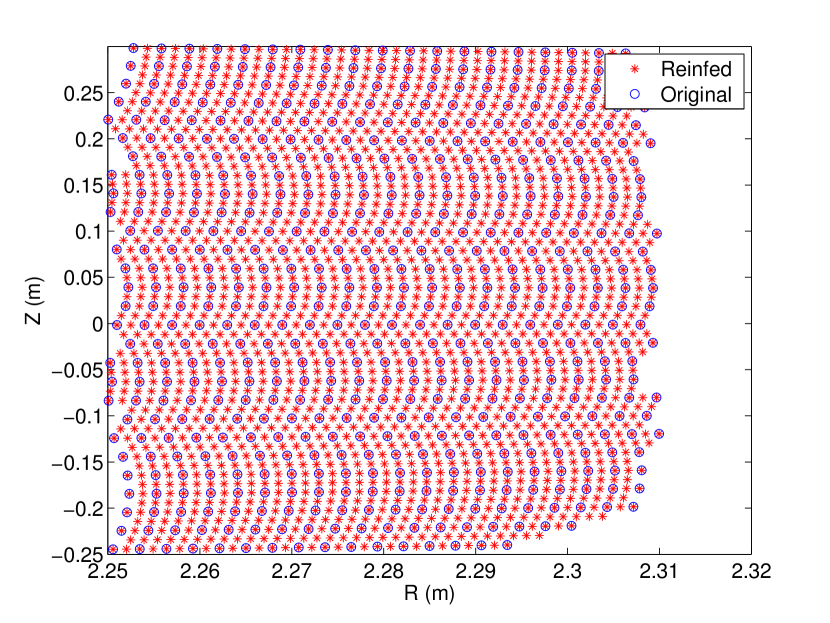
To obtain meaningful region outliers using the CCL method, it is necessary to have fine grained connectivity information. This particular simulation mesh has coarse vertical resolution, so resolution enhancement techniques are applied to generate a higher resolution triangular mesh based on the original triangulated mesh. As shown in Algorithm 1, the resulting triangular mesh is refined to achieve four times better granularity. We split each original triangle into four smaller ones by linking three middle points of the original mesh edges in each triangle. The corresponding density of generated vertices can be obtained using linear interpolation of the original triangular mesh. This step can be applied recursively until the satisfactory resolution of the triangular mesh is computed. Figure 4(b) shows the resulting triangular mesh vertices after applying the triangular mesh refinement algorithm once.
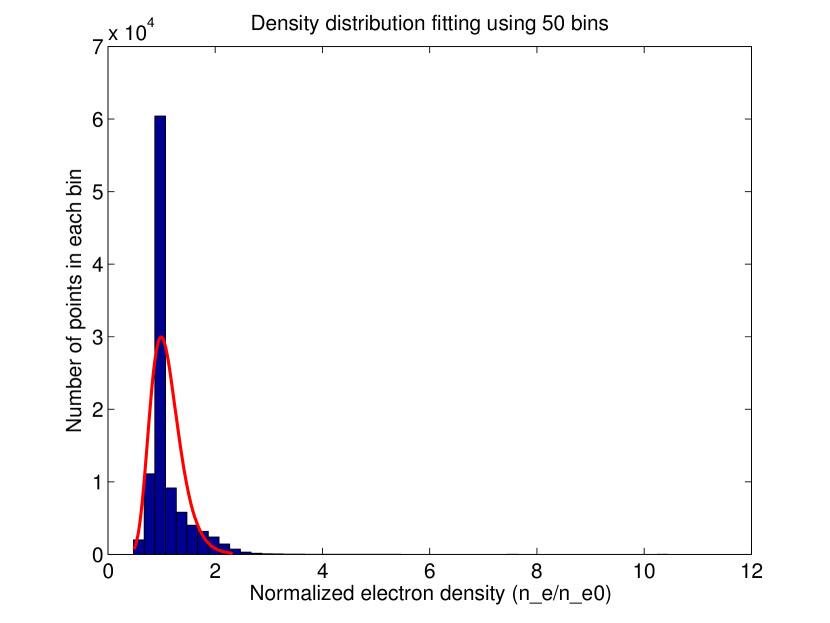
In order to apply an appropriate predefined quantile in two-phase distribution-based outlier detection, it is advised to perform exploratory data analysis to exploit main characteristics of the data sets. Figure 5 reveals that extreme value distribution and log normal distribution are fitted best with one of our sample data sets (after comparing over sixteen different common distributions). After analyzing the underlying distribution, a novel outlier detection is performed to determine outlier points in the regions of interest. The basic idea of the proposed two-step outlier detection is motivated from the observations that there are relatively high density areas (a half banded ellipse area with cyan color) in the edge and several significantly high density small regions (a few small areas with reddish yellow color) in these relatively high density areas, as shown in Figure 2. The proposed outlier detection method extends the previous approach that applies statistical detection with conditional averaging intensity value [38, 39], and applies more intelligent outlier detection with only considering individual time frame data. Compared to traditional single threshold segmentation approach, our approach is more generic, flexible and easier to tune a satisfactory result.
In the first step, the standard deviation and the expected value are computed over all sixteen poloidal planes in one time frame. Using the best fitted distribution, we apply first step outlier detection to identify the relative high density areas with a specified predefined quantile:
| (1) |
where is the normalized electron density, is the multiple of associated to the specified predefined quantile and is the domain in the region of interests. Once the relative high density regions are determined, we compute another standard deviation and the expected value in these areas. Then we employ second step outlier detection to identify the outlier points in the relative high density areas with an appropriately chosen predefined quantile:
| (2) |
where is the multiple of associated to the judiciously chosen confidence level and is the domain of blob candidates. In practice, and can be chosen to be same or different, depending on the characteristics of blob-filaments. In our experience, the value is generally greater than since the standard deviation over the region of interests is much smaller than the standard deviation from the relative high density areas.
However, two-step outlier detection alone cannot be used to distinguish the blob candidates since identified blob candidates may actually have small density, which does not satisfy traditional definition of blobs. Therefore, the density of the mesh points in the outlier points smaller than a certain minimum absolute value criterion need to be filtered out. On the other hand, it is also possible that the middle areas between surrounding plasmas and outlier points have density higher than the given minimum absolute value criterion. Thus, we also apply a minimum relative value criterion to remove these unwanted points. To combine these two rules together, we have a more robust and flexible criterion:
| (3) |
where and are minimum absolute value and minimum relative value respectively, and is the domain of good blob candidates.
3.2 CCL-Based Region Outlier Detection
The main task of the second phase is to apply an efficient connected component labeling algorithm adopted from [17] on a refined triangular mesh to find different blob candidate components. A connected component labeling algorithm generally considers the problem of labeling binary 2D images with either 4-connectedness or 8-connectedness. It performs an efficient scanning technique, and fills the label array labels so that the neighboring object pixels have the same label. Wu [17] presents an efficient two-pass labeling algorithm that is much faster than other state-of-the-art methods and theoretically optimal. However, since we process a refined triangular mesh rather than the traditional 2D images, we have modified their CCL algorithm to take the special features of a triangular mesh into account. As shown in Algorithm 2, each triangle is scanned first rather than a point. Since we know the three vertices in a triangle are connected, we can reduce unnecessary memory accesses once any vertex in a triangle is found to be connected with another vertex in a different triangle. Then we compute the current minimum parent label in this triangle, and assign each vertex a parent label if its label has already filled or a label if its label has not initialized yet. If all three vertices in a triangle are scanned for the first time, then a new label number is issued and assigned to their labels and the associated parent label. After the label array is filled full, we need flatten the union and find tree. Finally, a second pass is performed to correct labels in the label array, and all blob candidates components are found. Note that to perform efficient union-find operations, the union-find data structure is implemented with a single array as suggested in [17].
After all blob candidates are determined, a blob is claimed to be found if the median of a blob candidate component satisfies a certain minimum absolute median value criterion. The reason we are setting this constraint to select the blobs is that the minimum value criterion has to be a reasonably small value in order to produce more blob candidate components. It is possible that if the minimum absolute median value criterion is too large, it may also remove the blobs. On the other hand, it is also possible if this value is too small, it does not have effect on filtering out unwanted components. Therefore, with the same philosophy of measurement, a minimum relative median value criterion is also applied to determine the blobs. However, in order to protect the blobs from being removed due to the extremely large mean value , we also set the maximum absolute median value criterion to limit the power of minimum relative median value criterion. We unify these three rules to be one:
| (4) |
where , and are minimum absolute and relative median values and maximum absolute median value respectively and is the domain of blobs.
3.3 Tracking Region Outliers
The objective of the third step is to track the direction and speed of the detected blobs over time. The blob tracking algorithm has to cope with the problem of tracking multiple region outliers simultaneously even when the blobs merge together or split into separated ones. On the other hand, the blob tracking method should be simple and efficient to meet real-time requirements. To achieve this goal, we propose an efficient blob tracking algorithm by leveraging cues from changes of blobs area and distance of center of blobs. We compute the correspondence between previously tracked blobs and currently detected blobs, and then recover the trajectories of the tracked blobs.
To identify the location center of detected blob, we compute the density-weighted average of the spatial coordinates of each point inside a blob.
| (5) |
where is summation of of all points in a blob. The density-weighted average is used to better capture the center of density of a blob. We track the movement of these detected blobs by linking the centers in consecutive time frames. In order to obtain the boundary of region outliers (blobs), we compute the convex hull [48] of a set of points in a blob. The area of a blob is computed by counting the number of points in a blob.
As shown in Algorithm 3, the input parameters are current detected blobs and the previous blob tracks. The data structure of a blob track is composed of the track ID, the length of track, the area of previous blob, the time-stamps, the center points, the boundary points, and the velocity. There are two heuristics to verify whether a blob is associated with an existing blob track. The first heuristic is based on the fact that the area of a blob between consecutive time frames cannot decrease or increase significantly. The second heuristic takes into account the distance of the centers of a blob does not change dramatically over very short time period (microseconds). The proper thresholds for these two heuristics are provided by domain experts. Since blobs can appear, disappear, merge together or split, a greedy scheme is applied to find the best matching pair of blob and track based on closest distance of the centers of current detected blob and the latest blob in a blob track. Based on computed correspondence between a blob track and the currently detected blobs, existing blob tracks are automatically processed through corresponding operations such as adding a blob into a track, creating a new track, and a track ending. If the length of a track is smaller than 3 consecutive time frames, the track will be treated an anomaly and deleted due to errors in data or inappropriate blob detection thresholds. The speed and direction of the blobs can thus be computed from two consecutive center points. Finally, we can recover the trajectories of the tracked blobs by monitoring the movement of blob centers.
4 A real-time blob detection approach
Existing blob detection approaches cannot tackle the two challenges of the large amount of data produced in a shot and the real-time requirement. In addition, existing data analysis approaches are often operated in a single thread, only for post-run analysis and often take a few hours to generate the results [49]. In order to meet the real-time feedback requirement, we address these challenges by developing a high performance blob detection approach, which can leverage in situ raw data and find blob-filaments efficiently in fusion experiments or numerical simulations.
4.1 A hybrid MPI/OpenMP parallelization
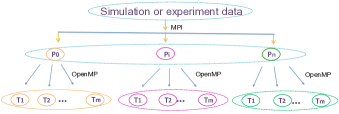
The key idea is to exploit many cores in a large cluster system by running MPI to allocate processes to process the data in one or several time frames at the high level, and by leveraging OpenMP to accelerate the computations using threads at the low level. Figure 6 shows our hybrid MPI/OpenMP parallelization for blob detection. Using this approach, we can complete our blob detection in a few milliseconds with in situ evaluation.
In order to achieve blob detection in real time, the goal is to minimize data movements in the memory and speed up computation. Ideally, the performance is optimal without any communication if we can perform the job correctly. The proposed blob detection algorithm in the previous section supports embarrassingly parallel since we only need the initial time frame and the target time frame to do the computation. This is an important difference between our blob detection method and recently developed methods [18, 19] in terms of real-time requirement. Furthermore, we explore many-core processor architectures to speed up the computation of each MPI task by taking full advantage of multithreading in the shared memory. Therefore, our real-time blob detection approach based on hybrid MPI/OpenMP parallelization is a natural choice and is expected to provide the optimal performance for fusion plasma data streams.
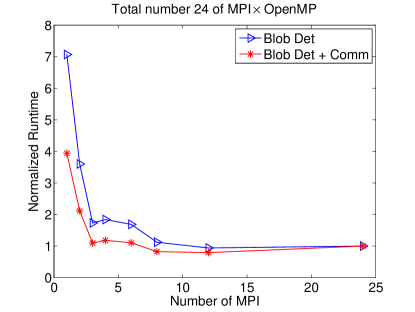
A practical interesting issue is how to tune the number of MPI processes and OpenMP threads for the best performance by taking both analysis speed and memory size into account. As shown in Figure 7, we vary the number of MPI processes and OpenMP threads but fix the total number to be 24 for investigating the performance when processing the same amount of time frames data. A faster analysis speed is achieved when increasing the number of MPI processes since more data frames can be processed simultaneously. On the other hand, the analysis speed remains constant with a few OpenMP threads and degrades with more OpenMP threads due to lack of enough computation in one time frame. However, more OpenMP threads could significantly reduce the memory demands. Therefore, in this study, we choose the number of OpenMP threads to be four for each MPI task, to achieve a good trade off between analysis speed and memory savings.
4.2 Outline of the implementation
We implement our blob detection algorithm in C with a hybrid MPI/OpenMP parallelization. Algorithm 4 summarizes the proposed blob detection algorithm without considering OpenMP. Users can specify the regions of interest by (Rmin, Rmax, Zmin, Zmax), the range of target time frames by (t_start, t_end), and the location of the data sets. However, with in situ evaluation, there is no need to specify the file location since all data are already in memory. We use static scheduling to evenly divide the number of time frames for each MPI task for efficiency. The MPI processes are allocated to process one or several time frames and OpenMP threads are launched to accelerate the computation in one time frame. Note that the MPI process is also the master thread in the runtime environment. At the beginning, the initial time frame data is broadcasted to all MPI processes so that normalization can be performed with new coming time frames. Then each MPI process embarrassingly process the data in each time frame with multithreading in the shared memory. Only detected blobs information are maintained and added into local database. Since these local blobs information are very compact, they can be efficiently transmitted over internet to remote servers for real-time analysis by domain scientists.
5 Experiments and Results
In this section we present experimental evaluations of our blob detection and tracking algorithms, and report the performance of the real-time blob detection under both strong and weak scaling. Before showing experimental results in the next section, we briefly introduce our experimental environment, data sets, and parameter setting in our blob detection and tracking algorithms. We have tested our implementation on the NERSC’s newest supercomputer Edison, where each compute node has two Intel “Ivy Bridge” processors (2.4GHz with 12 cores) and 64 GB of memory. Our base data sets are simulation data sets with 1024 time frames based on the XGC1 simulation [11][12] from the Princeton Plasma Physics Laboratory, which last around 2.5 milliseconds. One of our main goals is that we can control analysis speed by varying the number of processes to complete the blob detection on the entire data set in a time close to 2.5 milliseconds. It would indicate that our algorithm could monitor fusion experiments in real time (neglecting data transfer latency). If we consider internet transfer latency in real experiments or numerical simulation, the system needs at least 1 to 25 milliseconds to transfer one time frame data depending on size of data, which may give us more time for data analysis.
Another goal is to validate the effectiveness of the proposed algorithms. In Algorithm 4, we apply various criteria to identify the blobs. The parameters for blob detection and tracking in our experiments are given in Table I. One criterion we have not mentioned in the previous section is parameter “minArea”. This parameter is used to decide how many points a blob should have, which is used to remove impossibly small blobs. In our experiment, this parameter is set to three since there are at least three vertices connected as a 2D component in a triangular mesh. Another criteria are parameters “maxFrames” and “minFrames”, which are used to control the length of a blob track and remove noisy tracks. It is important to note that these parameters need to be tuned in order to achieve optimal performance in different fusion experiments or numerical simulations. The reasons for this uncertainty in the context of blob detection are from the intrinsic variability and complexity of the blob structures observed in different experiments [8].
| detection criteria | tracking criteria | ||
|---|---|---|---|
| minArea | 3 | maxAreaChange | 25 |
| minRden () | 1.2 | maxJump | 0.04 |
| minAbsden () | 2.05 | maxFrames | 100 |
| maxAbsMden () | 2.75 | minFrames | 3 |
| minMden () | 1.3 | ||
| minAbsMden () | 2.15 | ||
5.1 Performance comparison
We first conduct experiments to compare our method with recently developed state-of-the-art blob detection methods in [18, 19]. Since their methods are based on the contouring methods and thresholding, we call their methods the contouring-based methods. We have to point out that strictly quantitative comparisons are not possible since the blob itself is not well-defined [8]. Due to this reason, there are rarely direct comparisons between any new proposed method and existing ones in the literature in the domain of fusion plasma [38, 39, 40, 49, 46, 18, 47, 19]. However, in order to demonstrate that our methods is more robust than the contouring-based methods, we compare these two methods in two typical cases to shed light on their performance in terms of the detection accuracy.
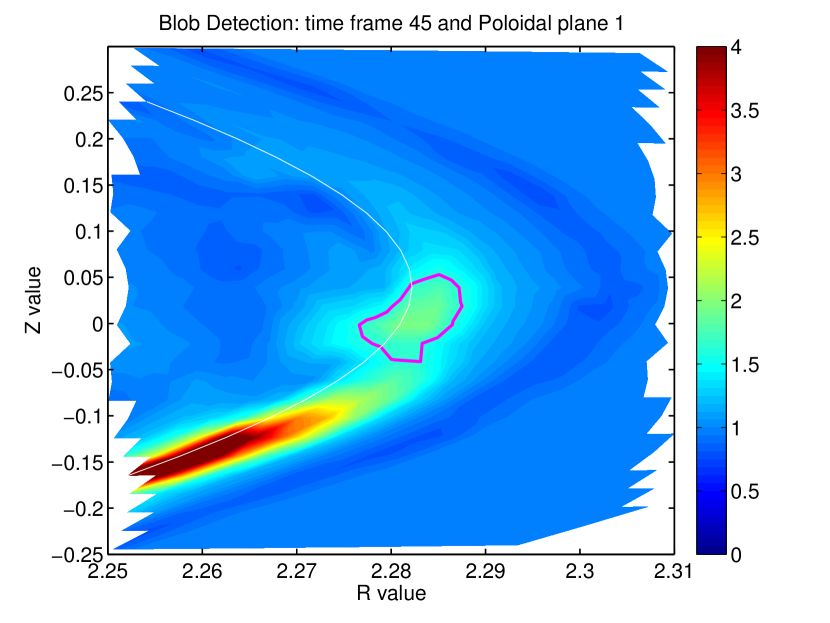
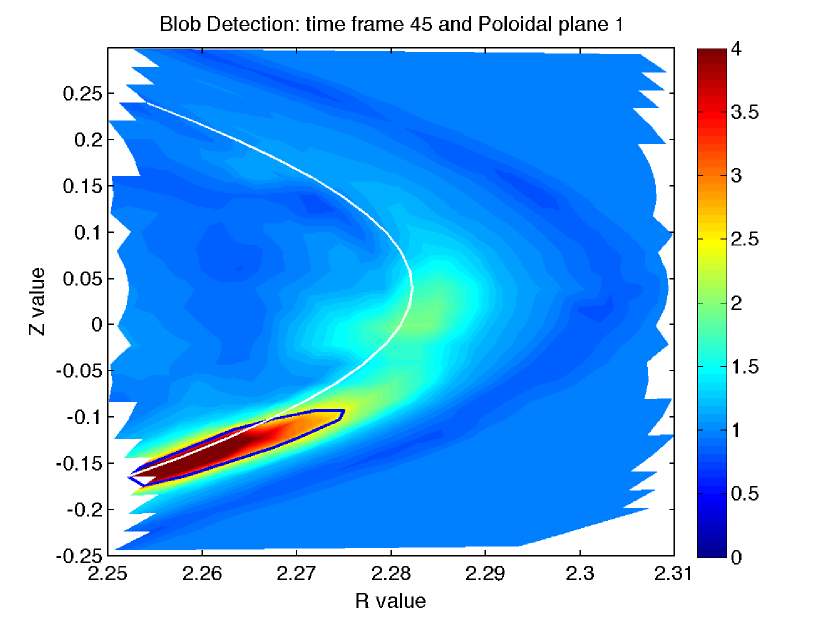
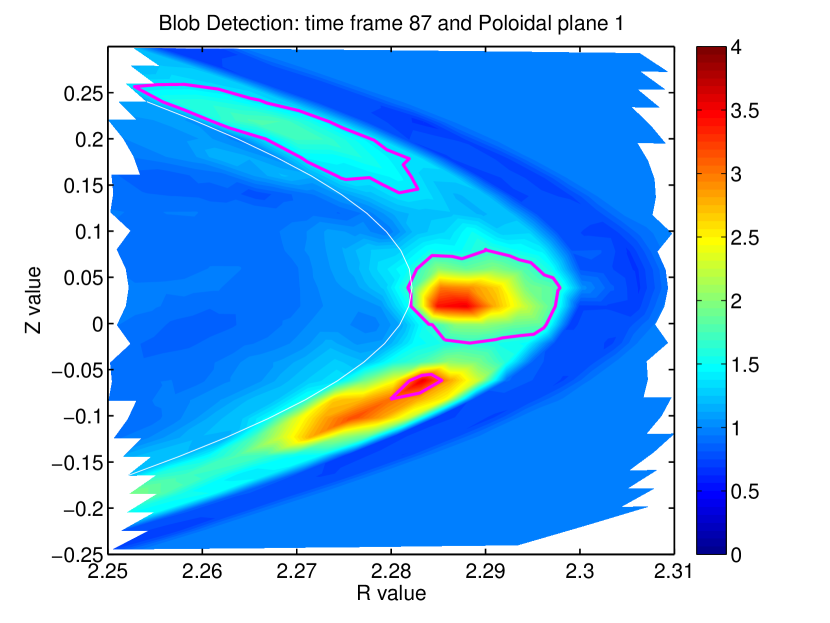
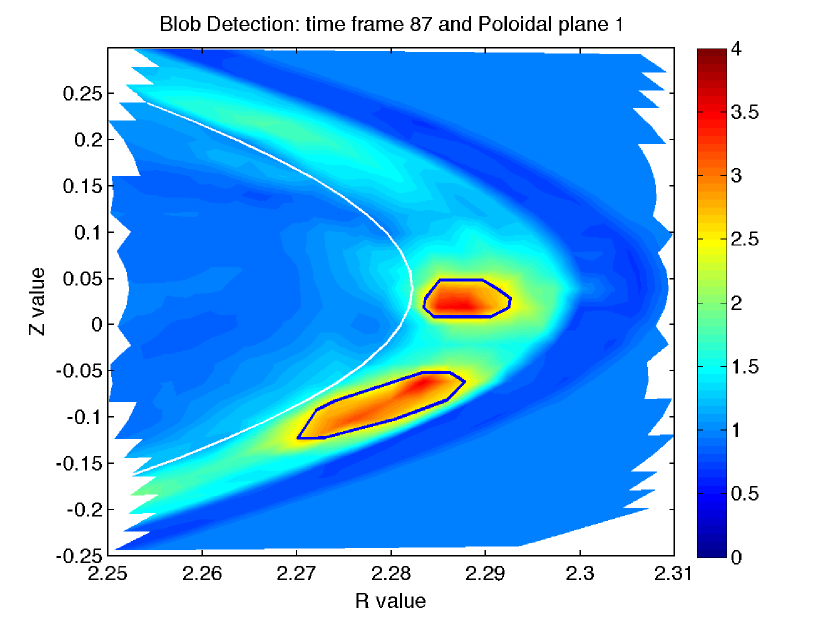
Figure 8 shows the comparison of the blob detection results between our region outlier detection method and the contouring-based methods in two different time frames. As shown in Figures 8(a) and 8(b), we can see that our region outlier detection method does not miss detecting the blob at the edge of the regions of interest while the contouring-based methods fail the detection. The reason is that the contouring-based methods require the computed contours are closed, which do not exist at the edge of the regions of interest. In Figures 8(c) and 8(d), we notice that our region outlier detection method can accurately detect all blobs. However, the contouring-based methods either yield the blobs with incorrect areas (much larger or smaller), or misdetect the wrong area as a blob. This is because that it is hard to use one single threshold to identify the blobs for various time frames even in the same experimental data. Our region outlier detection method does not have such problem since we use more flexible distribution-based outlier detection.
5.2 More blob detection results
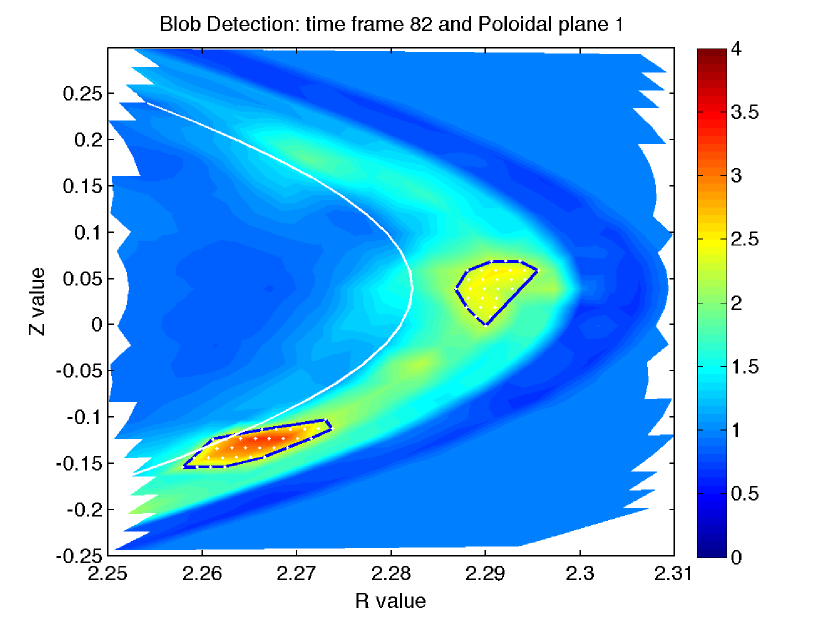
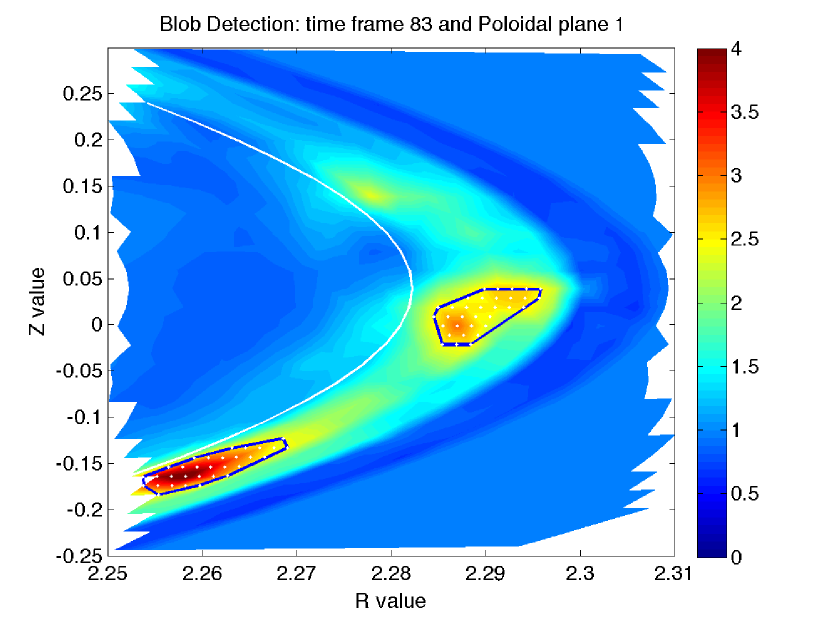
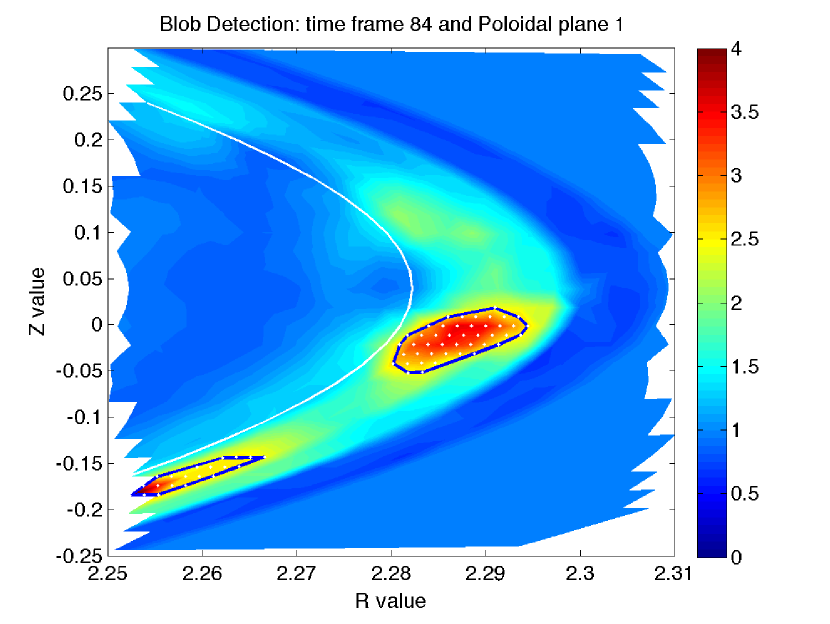
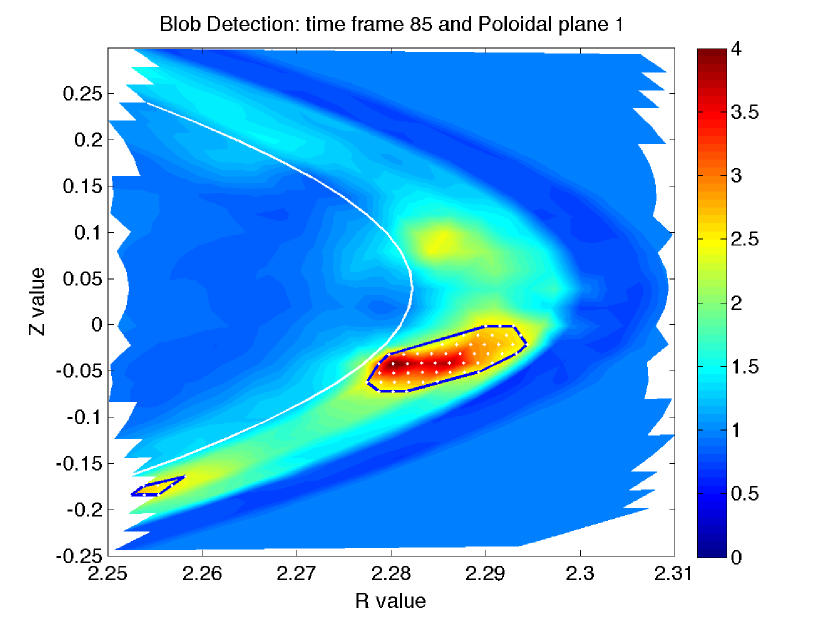
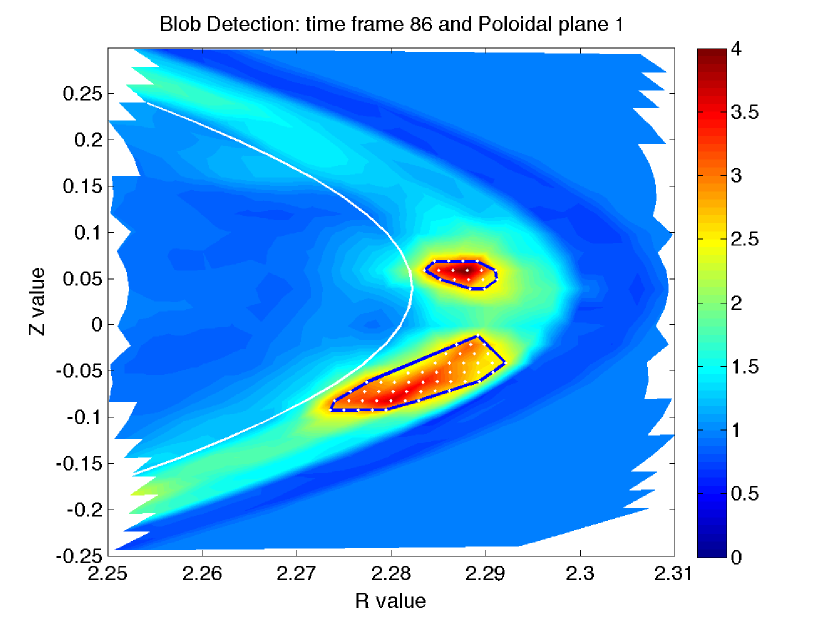
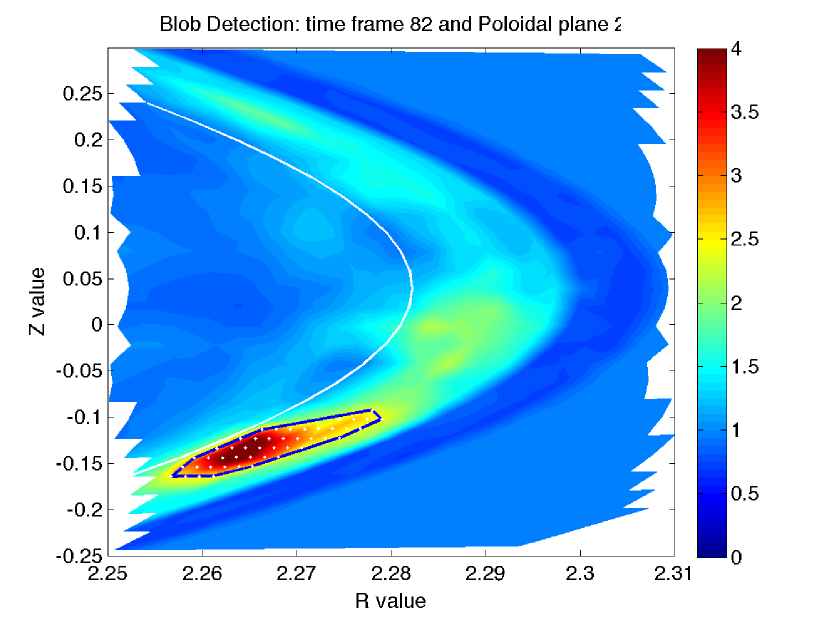
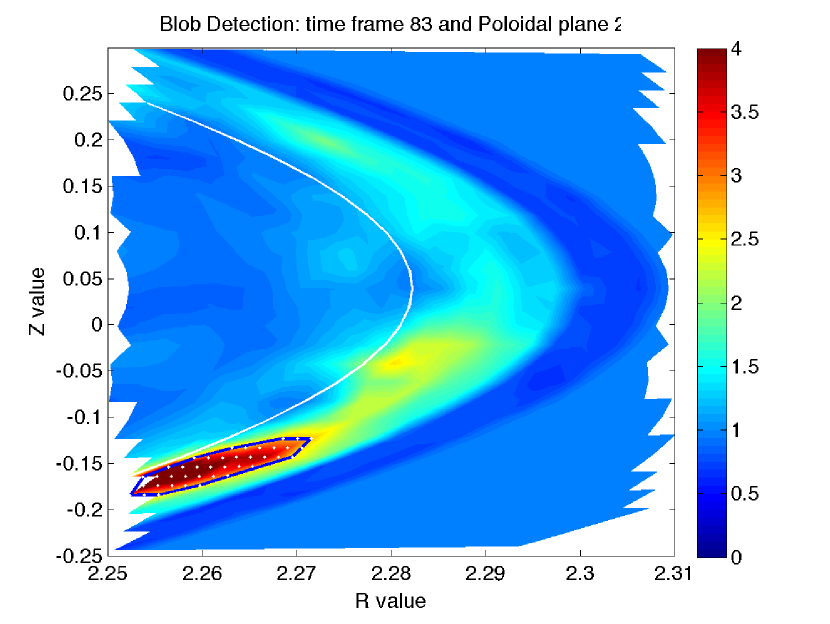
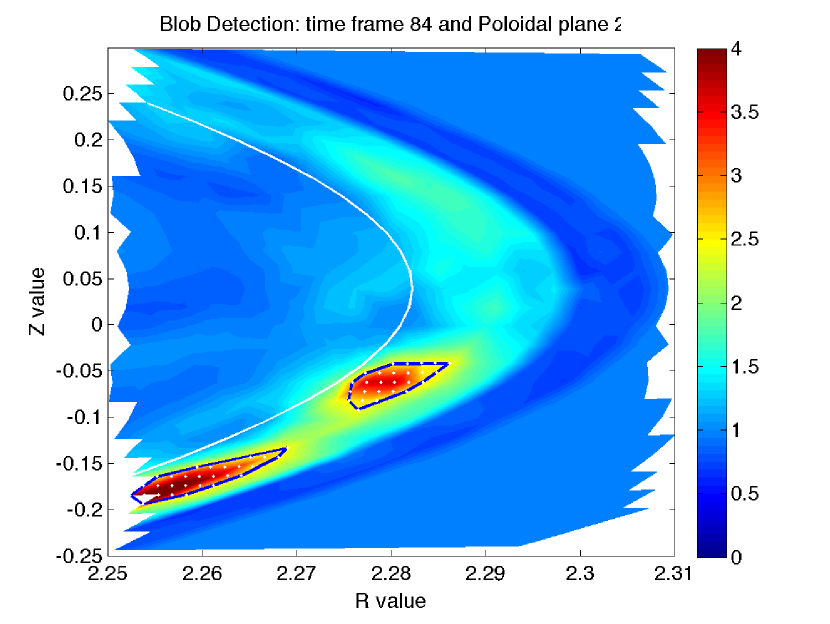
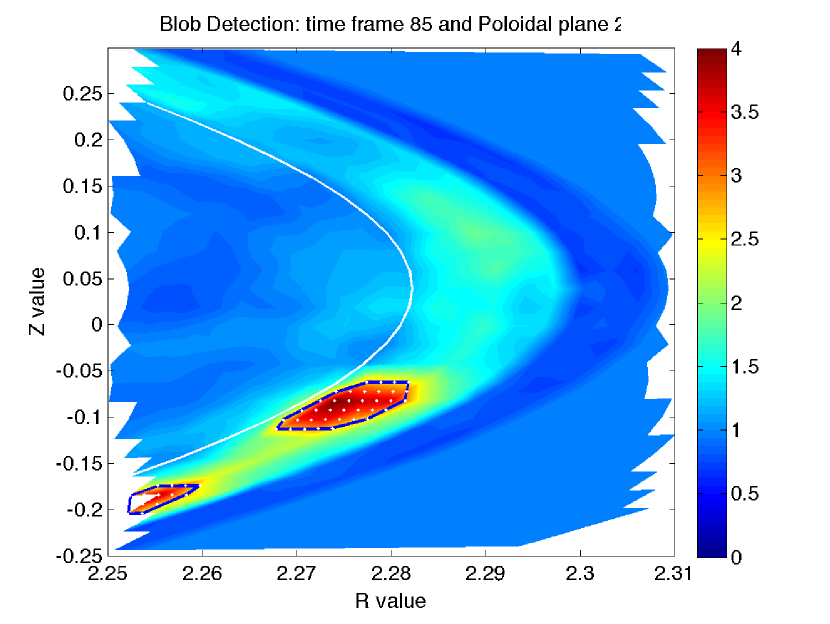
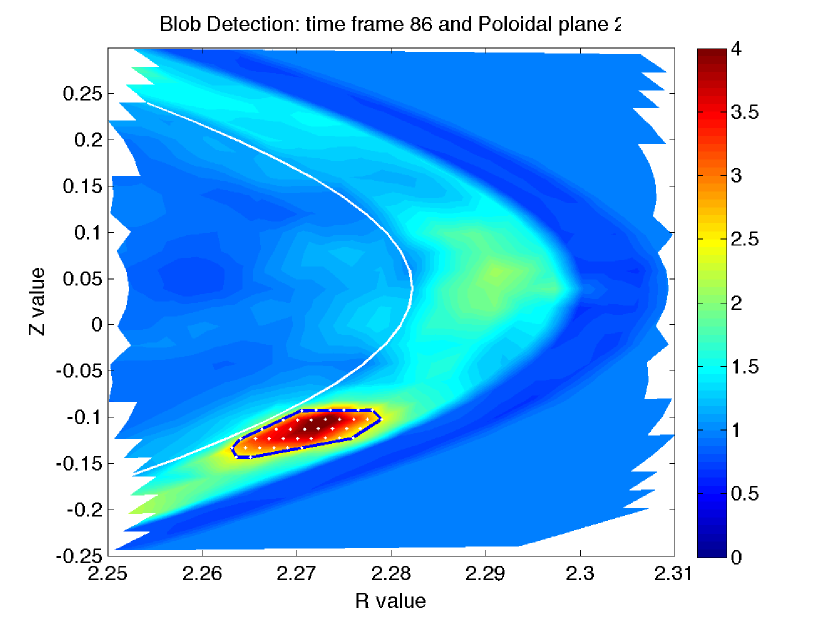
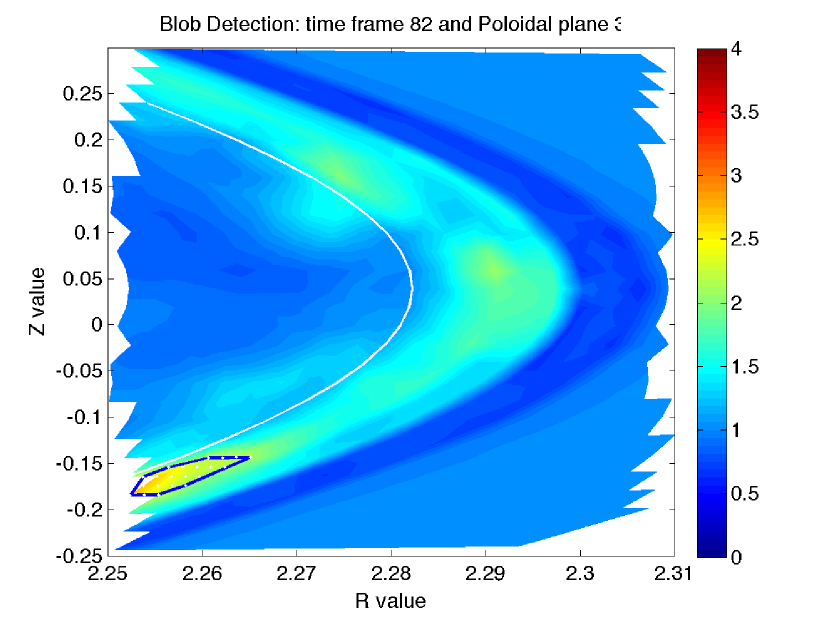
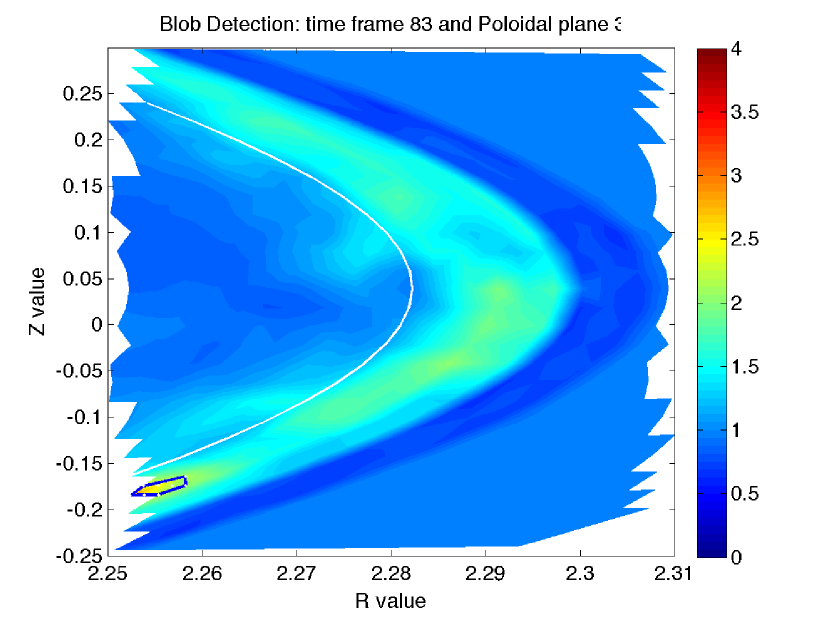
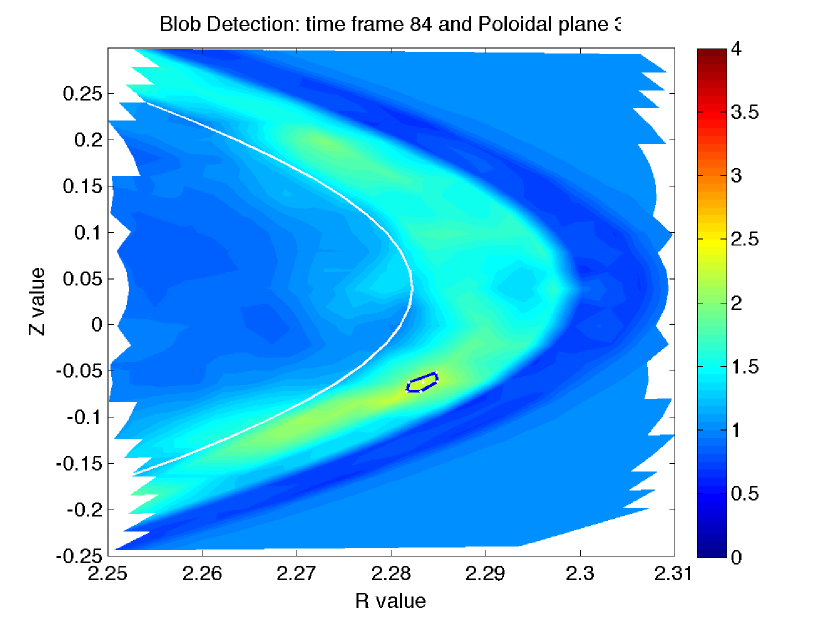
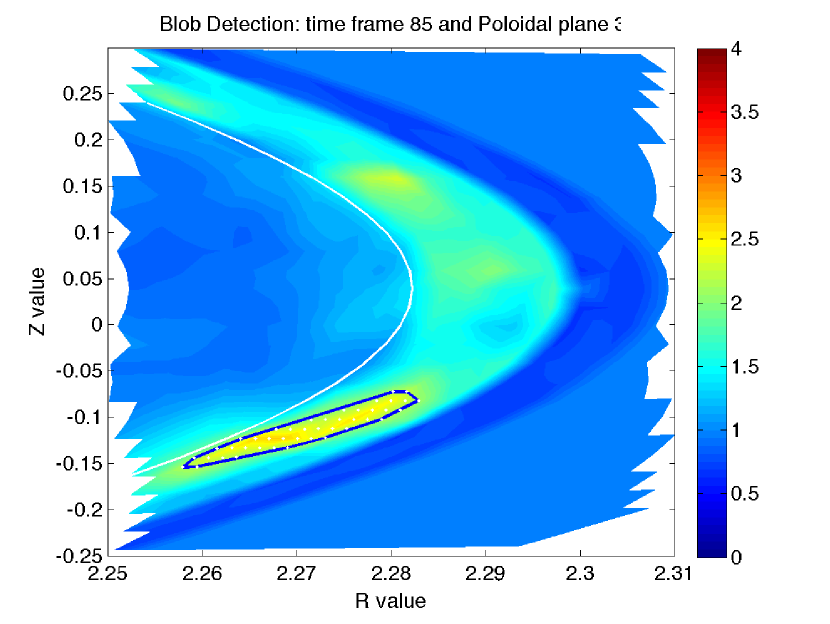
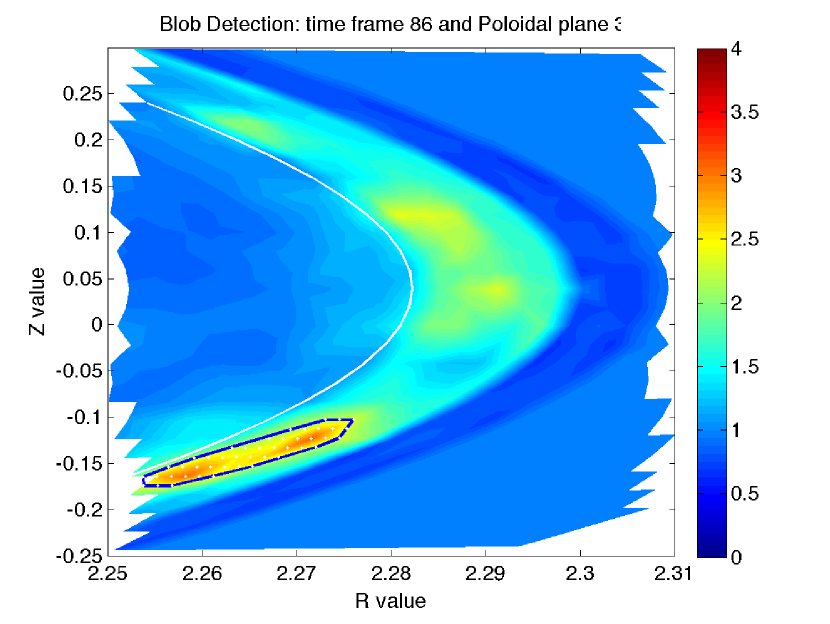
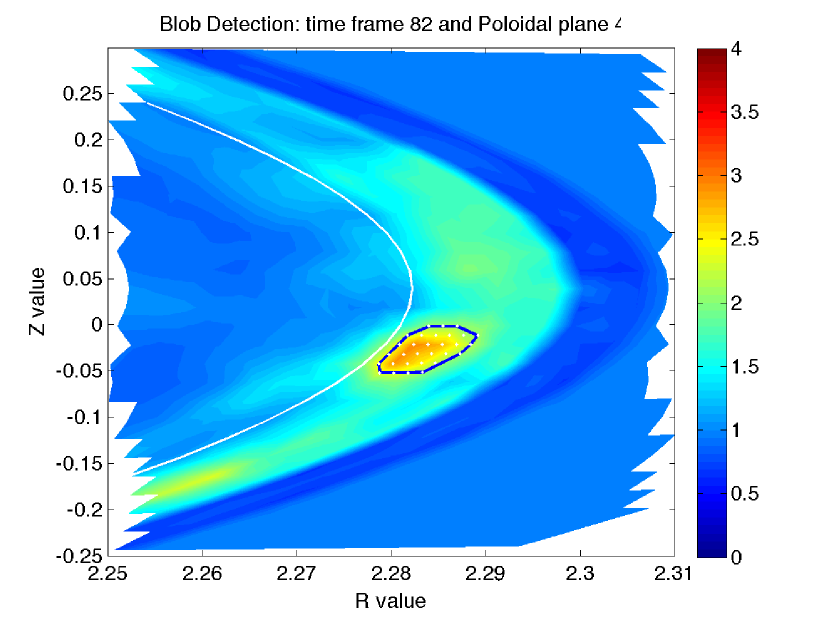
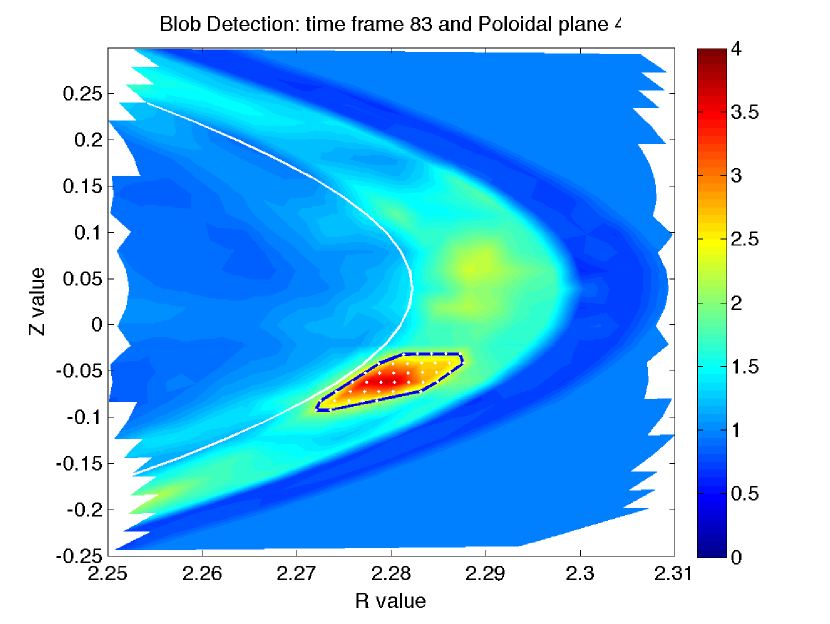
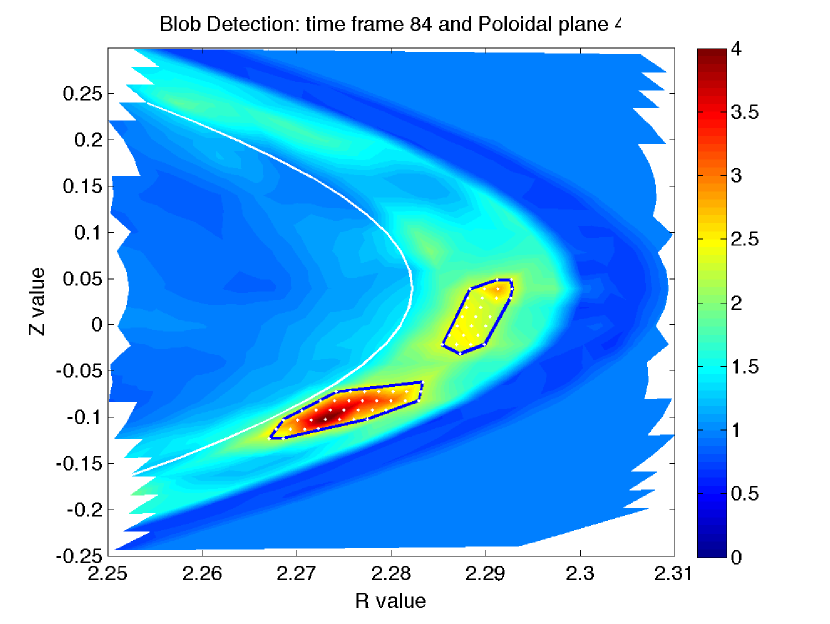
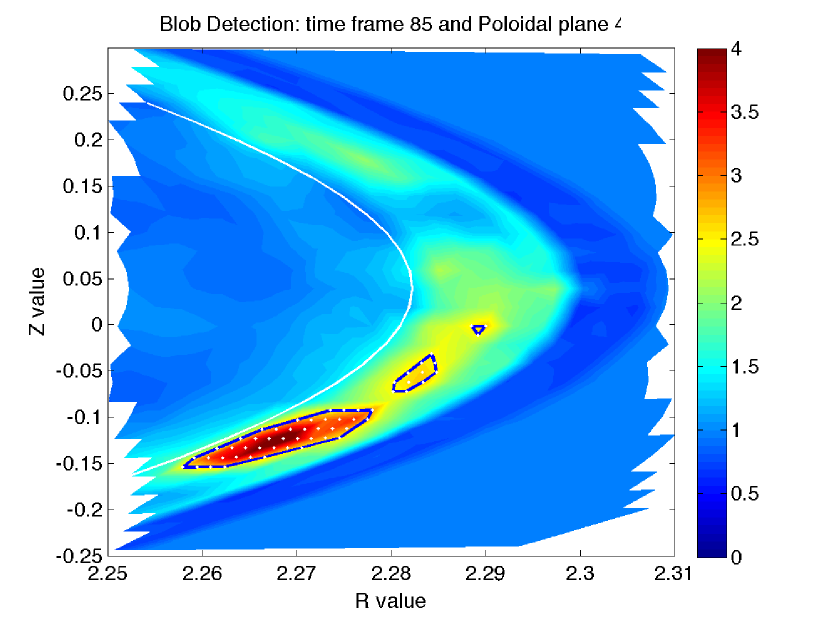
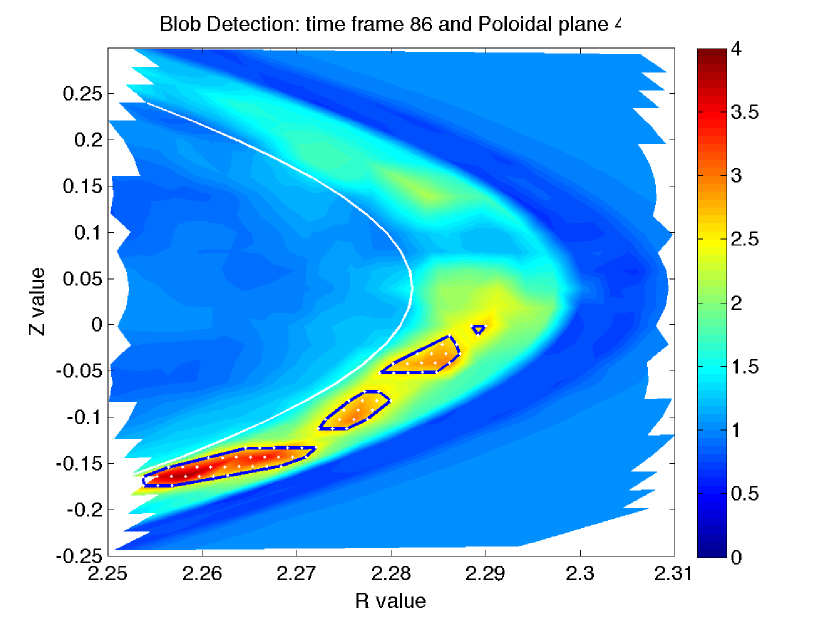
We perform more experiments to comprehensively examine the blob detection results in five continuous time frames and four different poloidal planes as shown in Figure 9. As we can see from the figure, our region outlier detection method can provide consistently good results in different situations. In addition, our method does not miss any blobs at the edge of the regions of interest, as shown in subfigures 9(b), 9(g), 9(c) and 9(h). It is interesting to see that large-scale blob structures are often generated, which could cause substantial plasma transport [40]. As pointed out in [50], these large-scale structures are mainly contributed by the low-frequency and long-wavelength fluctuating components, which may be responsible for the observations of long-range correlations. We also noticed that different poloidal planes may display significant diversity in edge turbulence, even in the same time frame. We have shown that we are able to effectively detect the blobs and reveal some interesting results to help physicists improve their understanding of the characteristic of blobs and their correlation with other plasma properties.
5.3 Blob tracking results
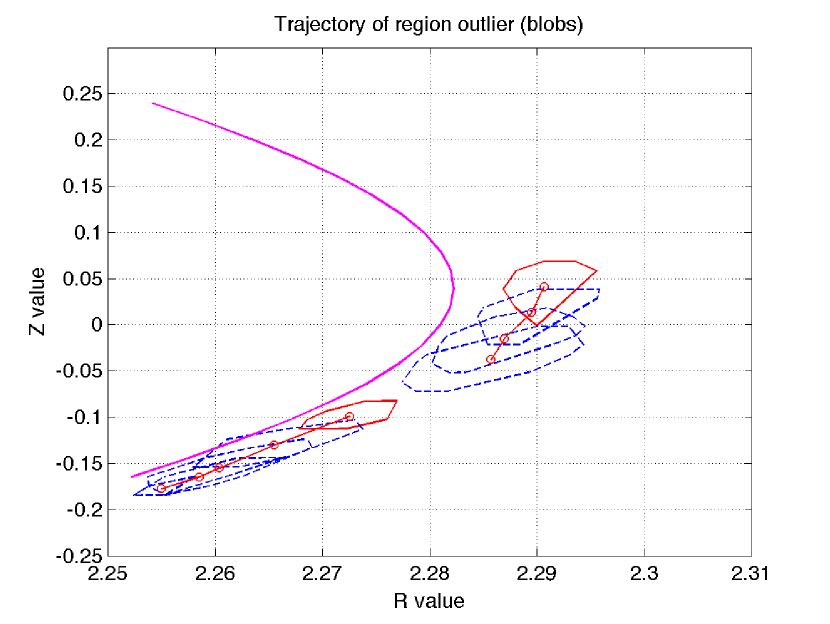
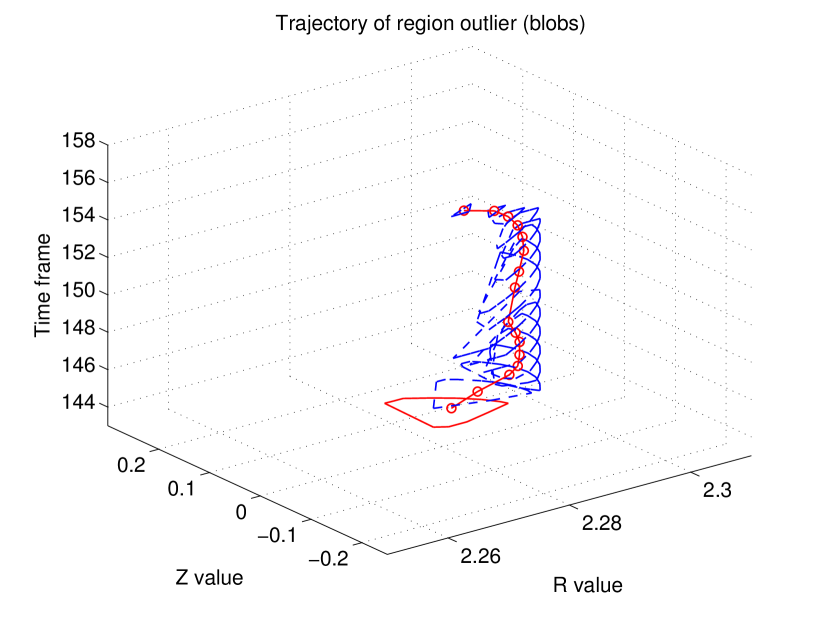
We investigate the blob tracking results in two different situations. Figure 10(a) exhibits a 2D trajectory of a blob. Again, the trajectory is generated by plotting the location of the density peak of the detected blobs over five consecutive time frames. We can see that our blob tracking algorithm can track two separate blobs simultaneously. The blob size can grow when they move towards confined plasma in the right region of separatrix. Figure 10(b) shows a 3D trajectory for a detected blob over fifteen consecutive time frames. In this case, the blob seems to maintain its size for a few time frames, then gradually decreases, and eventually disappears. Through these interesting results, physicists may be able to understand the characteristics of blobs better.
5.4 Real-time blob detection under strong scaling
We have illustrated the effectiveness and robustness of the proposed blob detection and tracking methods. Next, we perform a set of experiments to demonstrate the performance of our real-time blob detection approach under strong scaling and weak scaling. We define the speedup of our parallel implementation on heterogeneous multi-core architecture as follows:
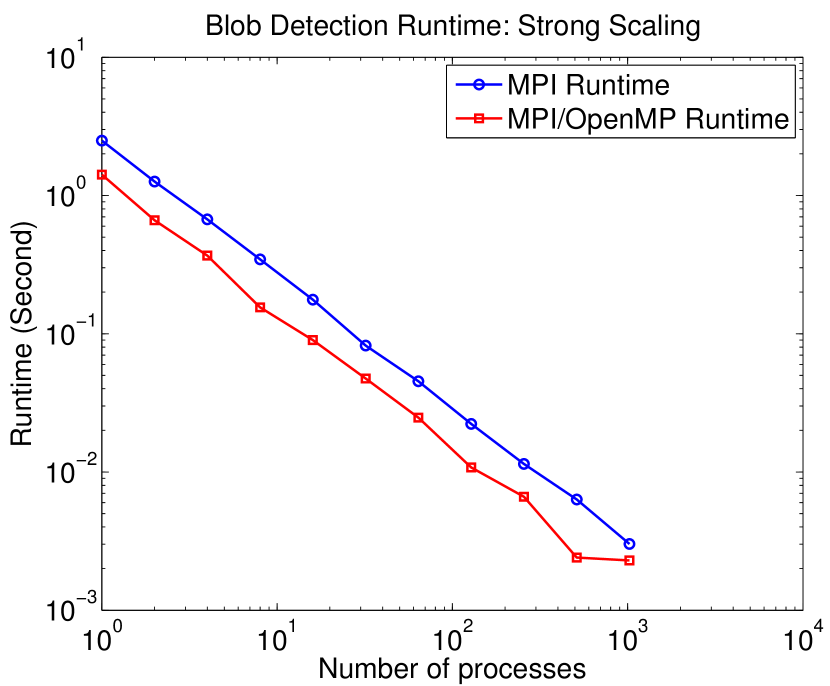
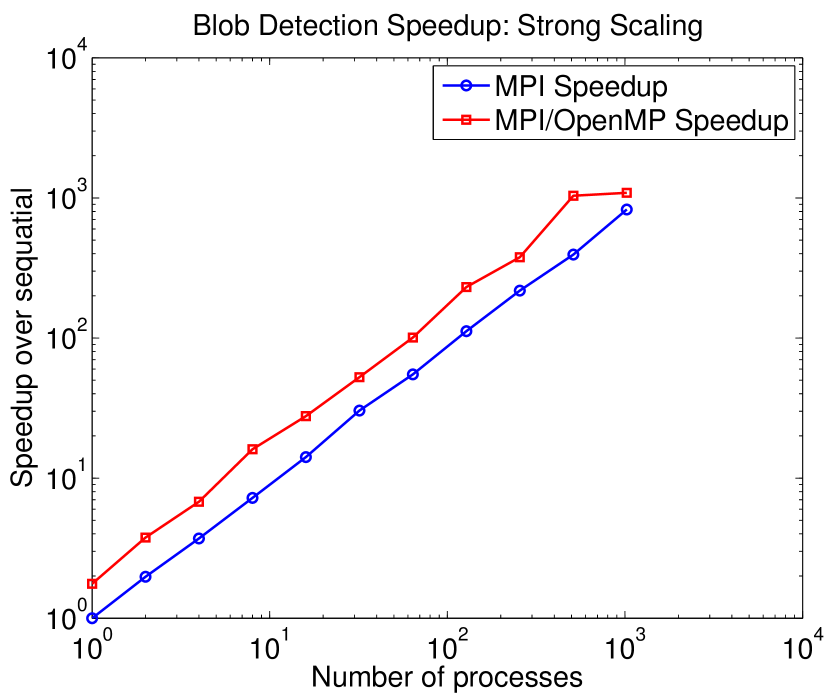
Our most encouraging results are that we can complete blob detection on the simulation data set described above in around 2 milliseconds with MPI/OpenMP using 4096 cores and in 3 milliseconds with MPI using 1024 cores. In Figure 11, we can achieve linear time speedup in blob detection time under strong scaling. The MPI and the MPI/OpenMP implementations accomplish 800 and 1200 times speedup respectively, when the number of processes is scaled to 1024. Also, we can see that the hybrid MPI/OpenMP implementation is about two times faster than the MPI implementation when varying the number of processes from 1 to 512. With 1024 processes, both of them achieve similar performance, but the MPI/OpenMP one is slightly better. This demonstrates that we are able to control analysis speed by varying the number of processes to achieve real-time analysis.
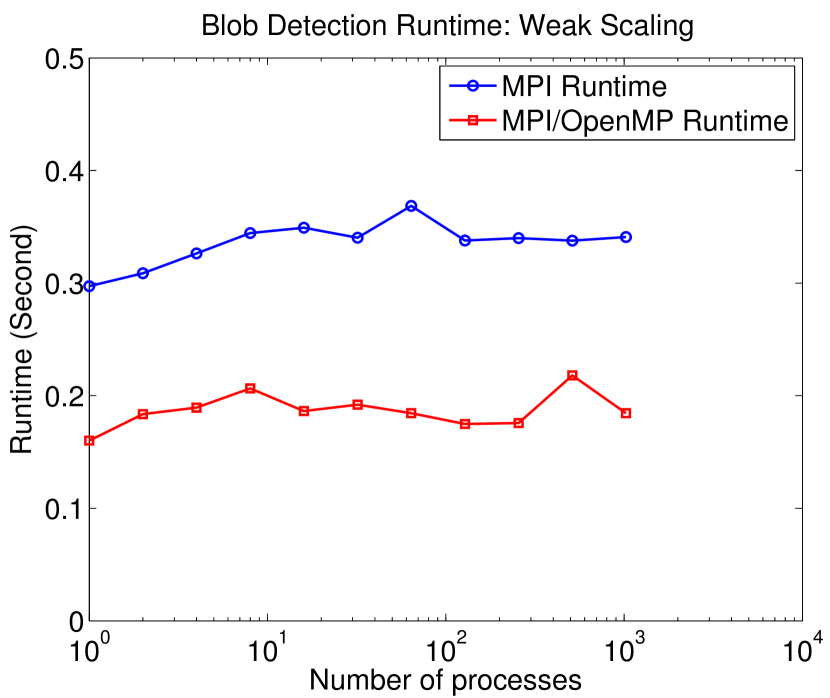
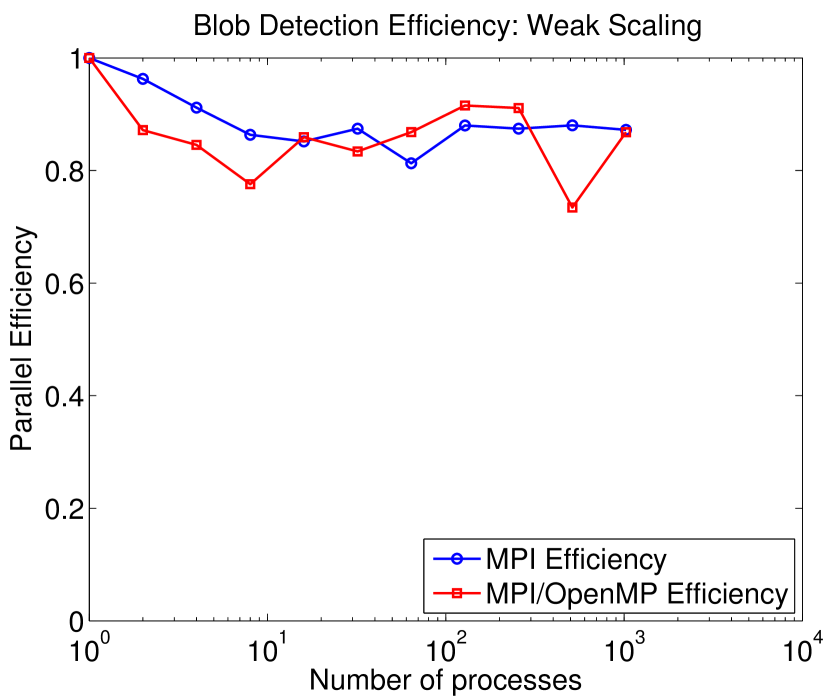
5.5 Real-time blob detection under weak scaling
In this experiment, we evaluate the performance of our real-time blob detection under weak scaling. We replicate existing data sets (30GB) in order to obtain adequate experimental data sets (4.3TB). The basic unit data contains 128 time frames and the size of data increases linearly with the number of processes. In Figure 12, the blob detection time remains almost constant under weak scaling, which indicates that our implementations scale very well to solve much larger problems. Also, both MPI and MPI/OpenMP implementations achieve high parallel efficiency as the number of processes increases from 1 to 1024.
6 Conclusion and future work
Near real-time extraction of spatio-temporal features in very large-scale irregular data presents both opportunities and challenges responding to extreme scale computing and big data in many applications. In this paper, we propose, for the first time, a real-time blob detection and tracking approach for finding blob-filaments in fusion experiments or numerical simulations. The key idea of the proposed approach is to break down the overall process into three steps. The first two steps are based on a distribution-based outlier detection scheme with various criteria and a fast CCL method to find blob components. In the third step, an efficient blob tracking scheme is presented to recover the trajectories of the motions of blobs. Our hybrid MPI/OpenMP implementations demonstrate the effectiveness and efficiency of the proposed approach with a set of fusion plasma simulation data. Our tests show that we can achieve linear time speedup and complete blob detection in two or three milliseconds using a cluster at NERSC.
We are currently working on integrating our blob detection algorithm into the ICEE system for consuming fusion plasma data streams where the blob detection function is used in a central data analysis component and the resulting detection results are monitored and controlled from portable devices, such as an iPad. We plan to test the proposed method in both simulations and real fusion experiments.
Acknowledgments
The authors would like to thank the referees for their valuable comments. This work was supported by the Office of Advanced Scientific Computing Research, Office of Science, of the U.S. Department of Energy under Contract No. DE-AC02-05CH11231 and partially supported by NSF under grants No. CCF 1218349 and ACI SI2-SSE 1440700, and by DOE under a grant No. DE-FC02-12ER41890. The blobby plasma turbulence simulation was performed using resources of the Oak Ridge Leadership Computing Facility, which is a DOE Office of Science User Facility supported under Contract DE-AC05-00OR22.
References
- [1] N. Cressie and C. K. Wikle, Statistics for Spatio-Temporal Data. Wiley, 2011.
- [2] K. Wu, R. R. Sinha, C. Jones, S. Ethier, S. Klasky, K.-L. Ma, A. Shoshani, and M. Winslett, “Finding regions of interest on toroidal meshes,” Computational Science & Discovery, vol. 4, no. 1, p. 015003, 2011.
- [3] V. Chandola, A. Banerjee, and V. Kumar, “Anomaly detection: A survey,” ACM computing surveys (CSUR), vol. 41, no. 3, p. 15, 2009.
- [4] J. Han, M. Kamber, and J. Pei, Data Mining: Concepts and Techniques, 3rd ed. San Francisco, CA, USA: Morgan Kaufmann Publishers Inc., 2011.
- [5] M. Gupta, J. Gao, C. C. Aggarwal, and J. Han, “Outlier detection for temporal data: A survey,” IEEE Transactions on Knowledge and Data Engineering, vol. 26, no. 9, pp. 1–1, 2014.
- [6] H. Yang, S. Parthasarathy, and S. Mehta, “A generalized framework for mining spatio-temporal patterns in scientific data,” in Proceedings of the eleventh ACM SIGKDD international conference on Knowledge discovery in data mining. ACM, 2005, pp. 716–721.
- [7] R. Aymar, P. Barabaschi, and Y. Shimomura, “The iter design,” Plasma Physics and Controlled Fusion, vol. 44, no. 5, p. 519, 2002.
- [8] D. D’Ippolito, J. Myra, and S. Zweben, “Convective transport by intermittent blob-filaments: Comparison of theory and experiment,” Physics of Plasmas (1994-present), vol. 18, no. 6, p. 060501, 2011.
- [9] S. Shekhar, C.-T. Lu, and P. Zhang, “A unified approach to detecting spatial outliers,” GeoInformatica, vol. 7, no. 2, pp. 139–166, 2003.
- [10] K. Wu, S. Ahern, E. W. Bethel, J. Chen, H. Childs, E. Cormier-Michel, C. Geddes, J. Gu, H. Hagen, B. Hamann et al., “Fastbit: interactively searching massive data,” in Journal of Physics: Conference Series, vol. 180, no. 1. IOP Publishing, 2009, p. 012053.
- [11] C. Chang, S. Ku, P. Diamond, Z. Lin, S. Parker, T. Hahm, and N. Samatova, “Compressed ion temperature gradient turbulence in diverted tokamak edgea),” Physics of Plasmas (1994-present), vol. 16, no. 5, p. 056108, 2009.
- [12] S. Ku, C. Chang, and P. Diamond, “Full-f gyrokinetic particle simulation of centrally heated global itg turbulence from magnetic axis to edge pedestal top in a realistic tokamak geometry,” Nuclear Fusion, vol. 49, no. 11, p. 115021, 2009.
- [13] B. Dong, S. Byna, and K. Wu, “Expediting scientific data analysis with reorganization of data,” in Cluster Computing (CLUSTER), 2013 IEEE International Conference on. IEEE, Sept 2013, pp. 1–8.
- [14] ——, “Sds: A framework for scientific data services,” in Proceedings of the 8th Parallel Data Storage Workshop, ser. PDSW ’13. ACM, 2013, pp. 27–32.
- [15] J. Y. Choi, K. Wu, J. C. Wu, A. Sim, Q. G. Liu, M. Wolf, C. Chang, and S. Klasky, “Icee: Wide-area in transit data processing framework for near real-time scientific applications,” in 4th SC Workshop on Petascale (Big) Data Analytics: Challenges and Opportunities in conjunction with SC13, 2013.
- [16] J. F. Lofstead, S. Klasky, K. Schwan, N. Podhorszki, and C. Jin, “Flexible io and integration for scientific codes through the adaptable io system (adios),” in Proceedings of the 6th international workshop on Challenges of large applications in distributed environments. ACM, 2008, pp. 15–24.
- [17] K. Wu, E. Otoo, and K. Suzuki, “Optimizing two-pass connected-component labeling algorithms,” Pattern Analysis and Applications, vol. 12, no. 2, pp. 117–135, 2009.
- [18] W. Davis, M. Ko, R. Maqueda, A. Roquemore, F. Scotti, and S. Zweben, “Fast 2-d camera control, data acquisition, and database techniques for edge studies on nstx,” Fusion Engineering and Design, vol. 89, no. 5, pp. 717–720, 2014.
- [19] J. Myra, W. Davis, D. D’Ippolito, B. LaBombard, D. Russell, J. Terry, and S. Zweben, “Edge sheared flows and the dynamics of blob-filaments,” Nuclear Fusion, vol. 53, no. 7, p. 073013, 2013.
- [20] P. Dollár, V. Rabaud, G. Cottrell, and S. Belongie, “Behavior recognition via sparse spatio-temporal features,” in 2005 IEEE International Workshop on Visual Surveillance and Performance Evaluation of Tracking and Surveillance. IEEE, 2005, pp. 65–72.
- [21] J. Winkler, A. Seybert, L. König, S. Pruggnaller, U. Haselmann, V. Sourjik, M. Weiss, A. S. Frangakis, A. Mogk, and B. Bukau, “Quantitative and spatio-temporal features of protein aggregation in escherichia coli and consequences on protein quality control and cellular ageing,” The EMBO journal, vol. 29, no. 5, pp. 910–923, 2010.
- [22] Q. V. Le, W. Y. Zou, S. Y. Yeung, and A. Y. Ng, “Learning hierarchical invariant spatio-temporal features for action recognition with independent subspace analysis,” in Computer Vision and Pattern Recognition (CVPR), 2011 IEEE Conference on. IEEE, 2011, pp. 3361–3368.
- [23] K. Aminian, B. Najafi, C. Büla, P.-F. Leyvraz, and P. Robert, “Spatio-temporal parameters of gait measured by an ambulatory system using miniature gyroscopes,” Journal of biomechanics, vol. 35, no. 5, pp. 689–699, 2002.
- [24] S. Sadik and L. Gruenwald, “Research issues in outlier detection for data streams,” ACM SIGKDD Explorations Newsletter, vol. 15, no. 1, pp. 33–40, 2014.
- [25] V. J. Hodge and J. Austin, “A survey of outlier detection methodologies,” Artificial Intelligence Review, vol. 22, no. 2, pp. 85–126, 2004.
- [26] E. M. Knox and R. T. Ng, “Algorithms for mining distancebased outliers in large datasets,” in Proceedings of the International Conference on Very Large Data Bases. Citeseer, 1998, pp. 392–403.
- [27] M. M. Breunig, H.-P. Kriegel, R. T. Ng, and J. Sander, “Lof: identifying density-based local outliers,” in ACM sigmod record, vol. 29, no. 2. ACM, 2000, pp. 93–104.
- [28] Z. He, X. Xu, and S. Deng, “Discovering cluster-based local outliers,” Pattern Recognition Letters, vol. 24, no. 9, pp. 1641–1650, 2003.
- [29] S. Subramaniam, T. Palpanas, D. Papadopoulos, V. Kalogeraki, and D. Gunopulos, “Online outlier detection in sensor data using non-parametric models,” in Proceedings of the 32nd international conference on Very large data bases. VLDB Endowment, 2006, pp. 187–198.
- [30] D. Pokrajac, A. Lazarevic, and L. J. Latecki, “Incremental local outlier detection for data streams,” in Computational Intelligence and Data Mining, 2007. CIDM 2007. IEEE Symposium on. IEEE, 2007, pp. 504–515.
- [31] M. Elahi, K. Li, W. Nisar, X. Lv, and H. Wang, “Efficient clustering-based outlier detection algorithm for dynamic data stream,” in Fuzzy Systems and Knowledge Discovery, 2008. FSKD’08. Fifth International Conference on, vol. 5. IEEE, 2008, pp. 298–304.
- [32] F. Angiulli and F. Fassetti, “Detecting distance-based outliers in streams of data,” in Proceedings of the sixteenth ACM conference on Conference on information and knowledge management. ACM, 2007, pp. 811–820.
- [33] C. C. Aggarwal, Y. Zhao, and P. S. Yu, “Outlier detection in graph streams,” in Data Engineering (ICDE), 2011 IEEE 27th International Conference on. IEEE, 2011, pp. 399–409.
- [34] H. Dutta, C. Giannella, K. D. Borne, and H. Kargupta, “Distributed top-k outlier detection from astronomy catalogs using the demac system.” in SDM. SIAM, 2007, pp. 473–478.
- [35] E. Lozano and E. Acufia, “Parallel algorithms for distance-based and density-based outliers,” in Data Mining, Fifth IEEE International Conference on. IEEE, 2005, pp. 4–pp.
- [36] M. E. Otey, A. Ghoting, and S. Parthasarathy, “Fast distributed outlier detection in mixed-attribute data sets,” Data Mining and Knowledge Discovery, vol. 12, no. 2-3, pp. 203–228, 2006.
- [37] E. Hung and D. W. Cheung, “Parallel mining of outliers in large database,” Distributed and Parallel Databases, vol. 12, no. 1, pp. 5–26, 2002.
- [38] M. Xu, P. Diamond, G. Tynan, C. Holland, P. Manz, N. Fedorczak, S. C. Thakur, J. Yu, K. Zhao, J. Dong et al., “Turbulent eddy-mediated particle, momentum, and vorticity transport in the edge of hl-2a tokamak plasma,” in 24th IAEA Fusion Energy Conference, San Diego, 2012.
- [39] G. Fuchert, G. Birkenmeier, B. Nold, M. Ramisch, and U. Stroth, “The influence of plasma edge dynamics on blob properties in the stellarator tj-k,” Plasma Physics and Controlled Fusion, vol. 55, no. 12, p. 125002, 2013.
- [40] S. Zweben, “Search for coherent structure within tokamak plasma turbulence,” Physics of Fluids, vol. 28, no. 3, p. 974, 1985.
- [41] H. Kong, H. C. Akakin, and S. E. Sarma, “A generalized laplacian of gaussian filter for blob detection and its applications,” IEEE transactions on cybernetics, vol. 43, no. 6, pp. 1719–1733, 2013.
- [42] I. Laptev and T. Lindeberg, “Space-time interest points,” International Conference on Computer Vision—ICCV’03, pp. 432–439, 2003.
- [43] T. Lindeberg, “Feature detection with automatic scale selection,” International Journal of Computer Vision, vol. 30, no. 2, pp. 79–116, 1998.
- [44] R. T. Collins, “Mean-shift blob tracking through scale space,” in Computer Vision and Pattern Recognition, 2003. Proceedings. 2003 IEEE Computer Society Conference on, vol. 2. IEEE, 2003, pp. II–234.
- [45] L. Vincent and P. Soille, “Watersheds in digital spaces: an efficient algorithm based on immersion simulations,” IEEE transactions on pattern analysis and machine intelligence, vol. 13, no. 6, pp. 583–598, 1991.
- [46] N. S. Love and C. Kamath, “Image analysis for the identification of coherent structures in plasma,” Optical Engineering and Applications, pp. 66 960D–66 960D, 2007.
- [47] R. Kube, O. E. Garcia, B. LaBombard, J. Terry, and S. Zweben, “Blob sizes and velocities in the alcator c-mod scrape-off layer,” Journal of Nuclear Materials, vol. 438, pp. S505–S508, 2013.
- [48] T. M. Chan, “Optimal output-sensitive convex hull algorithms in two and three dimensions,” Discrete & Computational Geometry, vol. 16, no. 4, pp. 361–368, 1996.
- [49] S. Müller, A. Diallo, A. Fasoli, I. Furno, B. Labit, G. Plyushchev, M. Podestà, and F. Poli, “Probabilistic analysis of turbulent structures from two-dimensional plasma imaging,” Physics of Plasmas (1994-present), vol. 13, no. 10, p. 100701, 2006.
- [50] G. Xu, B. Wan, W. Zhang, Q. Yang, L. Wang, and Y. Wen, “Multiscale coherent structures in tokamak plasma turbulence,” Physics of Plasmas (1994-present), vol. 13, no. 10, p. 102509, 2006.
![[Uncaptioned image]](/html/1505.03532/assets/Biography/teddywu.jpg) |
Lingfei Wu is a 6th year Ph.D. candidate in the computer science department at College of William and Mary, advised by Dr. Andreas Stathopoulos. His research interests are in the areas of high-performance scientific computing, large-scale machine learning, and big data analytics. In summer 2014 and 2015, Lingfei was a summer research intern at Lawrence Berkeley National Laboratory and IBM T.J.Watson Research Center, respectively. Before joining William and Mary, Lingfei received his M.S. from University of Science and Technology of China (Hefei, 2010), following his B.E. from Auhui University (Hefei, 2007) |
![[Uncaptioned image]](/html/1505.03532/assets/Biography/johnwu.jpg) |
Kesheng (John) Wu is a Senior Computer Scientist at Lawrence Berkeley National Laboratory. works actively on a number of topics in data analysis, data management, and high-performance computing. His recent algorithmic research work includes bitmap indexing techniques for searching large datasets, statistical methods for extract features from a variety of data, and restarting strategies for computing extreme eigenvalues. He authored and coauthored more than 100 technical publications, nine of which have more than 100 citations each. |
![[Uncaptioned image]](/html/1505.03532/assets/Biography/asim.jpg) |
Alex Sim is a Senior Computing Engineer at Lawrence Berkeley National Laboratory. His current R& D activities focus on data mining and modeling, data analysis methods, distributed resource management, and high performance data systems. He authored and coauthored more than 100 technical publications, and released a few software packages under open source license. |
![[Uncaptioned image]](/html/1505.03532/assets/Biography/michael.jpeg) |
Michael Churchill received his PhD in Nuclear Science and Engineering from the Massachusetts Institute of Technology, and his Bachelor’s degree in Electrical and Computer Engineering from Brigham Young University. He currently works as a postdoc under Dr. C.S. Chang at the Princeton Plasma Physics Laboratory, focusing on data management and analysis with the large-scale XGC plasma simulation codes. |
![[Uncaptioned image]](/html/1505.03532/assets/Biography/jong.jpg) |
Jong Y. Choi is a researcher working in Scientific Data Group, Computer Science and Mathematics Division, Oak Ridge National Laboratory (ORNL), Oak Ridge, Tennessee, USA. He earned his Ph.D. degree in Computer Science at Indiana University Bloomington in 2012 and his MS degree in Computer Science from New York University in 2004. His areas of research interest span data mining and machine learning algorithms, high-performance data-intensive computing, parallel and distributed systems for Cloud and Grid computing. |
![[Uncaptioned image]](/html/1505.03532/assets/Biography/andreas.jpg) |
Andreas Stathopoulos received a bachelors degree in Mathematics from University of Athens, Greece in 1989, and an M.S. and Ph.D. degrees in Computer Science from Vanderbilt University, USA in 1991 and 1995 respectively. In 1995, he obtained an NSF CISE postdoctoral fellowship to work with Prof. Yousef Saad at the University of Minnesota, USA. In 1997, he joined the faculty of Computer Science at the College of William and Mary, USA, where he currently holds a full professor position. His research interests span the general area of parallel and high performance scientific computing. He is an expert on solving eigenvalue problems and has developed the state-of-the-art eigenvalue software PRIMME. |
![[Uncaptioned image]](/html/1505.03532/assets/Biography/cs.jpg) |
Choong-Seock Chang is the head of the multi-institutional multi-disciplinary US SciDAC Center for Edge Physics Simulation (EPSI), headquartered at Princeton Plasma Physics Laboratory, Princeton University, awarded by US Department of Energy, Office of Fusion Energy Science and Office of Advanced Scientific Computing Research, jointly. He has over 150 publications in peer reviewed internationally recognized journals, and has given countless invited talks, keynote speeches and tutorial lectures at major scientific conferences. |
![[Uncaptioned image]](/html/1505.03532/assets/Biography/scott.jpg) |
Scott Klasky is currently a senior research scientist at Oak Ridge National Laboratory, and head of the end to end task in the scientific computing group at the National Center Computational Sciences. He has 20 years of experience in research and development of middleware for use in high performance computing, and is a author/co-author of over 40 papers in the field of physics and high performance computing. He received his PhD in physics from the University of Texas at Austin, and then went on to Syracuse University, and then the Princeton Plasma Physics Laboratory. |