Cosmology through arc statistics I: sensitivity to and
Abstract
The next generation of large sky photometric surveys will finally be able to use arc statistics as a cosmological probe. Here we present the first of a series of papers on this topic. In particular, we study how arc counts are sensitive to the variation of two cosmological parameters: the (total) matter density parameter, , and the normalisation of the primordial power spectrum, expressed in terms of . Both these parameters influence the abundances of collapsed structures and their internal structure. We compute the expected number of gravitational arcs with various length-to-width ratios in mock light cones, by varying these cosmological parameters in the ranges and . We find that the arc counts dependence on and is similar, but not identical, to that of the halo counts. We investigate how the precision of the constraints on the cosmological parameters based on arc counts depends on the survey area. We find that the constraining power of arc statistics degrades critically only for surveys covering an area smaller than of the whole sky. Finally, we consider the case in which the search for arcs is done only in frames where galaxy clusters have been previously identified. Adopting the selection function for galaxy clusters expected to be detected from photometric data in future wide surveys, we find that less than of the arcs will be missed, with only a small degradation of the corresponding cosmological constraints.
keywords:
Arc statistics; strong gravitational lensing; galaxy clusters; cosmology.1 Introduction
The importance of galaxy clusters in cosmology is well known (for a review, see Allen et al., 2011, and references therein). Being the most massive bound systems in the universe, they trace the latest stage of structure formation. Their abundance and mass as a function of redshift are thus highly indicative of how the growth of the cosmic density fluctuations occurs and can thus be used to constrain the matter content, the initial power spectrum normalisation and the expansion history of the universe (Eke et al., 1998; Borgani et al., 2001; Reiprich & Böhringer, 2002; Allen et al., 2003; Schuecker et al., 2003; Henry, 2004; Vikhlinin et al., 2009; Mantz et al., 2010; Rozo et al., 2010; Sehgal & et al., 2011; Planck Collaboration et al., 2014a; Benson et al., 2013; Mantz et al., 2014).
Moreover, galaxy clusters are essential cosmic laboratories where the complex interaction between baryons and dark matter can be studied in detail, in particular during merger events (Clowe et al., 2006; Merten et al., 2011).
Being the most massive structures in the Universe, galaxy clusters are also the most powerful gravitational lenses (Narayan & Bartelmann, 1999; Bartelmann & Schneider, 2001; Kneib & Natarajan, 2011). In particular, they are responsible for highly non-linear lensing effects taking place in their densest regions, i.e. in their cores. In this so-called “strong” lensing regime, the images of background galaxies are heavily distorted, often leading to the appearance of gravitational arcs with large length-to-width ratios (see Kneib & Natarajan, 2011; Meneghetti et al., 2013, and references therein).
The efficiency of galaxy clusters to produce arcs with a given ratio between their length and width is quantified by means of their strong lensing cross section . This is defined as the area on the source plane where the source has to be located in order to form an arc with such a ratio. To have a large strong lensing cross section, the projected mass distribution of the lens must be exceptionally dense on the plane of the sky, also called “lens plane”. Sometimes, this can be the result of projection effects (halos elongated along the line-of-sight, superposition of multiple structures at different redshifts, etc), but, generally speaking, gravitational arcs trace the highest peaks in the cosmological density field. Bartelmann et al. (1998) first pointed out that counting gravitational arcs may be a competitive method to constrain cosmological parameters (see e.g. Fedeli et al., 2006; Meneghetti et al., 2013).
Unfortunately, strong lensing events such as gravitational arcs are rare. Given the relatively low number of arcs discovered so far and the high inhomogeneity of cluster optical surveys, the application of arc statistics in cosmology has been attempted mainly with the goal of possibly falsifying the standard cosmological model (the so-called concordance CDM) rather than actually constraining cosmological parameters. For about years, scientists have debated on the existence or nonexistence of a tension between the observed number of arcs and the predictions derived in the framework of the cosmological model favoured by observational data (see Meneghetti et al., 2013, and references therein). Undoubtedly, arc statistics suffered so far from the lack of suitable large observational datasets for a reliable comparison to theoretical predictions. The situation is likely to change radically in the near future, thanks to the advent of large optical surveys, covering areas in the range from several thousands of square degrees (de Jong et al., 2013; The Dark Energy Survey Collaboration, 2005), to (almost) the full sky (LSST Science Collaboration et al., 2009; Karoji, 2009; Laureijs et al., 2011; Spergel et al., 2013).
In Boldrin et al. (2012) we forecasted the number of gravitational arcs visible in the future wide field survey to be performed by the ESA Euclid mission (Laureijs et al., 2011). A further step is the analysis of the sensitivity of arc statistics on cosmological parameters. In particular in this work, we focus on the dependence of arc statistics on the (total) matter density parameter and on the normalisation of the primordial power spectrum, expressed in terms of . More precisely, we investigate the region of the parameter space defined by , and . We sample the parameters at intervals and , thus investigating a total of 25 different cosmological models, always making the assumption of a flat Universe (). To help a direct comparison with the results of Boldrin et al. (2012), here we assume a reference cosmology defined by the parameters (, ) with present Hubble parameter km/s/Mpc, in agreement with the WMAP7 results (Komatsu et al., 2011). However we will discuss also the results obtained with the assumption of the parameters recently derived by Planck Collaboration et al. (2014b).
The paper is organized as follows. In Section 2 we briefly describe the method adopted to compute the number of arcs and to build the mock catalogs. In Section 3 we present our main results, i.e. the total number of arcs and their redshift distribution as a function of and . Section 4 is devoted to a discussion of the origin of the cosmological influence on arc statistics; we also consider how the results can change when including the effects of possible systematics. In Section 5 we discuss the agreement between the predictions obtained with our methodology and the arc counts in real surveys, using the recent results of Xu et al. (2015) based on the CLASH survey. Finally, in Section 6 we summarise and draw our conclusions.
2 Method
In this section, we summarise the steps undertaken for calculating the number of arcs produced by a population of strong lenses.
2.1 Generation of lenses with MOKA
In the attempt of properly modelling all the relevant structural properties of the lenses in our calculations of , we make use of the pseudo-analytic code MOKA (Giocoli et al., 2012a, b). This code allows to generate mock cluster-size gravitational lenses in any desired cold dark matter (CDM) scenario, including features like: triaxiality and projection effects, scatter in concentration, substructures, and the presence of a brightest central galaxy, including the effects that its growth produces adiabatic contraction on the cluster dark-matter halo profile. As discussed in several earlier works based on fully numerical simulations (see e.g. Meneghetti et al., 2003c; Torri et al., 2004; Meneghetti et al., 2007), all these features play an important role for determining the cluster ability to produce giant arcs. The most important novelty of our work mainly lies on the adoption of very realistic simulated strong lenses, as the MOKA code allows to do.
More in detail, to generate the mock lenses we use the following prescriptions:
-
•
the host halo mass density profile is described by the Navarro, Frenk and White (NFW) radial function (Navarro et al., 1996);
-
•
the dark matter halo concentration is derived from the mass-concentration relation proposed by Zhao et al. (2003), assuming log-normal scatter of ;
-
•
the lens halo is triaxial and the axis ratios are generated assuming the triaxial distributions derived by Jing & Suto (2002);
-
•
the spatial orientation is randomly chosen;
-
•
the substructure abundance follows the sub-halo mass function derived by Giocoli et al. (2008);
-
•
the substructure radial distribution follows that proposed by Gao et al. (2004);
-
•
the substructures are modelled as Single Isothermal Spheres (SISs) (Metcalf & Madau, 2001);
-
•
the mass density profile of the Brightest Cluster Galaxy (BCG) resembles the Hernquist’s profile (Hernquist, 1990).
The main outcome of the MOKA code is the deflection angle map of each mock halo. From the latter, we obtain for sources at via ray-tracing technique. For simplicity, we consider only isolated lenses, avoiding the cases of merging haloes, even though some studies revealed the importance these events have on the amplitude of the strong lensing signal (see e.g Torri et al., 2004). Furthermore, another source of enhancement of the signal is given by the large scale structure present along the line of sight, which boosts the lens projected mass on the source plane. Since beyond purpose of this paper we postpone detailed studies of those two aspects to a future work.
2.2 Number of giant arcs
We trace light-rays through a uniform grid on the lens plane towards the source plane, accounting for the position-dependent deflections. The source plane is populated with elliptical sources distributed on a regular grid. Their lensed shapes are recovered by collecting the light rays hitting them. The lengths and widths of the resulting gravitational arcs are measured using the method described in several earlier papers (see e.g. Meneghetti et al., 2003c). As in Boldrin et al. (2012), the source population has random ellipticity and an apparent size depending on the redshift (see Boldrin et al. 2012, Fig. 3.). To properly sample the region of the source plane, where sources are lensed as giant arcs, we iteratively increase the resolution of source grid near the lens caustics. Each source is then representative of an area on the source plane defined by the local resolution of the source grid. Using this area as weight, we compute , defined as the area on the source plane within which a source has to be located for being lensed as a giant arc with a given (Meneghetti et al., 2008).
The number of arcs with length-to-width ratio larger than , produced by a lens of mass at redshift , can be computed solving the following relation:
| (1) |
where is the strong lensing cross section for giant arcs for sources at redshift , and accounts for the scaling of with . In order to minimize the computational time, we recover the scaling function computing of a lens subsample, adopting different values of (see for more details Boldrin et al., 2012).
A crucial ingredient is the redshift distribution of the sources exceeding a given surface brightness , . We derive it by simulating an observation of the galaxies in the Hubble-Ultra-Deep-Field (HUDF) using the SkyLens code (Meneghetti et al., 2008), to a depth which is reasonable for a future wide field survey from space. As a reference, we consider the Euclid wide survey, which is expected to reach an average limiting magnitude (Laureijs et al., 2011). Adopting typical Euclid-like exposure times and background levels, we estimate the surface brightness limits corresponding to and above the mean background level, and use the simulated observations of the HUDF to measure . Using a subset of MOKA lenses to simulate observations of gravitational arcs, we find that we can safely neglect from the giant arc counts sources above .
For each combination of cosmological parameters, we produce a catalog of cluster-sized lenses with different masses and redshifts. We define 100 mass bins which are uniformly spaced in logarithm between and and 8 redshift bins, having and centered at redshifts 0.21, 0.36, 0.54, 0.6, 0.84, 1.02, 1.14, and 1.26. The choice of such redshift bins is optimised for the expected redshift distribution of the lenses producing giant arcs, which we derived in Boldrin et al. (2012) for a Euclid-like survey. For each combination of redshift and mass we use MOKA to generate 100 halos with different structural properties and measure their , from which we can derive the number of giant arcs they produce, as discussed above.
The catalog of lenses is then used to generate 128 realisations of lens distributions (light-cones). In each light-cone, which subtends an area of 15,000 square degrees, we calculate the number of lenses of mass and redshift according to the Sheth & Tormen (1999) mass function, and estimate the total number of arcs by summing up the contributions from each individual lens. Finally, we combine the different light-cones to measure the median number of arcs per square degree and the relative scatter as a function of the considered cosmological parameters.
3 Results
3.1 Number of arcs as a function of redshift
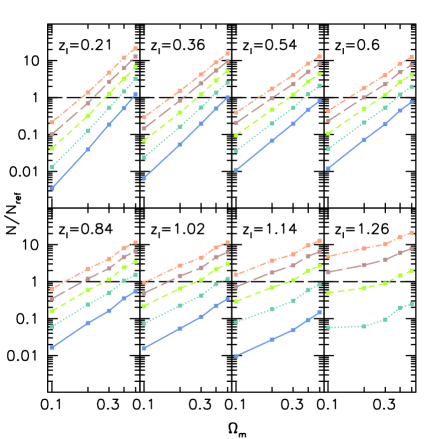
We begin by discussing how the arc counts change as a function of cosmology in different redshift bins. In Fig. 1 we show the number of arcs, normalized to the reference WMAP7 cosmology, as function of . The different panels refer to the eight redshifts where the calculations were performed. Different colors and line styles are used to display the results for several values of : solid blue, dotted cyan, dashed green, long-dashed brown and dot-dashed dark orange lines refer to =0.6, 0.7, 0.8, 0.9 and 1, respectively. Long-dashed black horizontal lines correspond to unity, i.e. to the reference cosmology. The lack of a blue solid line in the last panel is due to the inefficiency of clusters at to produce giant arcs in the cosmology with . As expected, at all redshifts, the arc counts grow as a function of and as a function of , indicating that the abundance of giant gravitational arcs is higher in cosmological models with more matter and higher normalisation of the power spectrum of the primordial density fluctuations.
We also notice that the change of arc counts as a function of cosmology depends on the lens redshift. The dependence on is stronger at lower redshift, and flattens off as increases. On the contrary, it appears that the value of affects the results more significantly at high redshift.
While the results in Fig. 1 refer to arcs with and sources above the background level, the trends remain similar for other ratios and detection limits.
3.2 The total number of arcs
From the distributions obtained from the 128 different light-cone realizations, we measure the median number of arcs per square degree expected in each cosmological model. This has been done by performing a spline interpolation through the above-mentioned 8 redshifts up to a maximum lens redshift of .
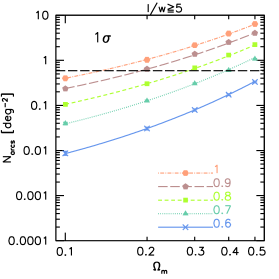
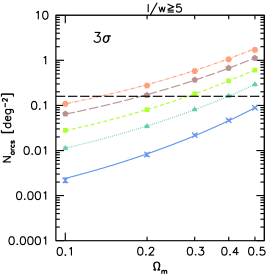
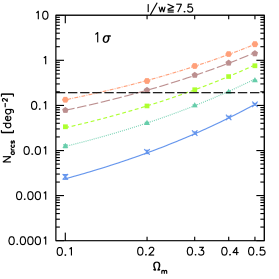
In the reference WMAP7 cosmology, the expected number densities of arcs per square degree with , 7.5, and 10 are , , and , respectively. These are in excellent agreement with our estimates reported in Boldrin et al. (2012), although these were obtained using a larger number of redshift bins and avoiding the interpolation.
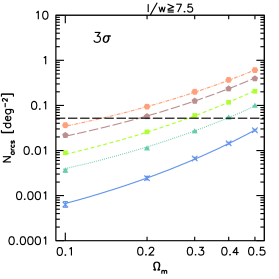
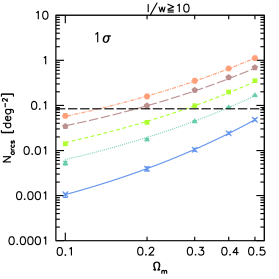
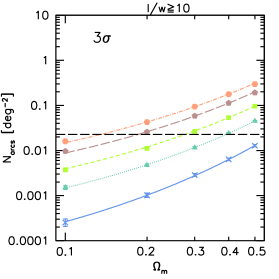
In Fig. 2, we show the median arc number counts per square degree as a function of . We also show how the counts vary by changing the value of , using the same color and line styles used in Fig. 1. From top to bottom, we show the results for , 7.5, and 10, respectively. The left and the right panels refer to detections at - and above the level of the background. Obviously, the results show the same dependence on and reported in Fig. 1.
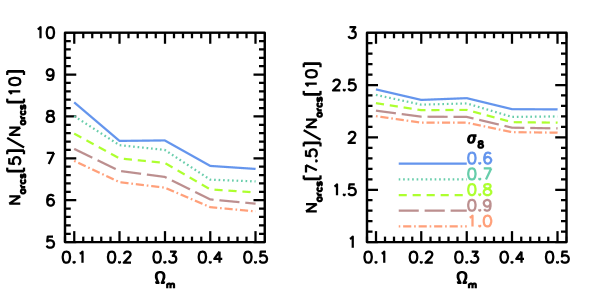
We also see that the ratios between counts of arcs with different depend on the cosmological parameters. As shown in Fig. 3, for low , the abundance of arcs with or , relative to that of arcs with , is higher, indicating that halos in these cosmological models have smaller critical lines and are thus less efficient at producing large distortions. The ratios also depend on ; in cosmologies with higher halos are able to produce a higher abundance of arcs with large . The results (here shown only for sources above the mean background level) are insensitive to the assumed detection limit. Therefore, in the following discussion we will show the results only for arcs detectable at the level. We will also focus on arcs with .
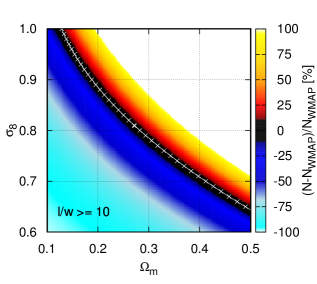
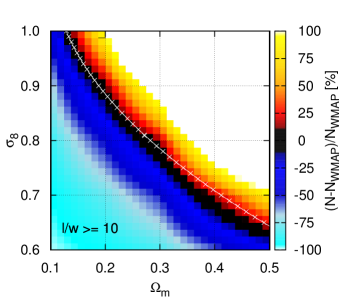
The upper panel in Fig. 4 shows the difference in the arc counts relative to the reference WMAP7 cosmology in the plane. Within the ranges explored in this work, we may find differences of up to one order of magnitude for the predicted arc counts between cosmological models. We also notice that the cosmological parameters and are degenerate with respect to the arc counts. Indeed, the same number of arcs is expected in cosmologies whose combination of and lays in a banana-like region extending from the upper left to the bottom right corner of the plane. The origin of this degeneracy will be better discussed in Section 4.1. Interestingly, a Planck-like cosmology with and (Planck Collaboration et al., 2014b) produces more arcs than the reference WMAP7 cosmology.
We find that in the case of the reference WMAP7 model, the equation describing the degeneracy curve between the cosmological parameters has the following form:
| (2) |
where , and . Such function is given by the white line in the upper panel of Fig. 4.
In the attempt to quantify the uncertainty in the arc counts, we define the 1 uncertainty on the number counts as , where is the cosmic variance, which is estimated from the 16th and 84th percentiles of the distributions derived from the 128 light-cone realisations of each tested cosmological model. The other term appearing in the equation, , is the associated Poisson noise on the number counts.
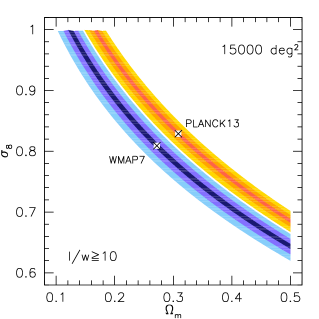
In the bottom panel of Fig. 4, we perform an error analysis showing the levels corresponding to 1, 3, and 5 deviations (from dark to light colors) from the WMAP7 and the Planck cosmologies in the plane. The results were obtained assuming a survey covering sq. degrees of the sky to the depth expected for the Euclid mission. It is interesting to notice that a survey with the Euclid characteristics will be able to distinguish these two cosmological models at more than level.
4 Discussion
4.1 Influence of the cosmological parameters on arc statistics
In this section we will discuss in more detail some aspects of the influence of and on arc statistics. In general, the cosmological parameters play an important role in arc statistics through the lens mass function and their strong lensing cross section, the latter depending on the geometry of the Universe and on the structural properties of the lens halo.
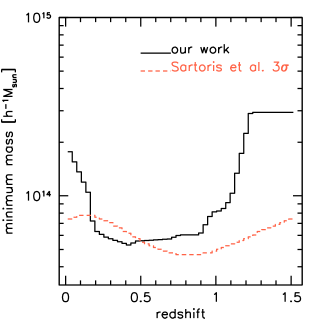
In particular, the number of arcs is directly related to the number of lenses able to produce arcs. Following Meneghetti et al. (2010a, 2011), this can be estimated including in the mass function describing the lens distribution a sharp cut at the minimum mass corresponding to the smallest systems in which we expect to find critical lines for sources at . The shape of the adopted selection function as a function of redshift is shown by the black curve in Fig. 5 (see also Boldrin et al., 2012).
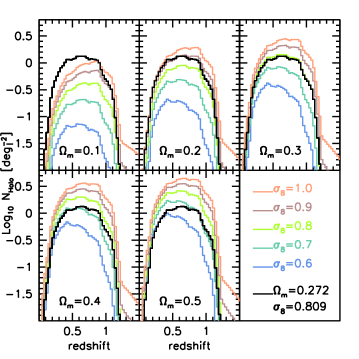
In Fig. 6, we present the number density (given per square degree) of the lenses as a function of redshift. In each panel, we keep fixed as labeled and we vary the value for , using the color code indicated on the bottom right. To facilitate the comparison, the lens number density in the reference WMAP7 cosmology is shown in black in all panels. From the figure, the strong effect of the different matter density on the lens abundances and the anticipated structure formation originated by a higher power spectrum normalization are clear.
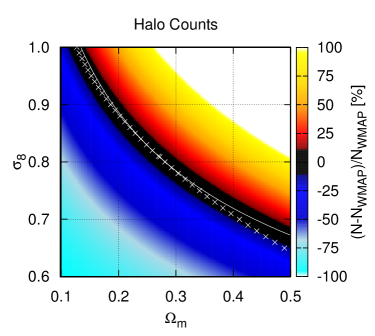
In Fig. 7, adopting the same color code as in the upper panel of Fig. 4, we show the difference in the lens counts relative to the reference WMAP7 cosmology in the plane. The white solid curve in the figure represents the degeneracy between and for the halo counts, for which we find the following relation:
| (3) |
Even if with some differences, this curve is close to the relation (shown by the white crosses) representing the degeneracy we found in the plane for the arc counts (see also Fig. 4): this is clearly due to the fact that the most important ingredient for arc statistics is the lens mass function. However, if one compares the amplitude of the count variation by looking at the width of the coloured strips, it is evident that the arc density is more sensitive to the cosmological parameters than the simple halo density: consequently, a wide survey of gravitational arcs could potentially give significant constraints.
The larger sensitivity of arc statistics is due to the cosmological dependence of the other main ingredients, such as the angular diameter distances of lenses and sources and the lens structural properties. We know that the first condition for an axially symmetric lens to act like a strong lens is that in some points on the lens plane the condition
| (4) |
occurs, where is the so-called convergence, is the lens projected mass density and
| (5) |
represents the critical value of the two-dimensional mass density in order to have strong lensing effects. The quantity is the so-called lensing distance, defined as
| (6) |
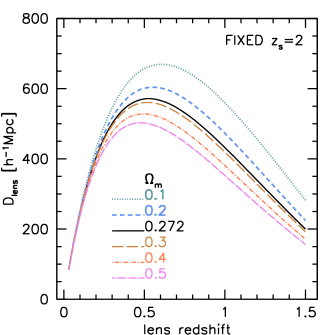
where , and are the angular diameter distances of the source, of the lens and between source and lens, respectively. Although for elliptical lenses we have to add the effect of shear to the condition (4), we can infer, to first approximation, what are the system configurations which are more efficient in producing strong lensing features by investigating how changes in the different cosmological models, once the lens properties and the source redshifts are kept fixed. We remind the reader that contains the full dependence on the geometry of the system and does not depend on , but only on . We fix the source position at redshift and we study , that is we keep fixed the length of the lensing system and we move the lens from the observer towards the source plane. The results are shown in Fig. 8: we see that increasing the value of , the strong lensing efficiency reaches its maximum at lower lens redshifts. In particular the peak around which the production of gravitational arcs is expected to be boosted shifts from to when the value of is increased from 0.1 to 0.5.
The effect of the anticipation of structure formation due to a higher value of (Giocoli et al., 2007, 2012b) has consequences on several halo structural properties that may influence the size of . Considering the concentration parameter, at fixed , large values lead to larger concentrations because the structures form and grow in denser environments. At the same time, keeping fixed the value of , in cosmologies with high the concentration increases because of both the higher contrast between primordial perturbations and background, and the anticipated formation time (Neto et al., 2007; Giocoli et al., 2012b; Macciò et al., 2008).
Haloes triaxiality is also an important feature that depends on cosmological parameters (Despali et al., 2014; Bonamigo et al., 2015). In particular, the level of sphericity of a halo, which is directly related to the ratio between its minor and major semi-axes , is an increasing function of and a decreasing function of . As an example, if we consider haloes with a mass equal to at redshift in a cosmological model with , the median ratio among realizations varies from in a model with , to in a model with . The quoted uncertaintes correspond to 1 errors. On the other hand, if we fix , the ratio changes from in a model with , to in a model with .
4.2 Effects of completeness and cluster selection function
In the following subsections we will discuss how our results change when we take into account the lack of completeness and when we introduce a realistic photometric galaxy cluster selection function.
4.2.1 The effect of sample completeness and survey area
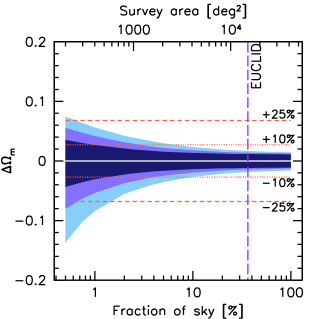
Let us consider here the case in which a fraction of arcs are missed, independently of the properties of the lens configurations (, , ). This may happen because some arcs may escape detection for some particular configurations of the light distribution within the cluster, or when the separation between cluster and foreground galaxies is made difficult by the lack of precise color information. The total arc counts may also diminish because we are performing our search in a reduced effective area, smaller than the one of the running survey. In this situation losing of the counts is equivalent to observe a portion of sky smaller than the original survey. The obvious consequence of a reduction of the number of observed arcs is that the Poissonian uncertainty grows and can start to dominate with respect to the cosmic variance, when accounting for the total error budget. To quantify this effect, in Fig. 9 we show, as a function of the fraction of the sky covered by the arc search, the variation of the error bar on the parameter , when the value of is a priori fixed to its reference value (), as it may happen if independently measured from other cosmological probes. Dark, medium and light blue regions refer to the cases of arcs with , and , respectively, while the horizontal dotted (dashed) lines indicate an accuracy of 10 (25) per cent on . From the figure it is clear that arcs with , being more numerous, give stronger contraints and are less affected by possible incompleteness problems. However, there is a difficulty when dealing with them because they can look like simple edge-on galaxies. For this reason the loss and misidentification of arcs are expected to depend on , being stronger for low- ratios. From this point of view, Fig. 9 is quite encouraging: if the survey area is sufficiently wide (larger than 10% of the whole sky), or equivalently if the arc finders are sufficiently efficient, the error budget is dominated by cosmic variance and there is not a significant difference in the constraining power between using arcs with or with . We remind that the SDSS (York et al., 2000) has an area of about 10,000 deg2, while the Euclid wide survey is expected to cover 15,000 deg2 (Laureijs et al., 2011).
4.2.2 The effect of the cluster selection function
Due to the high computational cost of the algorithms for arc detection, a possible strategy in future wide surveys is to run these codes only on small-size frames where galaxy clusters have been previously identified. Obviously, this originates a reduction of the effective number of arcs, which is strongly dependent on the specific cluster selection function of the survey.
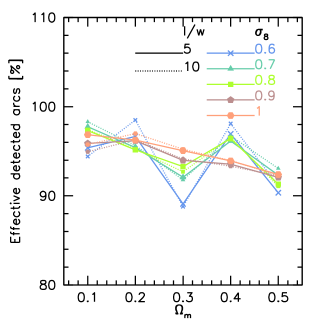
As a worked example, here we consider again the future ESA Euclid mission. Given the amount and quality of its data covering an area of 15,000 deg2, there will be at least three main ways to identify galaxy clusters: (i) from photometric data, (ii) from spectroscopic data, and (iii) from cosmic shear maps. As shown in sartoris15 , the one based on photometric data (see, for example, Bellagamba et al., 2011, and references therein) is expected to be largely the most efficient one. In this case, the minimum mass of galaxy clusters having a number of members larger than 3 times the r.m.s. of the field galaxy counts is expected to be between and in the redshift range here considered (sartoris15). Compared to the minimum mass needed to produce critical lines for sources located at redshift (see Fig. 5), the Euclid cluster selection is then slighly higher on a limited redshift range only, namely between and . This means that limiting the search for arcs to frames where galaxy clusters have been already identified is expected to not reduce dramatically the number of detected arcs. This is confirmed in Fig. 10, where we show the fraction of arcs that can be effectively detected following this strategy. Same colors indicate same values of , as labeled in the figure, while solid and dotted lines refer to arcs with and , respectively. For the cosmological models here considered, the reduction varies between 2 and 10 per cent and is almost independent of . For the reference WMAP7 model, the percentage of effectively detected arcs remains about 95 per cent.
In Fig. 11 we show the relative differences in the arc counts between each cosmological model and the reference WMAP7 cosmology, considering only arcs produced by galaxy clusters above the Euclid photometric selection function. In the figure, the color scale is identical to that adopted in the upper panel of Fig. 4. The white crosses represent the degeneration curve we found considering the total number of arcs, i.e. without applying the cluster selection function. Although similar, the curve changes in a non negligible way, especially considering extreme values of the parameters. This underlines the importance of taking into account every kind of selection function when combining theory and observations in arc statistic studies, avoiding possible systematics.
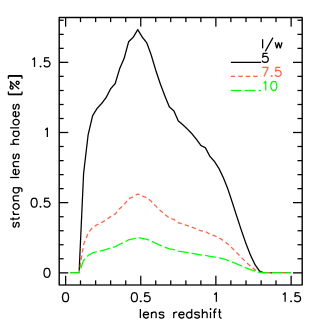
The presence of strong lensing features like arcs can represent a complementary way to confirm the presence of a galaxy cluster. Moreover arcs can be used to improve the estimates of the mass of galaxy clusters, a fundamental ingredient to fully exploit the evolution of their abundance as cosmological probe. For this reason it is important to compute what is the fraction of the galaxy clusters identified in the Euclid photometric survey, which are able to produce at least one giant arc. The result for the reference WMAP7 cosmology as a function of redshift is shown in Fig. 12 for arcs with , 7.5 and 10 (black solid, red dashed and green long-dashed lines, respectively). Typical mean values are around 1 per cent, 0.33 per cent and 0.15 per cent for , 7.5 and 10, respectively. From the figure we notice that the strong lens fraction peaks around : this behaviour is a combined effect between the well of the photometric selection function around redshift and the peak – around the same redshifts – of the strong lens counts. Interestingly, for redshift the percentage tends to vanish. Finally we notice that the fact that the strong lensing selection function can be smaller than the photometric cluster one would allow in principle to add extra objects to the Euclid cluster sample by looking for strong lensing features only. However this would require to run the algorithms for arc detection blindly in different areas of the survey. Considering the reference WMAP7 model and arcs with , the gain would correspond to approximately 300 extra objects only, all having a relatively low redshift ().
Therefore, we can conclude that arc statistics represents a complementary tool to identify galaxy clusters or eventually to prove their presence. In particular, arcs with a small ratio are the best tracers, since they are more numerous, but, at the same time, they are the more difficult to identify because of their similarity with non-lensed galaxies. Finally, our results underline that the codes for arc identification can be run on single frames where galaxy clusters have been already detected with no consequences on the cosmological predictive power of arc statistics.
5 A test-bed for the method: the CLASH survey
While this paper focuses on the sensitivity of arc statistics to cosmological parameters like and , it is worth mentioning that another paper has been recently submitted by our collaborators Xu et al. (2015) to compare theoretical predictions of arc abundances in a CDM cosmological model and observations. More precisely, in this other work MOKA has been used to build up halos reproducing the properties of the X-ray selected galaxy clusters belonging to the CLASH sample (Postman et al., 2012). Numerical hydro-dynamical simulations tailored to reproduce the CLASH selection function (Meneghetti et al., 2014) are also used to derive theoretical predictions. Thus, the work of Xu et al. (2015) provides the best opportunity for validating our methodology against more complex models of the cluster mass distribution and against observed clusters with a known selection function.
The results of this study show that there is an excellent agreement between expectations based on MOKA halos and numerical simulations and the arc counts in the CLASH clusters. More specifically, the lensing efficiency measured in the CLASH sample is arcs (with and ) per cluster. MOKA simulations return exactly the same number (), while numerical simulations give arcs per cluster. Therefore, according to Xu et al. (2015), in terms of efficiency to produce long and thin arcs, observations and simulations based on MOKA and numerical hydro-dynamical techniques come into full agreement. It is particularly significant that the methodology we have developed for modeling cluster lenses for arc-statistics calculations is fully capturing the complexity of numerically simulated halos, as evinced from the fact that the cross sections for giant arcs of MOKA generated halos are well matching those of the halos described in Meneghetti et al. (2014).
6 Conclusions
In this work we have investigated how the number of gravitational arcs depends on cosmology, focusing our attention on the (total) matter density parameter and on the initial normalisation power spectrum parameter . In more detail we have considered the ranges and . Our main results can be summarised as follows.
-
•
We confirm that arc statistics is very sensitive to the couple of parameters . In particular we find that the expected number of arcs is an increasing function of both parameters: this is mostly due to the fact that increasing these parameters boosts the number of lenses.
-
•
The efficiency in producing arcs in cosmologies with high values of is larger, since it has an effect also on the structure formation time, that in turn affects some lens structural properties (mainly concentration and triaxiality) relevant for strong lensing.
-
•
A strong degeneracy exists between the two considered cosmological parameters for the number of arcs ; for the reference WMAP7 model this is expressed by the relation (2), that is similar, but not equal, in shape to the degeneracy derived from galaxy cluster counts (see eq. 3). The differences between the two arise from the non negligible contribution to given by the lens structural properties – triaxiality, asymmetries, concentration, substructures and the BCG – and the lensing distance relation.
-
•
Arcs with small ratio are more suitable to constrain cosmological parameters, since they are more numerous. On the other hand, they could be more difficultly identified in the surveys because of their similarity with non-lensed galaxies. We find that if the survey area is sufficiently larger (more than 10% of the full sky) the error budget is dominated by cosmic variance, and the constraining power of arc counts becomes almost independent of the value of . In particular a survey covering 15,000 deg2 will be able to distinguish at more than level the two cosmological models supported by WMAP7 and Planck CMB data.
-
•
Considering future wide surveys, like the ESA Euclid mission, we find that searching for arcs only in frames where galaxy clusters have been previously detected will produce a loss of 2-10% of arcs only (depending on the cosmological model) and a consequent limited degradation of the constraining power of arc counts. This suggests that it will be not necessary to run the computationally expensive algorithms for arc detection on whole wide surveys.
In this paper we have discussed the potentiality and the capability of the giant arc statistic to constrain the matter density and the initial power spectrum normalisation parameter in light of the large data-sets that will become available from future wide-field surveys.
AKNOWLEDGEMENTS
We thank Barbara Sartoris, Cosimo Fedeli and Peter Schneider for useful discussions on the Euclid cluster selection function. CG’s research is part of the project GLENCO, funded under the European Seventh Framework Programme, Ideas, Grant Agreement n. 259349. CG thanks CNES for finantial support. LM acknowledge financial contributions from contracts ASI/INAF/I/023/12/0, by the PRIN MIUR 2010-2011 “The dark Universe and the cosmic evolution of baryons: from current surveys to Euclid” and by the PRIN INAF 2012. We are greatful to the referee Prasenjit Saha for his useful comments.
References
- Allen et al. (2011) Allen S. W., Evrard A. E., Mantz A. B., 2011, ARA&A, 49, 409
- Allen et al. (2003) Allen S. W., Schmidt R. W., Fabian A. C., Ebeling H., 2003, MNRAS, 342, 287
- Bartelmann et al. (1998) Bartelmann M., Huss A., Colberg J. M., Jenkins A., Pearce F. R., 1998, A&A, 330, 1
- Bartelmann & Schneider (2001) Bartelmann M., Schneider P., 2001, Physics Report, 340, 291
- Bellagamba et al. (2011) Bellagamba F., Maturi M., Hamana T., Meneghetti M., Miyazaki S., Moscardini L., 2011, MNRAS, 413, 1145
- Benson et al. (2013) Benson B. A., de Haan T., Dudley J. P., Reichardt C. L., Aird K. A., Andersson K., Armstrong R., Ashby M. L. N., Bautz M., Bayliss M., Bazin G., Bleem L. E., Brodwin M., Carlstrom J. E., Chang C. L., Cho H. M., Clocchiatti e. a., 2013, ApJ, 763, 147
- Boldrin et al. (2012) Boldrin M., Giocoli C., Meneghetti M., Moscardini L., 2012, MNRAS, 427, 3134
- Bonamigo et al. (2015) Bonamigo M., Despali G., Limousin M., Angulo R., Giocoli C., Soucail G., 2015, MNRAS, 449, 3171
- Borgani et al. (2001) Borgani S., Rosati P., Tozzi P., Stanford S. A., Eisenhardt P. R., Lidman C., Holden B., Della Ceca R., Norman C., Squires G., 2001, ApJ, 561, 13
- Clowe et al. (2006) Clowe D., Bradač M., Gonzalez A. H., Markevitch M., Randall S. W., Jones C., Zaritsky D., 2006, ApJ, 648, L109
- de Jong et al. (2013) de Jong J. T. A., Verdoes Kleijn G. A., Kuijken K. H., Valentijn E. A., 2013, Experimental Astronomy, 35, 25
- Despali et al. (2014) Despali G., Giocoli C., Tormen G., 2014, MNRAS, 443, 3208
- Eke et al. (1998) Eke V. R., Cole S., Frenk C. S., Patrick Henry J., 1998, MNRAS, 298, 1145
- Fedeli et al. (2006) Fedeli C., Meneghetti M., Bartelmann M., Dolag K., Moscardini L., 2006, A&A, 447, 419
- Gao et al. (2004) Gao L., White S. D. M., Jenkins A., Stoehr F., Springel V., 2004, MNRAS, 355, 819
- Giocoli et al. (2012a) Giocoli C., Meneghetti M., Bartelmann M., Moscardini L., Boldrin M., 2012a, MNRAS, 421, 3343
- Giocoli et al. (2012b) Giocoli C., Meneghetti M., Ettori S., Moscardini L., 2012b, MNRAS, 426, 1558
- Giocoli et al. (2007) Giocoli C., Moreno J., Sheth R. K., Tormen G., 2007, MNRAS, 376, 977
- Giocoli et al. (2008) Giocoli C., Tormen G., van den Bosch F. C., 2008, MNRAS, 386, 2135
- Henry (2004) Henry J. P., 2004, ApJ, 609, 603
- Hernquist (1990) Hernquist L., 1990, ApJ, 356, 359
- Jing & Suto (2002) Jing Y. P., Suto Y., 2002, ApJ, 574, 538
- Karoji (2009) Karoji H., 2009, in IAC Talks, Astronomy and Astrophysics Seminars from the Instituto de Astrofísica de Canarias Hyper Suprime-Cam (HSC) project for the SUBARU telescope. p. 146
- Kneib & Natarajan (2011) Kneib J.-P., Natarajan P., 2011, A&A Rev., 19, 47
- Komatsu et al. (2011) Komatsu E., Smith K. M., Dunkley J., Bennett C. L., Gold B., Hinshaw G., Jarosik N., Larson D., et al. 2011, ApJS, 192, 18
- Laureijs et al. (2011) Laureijs R., Amiaux J., Arduini S., Auguères J. ., Brinchmann J., Cole R., Cropper M., Dabin C., Duvet L., et al. 2011, ArXiv e-prints 1110.3193
- LSST Science Collaboration et al. (2009) LSST Science Collaboration Abell P. A., Allison J., Anderson S. F., Andrew J. R., Angel J. R. P., Armus L., Arnett D., Asztalos S. J., Axelrod T. S., et al. 2009, ArXiv e-prints 0912.0201
- Macciò et al. (2008) Macciò A. V., Dutton A. A., van den Bosch F. C., 2008, MNRAS, 391, 1940
- Mantz et al. (2010) Mantz A., Allen S. W., Rapetti D., Ebeling H., 2010, MNRAS, 406, 1759
- Mantz et al. (2014) Mantz A. B., Allen S. W., Morris R. G., Rapetti D. A., Applegate D. E., Kelly P. L., von der Linden A., Schmidt R. W., 2014, MNRAS, 440, 2077
- Meneghetti et al. (2007) Meneghetti M., Argazzi R., Pace F., Moscardini L., Dolag K., Bartelmann M., Li G., Oguri M., 2007, A&A, 461, 25
- Meneghetti et al. (2013) Meneghetti M., Bartelmann M., Dahle H., Limousin M., 2013, Space Sci.Rev.
- Meneghetti et al. (2003c) Meneghetti M., Bartelmann M., Moscardini L., 2003c, MNRAS, 346, 67
- Meneghetti et al. (2010a) Meneghetti M., Fedeli C., Pace F., Gottlöber S., Yepes G., 2010a, A&A, 519, A90+
- Meneghetti et al. (2011) Meneghetti M., Fedeli C., Zitrin A., Bartelmann M., Broadhurst T., Gottlöber S., Moscardini L., Yepes G., 2011, A&A, 530, A17+
- Meneghetti et al. (2008) Meneghetti M., Melchior P., Grazian A., De Lucia G., Dolag K., Bartelmann M., Heymans C., Moscardini L., Radovich M., 2008, A&A, 482, 403
- Meneghetti et al. (2014) Meneghetti M., Rasia E., Vega J., Merten J., Postman M., Yepes G., Sembolini F., Donahue M., et al. 2014, ApJ, 797, 34
- Merten et al. (2011) Merten J., Coe D., Dupke R., Massey R., Zitrin A., Cypriano E. S., Okabe N., Frye B., Braglia F. G., Jiménez-Teja Y., Benítez N., Broadhurst T., Rhodes J., Meneghetti M. e. a., 2011, MNRAS, 417, 333
- Metcalf & Madau (2001) Metcalf R. B., Madau P., 2001, MNRAS, 563, 9
- Narayan & Bartelmann (1999) Narayan R., Bartelmann M., 1999, in Dekel A., Ostriker J. P., eds, Formation of Structure in the Universe Gravitational lensing. p. 360
- Navarro et al. (1996) Navarro J. F., Frenk C. S., White S. D. M., 1996, ApJ, 462, 563
- Neto et al. (2007) Neto A. F., Gao L., Bett P., Cole S., Navarro J. F., Frenk C. S., White S. D. M., Springel V., Jenkins A., 2007, MNRAS, 381, 1450
- Planck Collaboration et al. (2014b) Planck Collaboration Ade P. A. R., Aghanim N., Armitage-Caplan C., Arnaud M., Ashdown M., Atrio-Barandela F., Aumont J., Baccigalupi C., Banday A. J., et al. 2014b, A&A, 571, A16
- Planck Collaboration et al. (2014a) Planck Collaboration Ade P. A. R., Aghanim N., Armitage-Caplan C., Arnaud M., Ashdown M., Atrio-Barandela F., Aumont J., Baccigalupi C., Banday A. J., et al. 2014a, A&A, 571, A20
- Postman et al. (2012) Postman M., Coe D., Benítez N., Bradley L., Broadhurst T., Donahue M., Ford H., Graur O., Graves G., Jouvel S., et al. 2012, ApJS, 199, 25
- Reiprich & Böhringer (2002) Reiprich T. H., Böhringer H., 2002, ApJ, 567, 716
- Rozo et al. (2010) Rozo E., Wechsler R. H., Rykoff E. S., Annis J. T., Becker M. R., Evrard A. E., Frieman J. A., Hansen S. M., Hao J., Johnston D. E., Koester B. P., McKay T. A., Sheldon E. S., Weinberg D. H., 2010, ApJ, 708, 645
- Schuecker et al. (2003) Schuecker P., Böhringer H., Collins C. A., Guzzo L., 2003, A&A, 398, 867
- Sehgal & et al. (2011) Sehgal N., et al. 2011, ApJ, 732, 44
- Sheth & Tormen (1999) Sheth R. K., Tormen G., 1999, MNRAS, 308, 119
- Spergel et al. (2013) Spergel D., Gehrels N., Breckinridge J., Donahue M., Dressler A., Gaudi B. S., Greene T., Guyon O., et al. 2013, ArXiv e-prints 1305.5422
- The Dark Energy Survey Collaboration (2005) The Dark Energy Survey Collaboration 2005, ArXiv Astrophysics e-prints arXiv:astro-ph/0510346
- Torri et al. (2004) Torri E., Meneghetti M., Bartelmann M., Moscardini L., Rasia E., Tormen G., 2004, MNRAS, 349, 476
- Vikhlinin et al. (2009) Vikhlinin A., Kravtsov A. V., Burenin R. A., Ebeling H., Forman W. R., Hornstrup A., Jones C., Murray S. S., Nagai D., Quintana H., Voevodkin A., 2009, ApJ, 692, 1060
- Xu et al. (2015) Xu B., Postman M., Meneghetti M., Seitz S., Zitrin A., Merten J., Maoz D., Frye B., Umetsu K., Zheng W., Bradley L., Vega J., Koekemoer A., 2015, ArXiv e-prints 1511.04002
- York et al. (2000) York D. G., Adelman J., Anderson Jr. J. E., Anderson S. F., SDSS Collaboration 2000, AJ, 120, 1579
- Zhao et al. (2003) Zhao D. H., Jing Y. P., Mo H. J., Börner G., 2003, ApJ, 597, L9