Phase transition of chemically doped uniaxial relaxor ferroelectric
Abstract
We report a neutron scattering study of the ferroelectric phase transition in Sr0.585Ce0.025Ba0.39Nb2O6 (SBN-61:Ce). We find no evidence for a soft transverse optic phonon. We do, however, observe anisotropic diffuse scattering. This scattering has inelastic and elastic contributions. In the paraelectric phase the susceptibility associated with the elastic diffuse scattering from SBN-61:Ce increases on approaching the transition temperature. In the ferroelectric phase the lineshape of the elastic scattering is consistent with the form expected for the ferroelectric domain walls. In contrast to the macroscopic observations, the scattering properties of Ce-doped crystal do not exhibit important changes with respect to those of pure Sr0.61Ba0.39Nb2O6.
pacs:
77.80.B Phase transitions; 61.05.fg Neutron scattering; 64.60.Cn,81.30.Hd Order-disorder transitions;I Introduction
Relaxor ferroelectrics, shortly relaxors, are disordered crystals with outstanding dielectric, piezoelectric and electro-optic properties Blinc (2011). It is generally believed that disorder is a key ingredient in the physics of relaxors, but a consistent model of their behavior has still not been developed Levanyuk and Blinc (2013); Takenaka et al. (2013); Sherrington (2013); Guzmán-Verri et al. (2013); Cowley et al. (2011); Phelan et al. (2014); Manley et al. (2014); Guzmán-Verri and Varma (2015). Even the basic criteria for a disordered ferroelectric to become a relaxor have not yet been established.
Strontium Barium Niobate, SrxBa1-xNb2O6 (SBN), is a group of disordered uniaxial ferroelectrics with unfilled tetragonal tungsten bronze structure Jamieson et al. (1968). The phase transition of SBN is strongly affected by the relative amount of Sr/Ba ions or via doping with rare-earth ions. The effects of the latter chemical modification are most often studied for Sr0.61Ba0.39Nb2O6 (SBN-61) as large and high-quality single crystals of this composition are available. The observation for SBN-61 is that even a minuscule concentration of Ce3+ ions affects strongly the ferroelectric phase transition Dec et al. (2000). More specifically, the anomaly in dielectric permittivity broadens and its frequency dispersion becomes much more pronounced in SBN-61:Ce as compared to the pure crystal. The peak in shifts towards lower temperatures upon increasing the doping level. The ferroelectric polarization is history-dependent near the transition temperature Granzow et al. (2004); Kleemann et al. (2006). There is a strong change in polarization aging under light illumination in SBN-61:Ce Granzow et al. (2002). Thus, the macroscopic properties of doped SBN-61 crystals have much in common with relaxors.
The phase transition of pure SBN-61 has been recently studied by neutron scattering Borisov et al. (2013); Gvasaliya et al. (2014); Ondrejkovic et al. (2014). On approaching from above the transition temperature, TC, a slow dynamic diffuse scattering (DS) emerges in the neutron spectra Gvasaliya et al. (2014); Ondrejkovic et al. (2014). It appears to account for divergent dielectric permittivity Gvasaliya et al. (2014) and has a characteristic energy scale in the eV range Ondrejkovic et al. (2014). Well below TC the DS appears in neutron spectra as elastic component and can be fully ascribed to ferroelectric domain walls (DW) Gvasaliya et al. (2014). Thus, despite inherent chemical disorder the scattering from SBN-61 is similar to the one from classic order-disorder ferroelectric. It is therefore tempting to establish if doping, which considerably modifies the macroscopic properties of SBN-61, leads to substantial changes in the microscopic properties as seen by neutrons. We report here a neutron scattering study of the ferroelectric phase transition in Ce-doped Sr0.61Ba0.39Nb2O6 single crystal. In stark contrast with modifications of the macroscopic properties induced by doping, we do not find important changes in the scattering properties with respect to the parent pure material.
II Sample & the Experimental Details
Sr0.61Ba0.39Nb2O6 has a tetragonal structure. Above Tc the space group of SBN is , while below the ferroelectric phase transition temperature the space group is . The unit cell contains 5 formula units, so that five Sr/Ba ions are distributed over six available positions. These two ions have considerably different ionic radii (r = 1.12 Å and r = 1.34 Å) Shannon (1976). The structure of SBN is a three dimensional network of distorted Nb/O octahedra connected together so that there are pentagonal, square and triangular tunnels. The smallest triangular tunnels are not occupied. Only strontium ions reside at the square tunnels. Finally, strontium and barium ions are distributed over the largest pentagonal channels. As the Sr2+ and Ba2+ ions have formally the same charge there are no strong electrostatic forces related with the distribution of the Sr and Ba ions. The possible charge irregularity is then due to presence of unfilled positions in the triangular channels.
An obvious charge disorder is introduced in SBN upon doping it with trivalent cerium. Ce3+ ions occupy Sr2+ sites in the lattice Chernaya et al. (1998), although there are evidences for their slight shifts with respect to the nominal positions of strontium Wingberm hle et al. (2000). The Ce3+ ions are likely to cause substantial electrostatic forces related to simultaneous charge and chemical randomness. Such a modification brings SBN closer to the Pb-based cubic relaxors, such as PbMg1/3Nb2/3O3 (PMN).
We performed a neutron scattering study of Sr0.61Ba0.39Nb2O6 doped by 2.5 atomic %Ce, Sr0.585Ce0.025Ba0.39Nb2O6 (SBN-61:Ce). The crystal was grown by using modified Stepanov process Ivleva (2009). A congruently melting composition of Sr0.61Ba0.39Nb2O6 was doped by 0.1 wt.% CeO2. High quality single crystals grow even at this rather large concentration of Ce ions Ivleva et al. (2002). The ferroelectric phase transition temperature for this crystal was estimated from dielectric measurements to be T 348 K. The precise determination of Tc for doped crystals is problematic as the increase in polarization or in linear optical birefringence turns out to be less sharp in temperature Kleemann et al. (2000, 2006). Nevertheless, the T 348 K is also inferred from birefringence results for a crystal with amount of Ce ions nearly identical to our sample Kleemann et al. (2000).
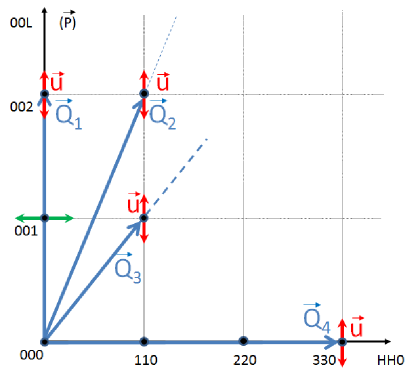
We used a single crystal of SBN-61:Ce with dimensions of cm3. The mosaic spread was within the resolution of the spectrometer. The sample was aligned in the 0,0,1/1,1,0 scattering plane. This experimental geometry is sketched in Fig. 1. The lattice parameters of SBN-61:Ce at T=300 K are Å, and Å. The crystal was mounted in a displex refrigerator that enabled the temperature to be controlled between 20 K and 500 K.
The experiments were conducted with the cold neutron 3-axis spectrometer TASP Semadeni et al. (2001), situated at the end of a curved guide at the SINQ facility (PSI, Switzerland). The energy of the scattered neutrons was kept fixed to 8.04 meV and a PG filter was installed in front of the analyzer. Most of the data was collected with the collimation in the horizontal plane from reactor to detector as open-80′-sample-80′-80′, giving an energy resolution of 0.40 meV. Some data was taken with a tighter collimation: open-20′-sample-20′-20′, improving the resolution to 0.2 meV.
III Results
III.1 Low-energy excitations across Tc
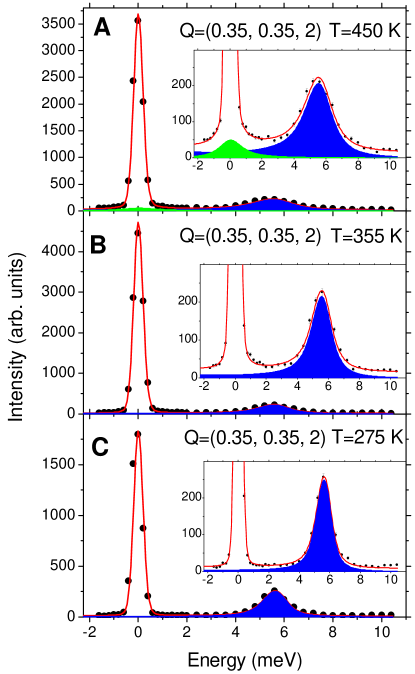
Fig. 2 shows the neutron spectra for a wave-vector transfer at temperatures above, near, and below the phase transition T348 K. This data shows two peaks. One of them is centered at zero energy transfer, while the other one is an inelastic peak. The inelastic peak shifts towards higher energies and broadens at higher wavevector transfers . Qualitatively, the most pronounced changes in these spectra are the significant variations in elastic intensity and a reduction in width of the inelastic peak upon decrease of temperature. No intensity that could be associated with a low-energy transverse optic phonon is observed, despite the frequency range of our scans covers positions of several optic phonons detected in SBN by infrared reflectivity Buixaderas et al. (2005) and Raman spectroscopy Buixaderas et al. (2013); Giles et al. (1995).
For quantitative analysis of the neutron data we develop an appropriate model. First attempts were made to describe the spectra by a sum of a Gaussian peak at zero energy transfer and a damped harmonic oscillator (DHO). This model failed to describe the experimental data satisfactorily. The deficiency of this scattering function was especially pronounced at low energy transfers, at the tails of the peak centered at zero energy. These tails suggested importance of an additional, resolved in energy, contribution. The model was therefore extended by including a Lorentzian peak centered on zero energy transfer:
| (1) | |||||
In Eq. 1 the first term describes the elastic, limited in energy by experimental resolution, diffuse scattering (EDS). The second term accounts for phonon scattering. The last term approximates the energy-resolved diffuse scattering (IDS). The components with a finite-energy width have to be combined with the detailed balance factor . and are the wavevector-dependent susceptibilities of the phonon and of the IDS. The dispersion of the TA phonon was approximated as , where . The stiffness , damping , , and the scale factors , , and were allowed to vary as a function of wavevector without restrictions. The scattering function Eq. 1 was convoluted with the resolution function by using the ResLib4.2 library Zheludev (2001). A constant background was finally added to the intensity. The fitted results gave a good description of the data as shown in Fig. 2.
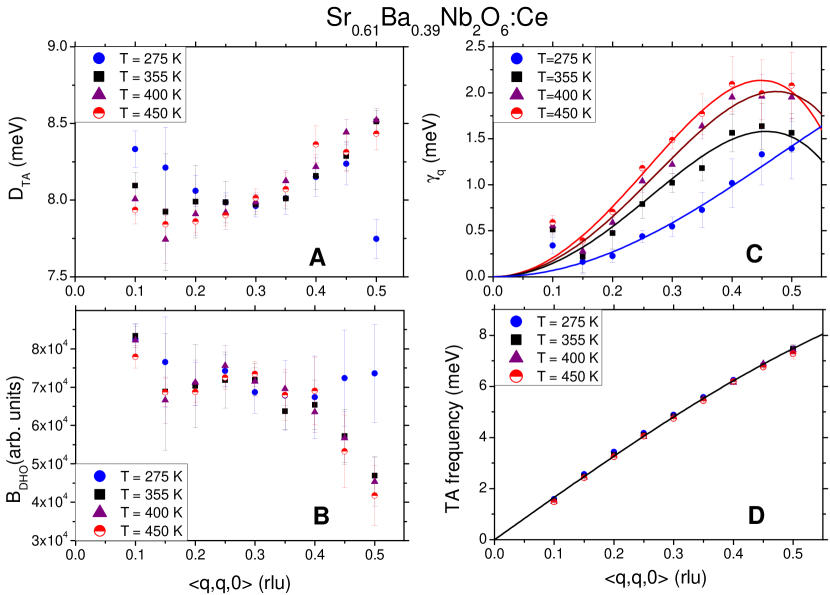
We now describe the temperature evolution of the components in the low-energy neutron spectra from SBN-61:Ce. The parameters of the DHO function used to approximate the TA phonon are shown in Fig. 3 as a function of wavevector for several temperatures. As is clearly seen in Fig. 3A the stiffness of the TA phonon across the Tc does not change within the errors. No scattering that could be associated with an optic phonon was detected. This suggests that there is no softening of a low-energy optic branch. In other words, we do not find any evidence for noticeable decrease in the frequencies of the phonons upon approaching the transition temperature. It might happen, however, that such a softening of an optic phonon is not directly observed in neutron spectra due to unfavorable structure factor around a particular reciprocal lattice point. This hidden softening could still significantly distort the lineshape of the TA phonon and thus change its structure factor and/or damping Cowley et al. (1976); Cowley (1980). As follows from the temperature evolution of these parameters shown in Figs. 3(B,C) this is not the case in SBN-61:Ce. The (squared) structure factor of the TA phonon is fairly temperature-independent. The damping of the TA phonon simply decreases towards lower temperatures; this behavior is just as expected for a weakly anharmonic system. The energy resolved diffuse scattering is weak as can be seen from Fig. 2. As a function of wavevector the intensity and the width of IDS do not show any regular dependence. The intensity of the IDS just gradually diminishes at lower temperatures.
Altogether, our results show that energy-resolved components in the neutron spectra of SBN-61:Ce do not play an important rle in the ferroelectric phase transition of this crystal. As is obvious from Fig. 2 the most noticeable changes in the spectra are in the elastic, limited in energy by the spectrometer resolution, component. At the peak intensity of the EDS varies by a factor 3 in the considered temperature range. One should therefore conclude that the critical dynamics in SBN-61:Ce is concentrated at low energies.
III.2 Shape of neutron diffuse scattering from SBN-61:Ce
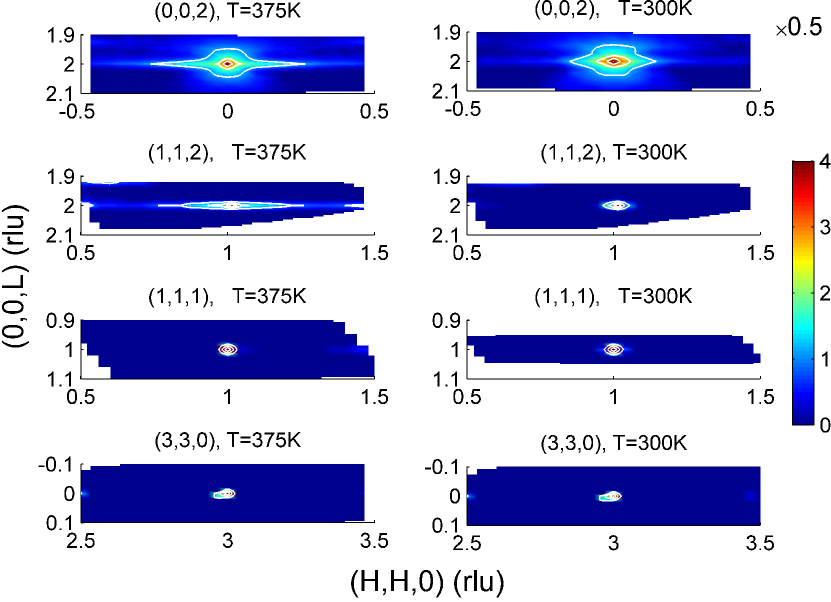
SBN-61:Ce is considerably disordered crystal. In such a case there might be several equally important sources of EDS. To get a hint on the origin of the EDS that showed strong temperature dependence we analyze the distributions of the EDS from SBN-61:Ce near several Bragg peaks above and below the ferroelectric phase transition. Corresponding false color plots for the data taken at T = 375 K and at T = 300 K are shown in Fig. 4. Around the (0,0,2) and the (1,1,2) Bragg positions at T = 375 K the EDS in the form of lines extended along the direction is observed. However, no similar EDS is detected around the (1, 1, 1) and (3, 3, 0) Bragg peaks. Such shape of the EDS is generally associated with pronounced quasi-1D ionic correlations along the ferroelectric -axis. Indeed, in the latter case a diffuse scattering would form the planes (sheets) in the reciprocal space that are orthogonal to the direction with pronounced correlations. In the geometry of our experiments these sheets appear as sharp lines perpendicular to the -axis. Similar distribution of the EDS is actually observed in our data taken in the vicinity of the (0, 0, 2) and (1, 1, 2) positions. Also, the absence of the EDS around the (3,3,0) position is a natural consequence of the displacive nature of the quasi-1D correlations. Indeed, for any scattering associated with ionic displacements the intensity should contain the polarization factor Krivoglaz (1996) of the form , where is the total wavevector transfer and is the pattern of the ionic displacements. Clearly, for the displacements occurring along the -axis, this factor entirely suppresses the intensity near the positions of the (h,h,0)-type. In addition, the significant difference in the EDS near the (0, 0, 2) and the (1, 1, 2)& (1, 1, 1) positions suggests a complex pattern of the ionic displacements along the - axis. Let us compare the EDS intensities taken at T= 375 K along the direction around these three Bragg positions (See Fig. 4). The reduction in the EDS intensity upon changing from the (0,0,2) to the (1,1,2) point is a factor of 10 and the intensity around the (1, 1, 1) peak in turn is much weaker. As the polarization factor stays nearly the same for the (0,0,2) to the (1,1,2) positions (see Table 1), the difference in the EDS intensity is likely due to complex pattern of the ionic displacements.
| ,Å-1 | |||
| 001 | 1.46 | 0 | 2.1 |
| 002 | 2.92 | 0 | 8.5 |
| 112 | 3.00 | 14 | 8.4 |
| 111 | 1.63 | 26 | 2.1 |
| 330 | 2.15 | 90 | 0 |
At T = 300 K, in the ferroelectric phase, the EDS becomes much more condensed underneath the Bragg peaks. This is easily observed in the data collected near the (0, 0, 2) Bragg peak (see Figs. 4a,b). The nearly temperature-independent halo around the (0, 0, 2) position is very weak as compared to the EDS. This scattering is likely due to contribution from acoustic phonons to the elastic intensity. Importantly, no additional asymmetric in wavevectors component in diffuse scattering have been detected in the vicinity of the reciprocal lattice positions. This means that possible Huang scattering in SBN-61:Ce is negligible. As the maps of the elastic neutron scattering were collected around the Bragg peaks with different parities in (H,K,L), we conclude that rather high doping level by Ce did not cause considerable excessive strain in the crystal. Thus the the temperature-dependent EDS originates from chain-like ferroelectric correlations. The behavior of this EDS in paraelectric (Section III.3) and ferroelectric (Section III.4) phases is considered below.
III.3 Critical scattering in paraelectric phase
The elastic neutron scattering was studied as a function of temperature by performing scans along the q, q, 0 direction across the (0, 0, 1) and (0, 0, 2) Bragg peaks. This choice was dictated by the following reasons. Spontaneous polarization in SBN:Ce appears along the -axis, thus the geometric condition for a transverse geometry is best fulfilled for the q, q, 0 direction with respect to the (0, 0, L)-type Bragg peaks. Also, the neutron structure factors for the (0, 0, 1) and (0, 0, 2) Bragg peaks differ strongly. Probing simultaneously the scattering around such two reflections ensures reliable data collection and parametrization.
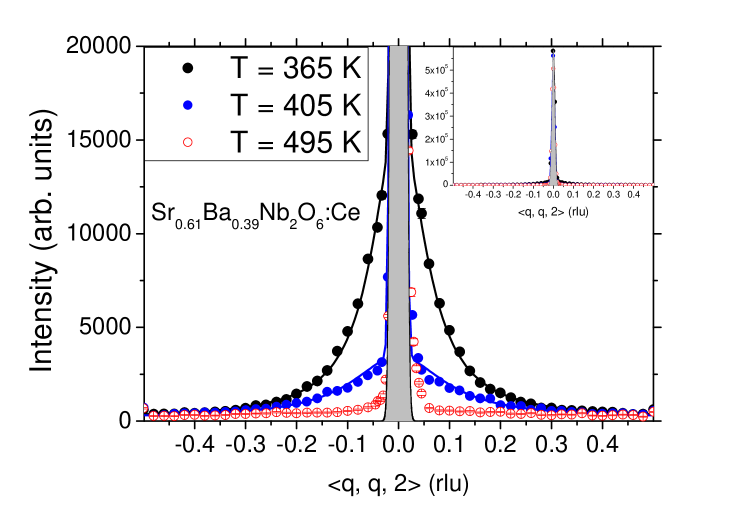
Figure 5 shows elastic neutron scans taken at several temperatures above the ferroelectric phase transition. These scans consist of two obvious components. The intense Bragg peak whose width is determined by experimental resolution and less intense but extended in wavevectors diffuse scattering centered at . At higher temperatures this scattering is very broad and identifying its lineshape is difficult. On cooling towards T the diffuse intensity rapidly increases. This tendency is just opposite to the behavior of IDS discussed in section III.1. Thus, the broader component of transverse scans shown in Fig. 5 is elastic diffuse scattering, the EDS.
The energy width of the EDS in SBN-61:Ce could not be resolved in our experiments. This requires an assumption on its intrinsic nature, whether this diffuse scattering is caused by static or dynamic fluctuations. Following the approach used for pure SBN-61 Gvasaliya et al. (2014), we assume the EDS is a critical scattering caused by dynamic, although very slow fluctuations. In this case, the neutron intensity can be approximated as
| (2) |
where is the susceptibility associated with the EDS taken at the , is the inverse of the correlation length, and T is the temperature. In the range from 405 K down to K the elastic scans collected around the (0, 0, 1) and the (0, 0, 2) positions were fitted to a Gaussian Bragg peak together with a Lorentzian curve convoluted with the Gaussian resolution width. Examples of such fits are presented in Fig. 5 for T = 405 K and T = 365 K. Within this approach the susceptibility and the width of the EDS were obtained as a function of temperature.
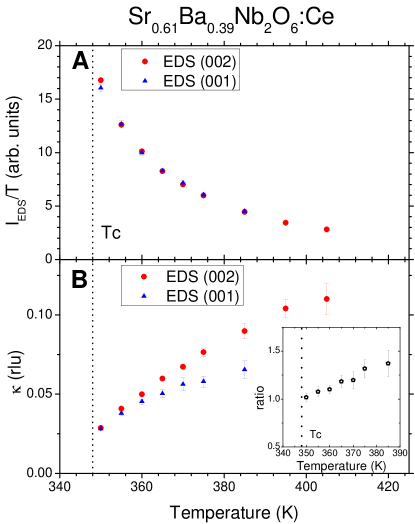
Figure 6a shows the temperature dependence of the integrated intensity of the EDS scattering from SBN-61:Ce measured around the (0, 0, 1) and the (0, 0, 2) positions. probed around both Bragg reflections increases on approaching the phase transition from above. Furthermore, as discussed in Sections III.1&III.2, we did not observe any other strongly temperature-dependent scattering in the vicinity of T. Taken together these observations imply that fluctuations producing the EDS account for the dielectric anomaly associated with ferroelectric transition of SBN-61:Ce.
On approaching the phase transition one expects not only diverging susceptibility of critical fluctuations, but also condensing the associated intensity at the propagation vector. The width of the EDS from SBN-61:Ce, however, does not decrease to zero near T as shown in Fig. 6b. In contrast to the susceptibility, the width of the EDS probed in the vicinity of the (0, 0, 1) and the (0, 0, 2) Bragg peaks exhibits dissimilar temperature evolution. At higher temperature their ratio is about 1.3, but progressively becomes unity upon approaching T. This unusual behavior is possibly related with a complicated pattern of ionic displacements producing neutron EDS from SBN-61:Ce.
III.4 Diffuse scattering in the ferroelectric phase: Domain Walls
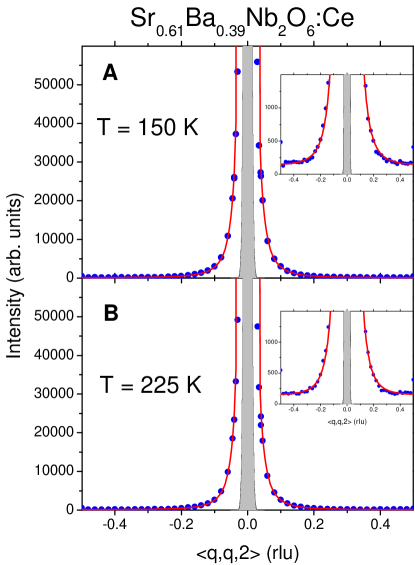
The distribution of neutron elastic scattering in the ferroelectric phase of SBN-61:Ce is very similar to that in the paraelectric phase (see Section III.2). However, below T the EDS becomes considerably sharper in wavevectors and much more intense near . Thus separating the EDS from Bragg peaks in the ferroelectric phase is more complicated. Furthermore, just below T there are two contributions to the EDS. First, below T the sample breaks up into ferroelectric domains. This causes intense diffuse scattering from the domain walls. In addition, just below T there should be a contribution to the EDS caused by the critical scattering. The integrated susceptibility of the DS follows real part of dielectric permittivity closely for TT. A similar behavior is expected for TT. An inspection of Fig. 6a suggests that the contribution from the critical scattering should become negligible for T300 K. We can expect the EDS from SBN-61:Ce is dominated by scattering from the ferroelectric domain walls below this temperature. With these assumptions we concentrate on the treatment of the EDS in the temperature range 150 - 300 K.
To analyze the lineshape of the EDS we need to recall the results on the diffuse scattering from the domain walls Cowley et al. (1976); Bruce (1981); Andrews and Cowley (1986); Collins et al. (1979); Gvasaliya et al. (2014). For uniaxial ferroelectrics an analytical expression for the scattering intensity was obtained under the following assumptions. If no electric field is applied to a specimen, below T the crystal breaks into the ferroelectric domains. They are expected to be macroscopically large along the direction of spontaneous polarization. These domains are likely to form the so-called 180o structure with their normals orthogonal to the unique ferroelectric axis . It is assumed that the spontaneous polarization is proportional to the ionic displacement field along as where . This leads to the one-dimensional scattering function . Extending this result to three dimensions in wavevectors space requires further approximations. Namely, the domain walls are assumed to be randomly arranged in the a-b plane of the crystal com and so interference effects are negligible in the scattering. Taken together, these arguments lead to the following scattering function for the diffuse scattering induced by the domain walls:
| (3) |
here is a half of the average thickness of the domain walls, is a constant proportional to their density, the reduced wavevector runs from respective Bragg peak, . accounts for elastic nature of the scattering. Lorentzian with small accounts for large size of the domains along the unique ferroelectric direction. In our fits was fixed to the value 0.0005 rlu to balance the calculation time and numeric precision of the modeling.
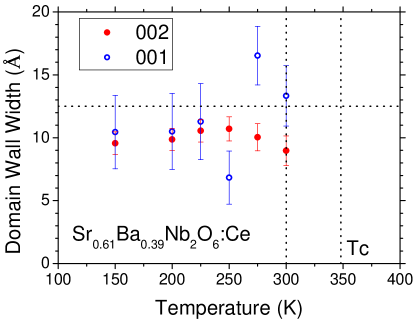
The scattering function given by Eq. 3 was convoluted with the spectrometer resolution function by using ResLib4.2 library Zheludev (2001) and a constant background was added. The best fit results for SBN-61:Ce are shown in Fig. 7. The model Eq. 3 reproduces the data taken around the Bragg peaks (0,0,1) and (0,0,2) in the temperature range 220 K – 300 K. The fitted curves describe the data spanning over more than 3 orders of magnitude in intensity. Such an agreement further validates our approach. The domain wall density (which is just the scale factor in the model) was found to be temperature independent. The temperature dependence of the width of the ferroelectric domain walls is shown in Fig. 8. In the addressed temperature range the width probed by neutron scattering near the (0,0,1) and (0,0,2) Bragg peaks is the same. This suggests that the pattern of displacements remains unchanged through the domain walls. The width of the domain walls in SBN-61:Ce is close to the lattice constant and is similar to the values found in other uniaxial ferroelectrics Prokert and Schalge (1978); Cowley et al. (1976); Currie et al. (1979); Peng and Bursill (1982).
IV Discussion and Conclusions
As a rule, phase transitions are related with a condensation of low-energy modes. In particular, on approaching the ferroelectric phase transition the transverse polarization fluctuations should slow down and the associated susceptibility diverges. The spontaneous polarization appears in SBN crystals along the - axis. Thus, in pure and Ce-doped SBN-61 Gvasaliya et al. (2014) we studied in details the low-energy transverse modes propagating along the q, q, 0 direction. Getting a few steps forward, the scattering properties of the two crystals are very similar.
We were able to model the intensity of the TA phonon in Ce-doped SBN-61 assuming DHO lineshape and sinusoidal dispersion relation (see III.1). This approach allows for more reliable estimates of the damping, but is different from previously employed in other studies of SBN Gvasaliya et al. (2014); Prokert and Schalge (1978). To compare more closely the TA dispersion in SBN-61:Ce with that in SBN crystals of other compositions the phonon frequencies were also obtained via simple Lorentzian fits. These results are shown in Fig. 3D for several temperatures.
The critical scattering observed in the paraelectric phase of Ce-doped SBN-61 is consistent with chain-like correlations of ionic displacements. However, the displacements pattern has additional modulation leading to unexpected difference in width of the EDS probed around different Bragg positions but along the same direction in reciprocal space. Upon approaching the transition temperature this width of the EDS decreases and the associated susceptibility increases.
In the ferroelectric phase the EDS from Ce-doped SBN-61 is produced by the domain walls. The width of this DW inferred from the data taken around the (0,0,1) and (0,0,2) Bragg reflections is essentially the same and well below T does not depend noticeably on the temperature.
In summary we compare the properties of unmodified and Ce-doped SBN-61 as seen by neutron scattering. The dispersion curve of the TA phonon propagating along the q, q, 0 direction does not change upon doping by Ce Gvasaliya et al. (2014); Prokert and Schalge (1978). The critical scattering observed in the paraelectric phase of Ce-doped SBN-61 is similar to that one from undoped SBN crystals and in both cases its distribution is consistent with chain-like correlations of ionic displacements. An additional charge disorder introduced by Ce3+ ions does not lead to noticeable change in ferroelectric DW thickness which was found to be Å for both crystals. Despite the significant differences in macroscopic properties, the lattice dynamics, critical dynamics and domain structure of Ce-doped SBN-61 surprisingly is almost identical to that of SBN-61.
V Acknowledgments
The experiments were performed at the SINQ facility at PSI. We thank Markus Zolliker and Walter Latscha for excellent technical support.
References
- Blinc (2011) R. Blinc, Advanced Ferroelectricity (Oxford University Press, 2011).
- Levanyuk and Blinc (2013) A. P. Levanyuk and R. Blinc, Phys. Rev. Lett. 111, 097601 (2013).
- Takenaka et al. (2013) H. Takenaka, I. Grinberg, and A. M. Rappe, Phys. Rev. Lett. 110, 147602 (2013).
- Sherrington (2013) D. Sherrington, Phys. Rev. Lett. 111, 227601 (2013).
- Guzmán-Verri et al. (2013) G. G. Guzmán-Verri, P. B. Littlewood, and C. M. Varma, Phys. Rev. B 88, 134106 (2013).
- Cowley et al. (2011) R. A. Cowley, S. N. Gvasaliya, S. G. Lushnikov, B. Roessli, and G. M. Rotaru, Advances in Physics 60, 229 (2011).
- Phelan et al. (2014) D. Phelan, C. Stock, J. A. Rodriguez-Rivera, S. Chi, J. Le o, X. Long, Y. Xie, A. A. Bokov, Z.-G. Ye, P. Ganesh, and P. M. Gehring, Proceedings of the National Academy of Sciences 111, 1754 (2014).
- Manley et al. (2014) M. E. Manley, J. W. Lynn, D. L. Abernathy, E. D. Specht, O. Delaire, A. R. Bishop, R. Sahul, and J. D. Budai, NATURE COMMUNICATIONS , 3683 (2014).
- Guzmán-Verri and Varma (2015) G. G. Guzmán-Verri and C. M. Varma, Phys. Rev. B 91, 144105 (2015).
- Jamieson et al. (1968) P. B. Jamieson, S. C. Abrahams, and J. L. Bernstein, The Journal of Chemical Physics 48, 5048 (1968).
- Dec et al. (2000) J. Dec, W. Kleemann, T. Woike, and R. Pankrath, European Physical Journal B 14, 627 (2000).
- Granzow et al. (2004) T. Granzow, T. Woike, M. Wöhlecke, M. Imlau, and W. Kleemann, Phys. Rev. Lett. 92, 065701 (2004).
- Kleemann et al. (2006) W. Kleemann, J. Dec, V. V. Shvartsman, Z. Kutnjak, and T. Braun, Phys. Rev. Lett. 97, 065702 (2006).
- Granzow et al. (2002) T. Granzow, U. Dörfler, T. Woike, M. Wöhlecke, R. Pankrath, M. Imlau, and W. Kleemann, Europhys. Lett. 57, 597 (2002).
- Borisov et al. (2013) S. Borisov, N. Okuneva, S. Vakhrushev, A. Naberezhnov, T. Volk, and A. Filimonov, Physics of the Solid State 55, 334 (2013).
- Gvasaliya et al. (2014) S. N. Gvasaliya, R. A. Cowley, L. I. Ivleva, S. G. Lushnikov, B. Roessli, and A. Zheludev, Journal of Physics: Condensed Matter 26, 185901 (2014).
- Ondrejkovic et al. (2014) P. Ondrejkovic, M. Kempa, J. Kulda, B. Frick, M. Appel, J. Combet, J. Dec, T. Lukasiewicz, and J. Hlinka, Phys. Rev. Lett. 113, 167601 (2014).
- Shannon (1976) R. D. Shannon, Acta Crystallographica Section A 32, 751 (1976).
- Chernaya et al. (1998) T. Chernaya, B. Maksimov, I. Verin, L. Ivleva, and V. Simonov, CRYSTALLOGRAPHY REPORTS 43, 986 (1998).
- Wingberm hle et al. (2000) J. Wingberm hle, M. Meyer, O. F. Schirmer, R. Pankrath, and R. K. Kremer, Journal of Physics: Condensed Matter 12, 4277 (2000).
- Ivleva (2009) L. Ivleva, Bulletin of the Russian Academy of Sciences. Physics 73, 1338 (2009).
- Ivleva et al. (2002) L. Ivleva, T. Volk, D. Isakov, V. Gladkii, N. Polozkov, and P. Lykov, Journal of Crystal Growth 237-239, Part 1, 700 (2002).
- Kleemann et al. (2000) W. Kleemann, J. Dec, P. Lehnen, T. Woike, and R. Pankrath, AIP Conference Proceedings 535, 26 (2000).
- Semadeni et al. (2001) F. Semadeni, B. Roessli, and P. Boni, Physica B: Condensed Matter 297, 152 (2001), proceeding of the Third International Workshop on Polarised Neutrons.
- Buixaderas et al. (2005) E. Buixaderas, M. Savinov, M. Kempa, S. Veljko, S. Kamba, J. Petzelt, R. Pankrath, and S. Kapphan, Journal of Physics: Condensed Matter 17, 653 (2005).
- Buixaderas et al. (2013) E. Buixaderas, I. Gregora, J. Hlinka, J. Dec, and T. Lukasiewicz, Phase Transitions 86, 217 (2013).
- Giles et al. (1995) N. C. Giles, J. L. Wolford, G. J. Edwards, and R. Uhrin, Journal of Applied Physics 77, 976 (1995).
- Zheludev (2001) A. Zheludev, (2001), resLib4.2.
- Cowley et al. (1976) R. A. Cowley, J. D. Axe, and M. Iizumi, Phys. Rev. Lett. 36, 806 (1976).
- Cowley (1980) R. Cowley, Advances in Physics 29, 1 (1980).
- Krivoglaz (1996) M. Krivoglaz, Diffuse scattering of x-rays and neutrons by fluctuations (Springer, 1996).
- Bruce (1981) D. A. Bruce, Journal of Physics C: Solid State Physics 14, 5195 (1981).
- Andrews and Cowley (1986) S. R. Andrews and R. A. Cowley, Journal of Physics C: Solid State Physics 19, 615 (1986).
- Collins et al. (1979) M. A. Collins, A. Blumen, J. F. Currie, and J. Ross, Phys. Rev. B 19, 3630 (1979).
- (35) The assumptions on the shape of the ferroelectric domains in SBN are in agreement with observations made by piezoresponse force microscopy [38].
- Prokert and Schalge (1978) F. Prokert and R. Schalge, physica status solidi (b) 87, 179 (1978).
- Currie et al. (1979) J. F. Currie, A. Blumen, M. A. Collins, and J. Ross, Phys. Rev. B 19, 3645 (1979).
- Peng and Bursill (1982) J. Peng and L. A. Bursill, Philosophical Magazine A 45, 911 (1982).