The effect of a reversible shear transformation on plastic deformation of an amorphous solid
Abstract
Molecular dynamics simulations are performed to investigate the plastic response of a model glass to a local shear transformation in a quiescent system. The deformation of the material is induced by a spherical inclusion that is gradually strained into an ellipsoid of the same volume and then reverted back into the sphere. We show that the number of cage-breaking events increases with increasing strain amplitude of the shear transformation. The results of numerical simulations indicate that the density of cage jumps is larger in the cases of weak damping or slow shear transformation. Remarkably, we also found that, for a given strain amplitude, the peak value of the density profiles is a function of the ratio of the damping coefficient and the time scale of the shear transformation.
pacs:
62.20.F-, 61.43.Fs, 83.10.RsI Introduction
The mechanical properties of bulk metallic glasses, such as high strength and low ductility, are both of fundamental scientific interest and technological importance Schuh07 . It is now well recognized that the plastic deformation of metallic glasses below their glass transition temperature involves irreversible rearrangements of small clusters of atoms Argon79 . The plastic flow of amorphous materials in response to applied shear stress can be described using the shear transformation zone model, which takes into account the density and internal state of the localized zones Falk11 . In recent years, various deformation mechanisms including elementary plastic events and shear band formation were studied at different length and time scales using atomistic simulations and finite element modeling Rodney11 . Notably, the energy landscape analysis had shown that a large strain cycle rejuvenates the glass by increasing the potential energy, while a small strain cycle overages the glass by moving the system to deeper energy minima Lacks04 . However, many essential features of the deformation process in strained amorphous systems including a correlation between localized plastic events and distribution of avalanches are not fully understood.
The effect of inertia on steadily sheared disordered solids in the athermal quasistatic limit was examined in two and three dimensions using molecular dynamics simulations Salerno13 . It was found that the distribution of avalanche sizes obeys a power-law decay over about three orders of magnitude in drops of the potential energy density and shear stress, and the volume of plastically deformed regions is proportional to the energy dissipated in an avalanche Salerno13 . In the underdamped regime, the system can be carried over successive energy barriers to progressively lower minima leading to large avalanches, while in the overdamped case, avalanches are smaller and they typically consist of several disconnected regions oriented along diagonal lines Salerno13 . It was also shown that at finite strain rates and zero temperature, the correlation between local plastic events remains relevant, and the avalanche size scales as the inverse square root of strain rate in two dimensions Lemaitre09 .
In the last few years, a number of studies investigated oscillatory shear response of amorphous materials using atomistic simulations Priezjev13 ; Sastry13 ; Reichhardt13 ; Priezjev14 ; Losert14 , continuum modeling Perchikov14 , and experimental measurements Spaepen14 ; Cipelletti14 ; Arratia14 ; Echoes14 ; Arratia15 . It was found that below a certain strain amplitude, the disordered systems gradually evolve into dissipative limit cycles and particle rearrangements remain reversible, thus retaining memory of the initial conditions Sastry13 ; Priezjev13 ; Reichhardt13 ; Arratia14 ; Losert14 . The number of back and forth cycles required to reach steady state increases as the critical strain amplitude is approached from below Sastry13 ; Reichhardt13 . Surprisingly, it was shown that the cyclic deformation is accompanied by plastic rearrangements of atoms that are reversed by the end of each cycle Reichhardt13 ; Arratia14 . With further increasing strain amplitude, particle displacements become irreversible leading to a diffusive behavior and structural relaxation Priezjev13 ; Sastry13 ; Priezjev14 ; Losert14 .
The elastic response of a two-dimensional amorphous solid to a localized shear transformation was recently studied via molecular dynamics simulations in different damping regimes Puosi14 ; Nicolas15 . In this process, about twenty atoms within a circular inclusion were instantaneously sheared in a quiescent system and the time evolution of the displacement field was measured. It was demonstrated that the stationary solution for the disorder-averaged displacement field has a quadrupolar symmetry and it agrees well with the predictions of the continuum elasticity theory Puosi14 ; Eshelby57 . It was further observed that the transient regime is strongly dependent on the damping dynamics and the time dependence of the displacement field obtained from molecular dynamics simulations agrees with the continuum solution in the overdamped case at large times Puosi14 . The numerical analysis based on the finite element method that takes into account microscopic viscosity and the local elastic constants showed that the temporal evolution of the disorder-averaged displacement field is similar to the propagation of the elastic signal in a uniform medium Nicolas15 .
In the previous study Priezjev15 , molecular dynamics simulations were carried out to investigate the influence of a local shear transformation on plastic deformation of a three-dimensional model glass. The shear transformation was introduced in a quiescent system via a spherical inclusion that was gradually strained into an ellipsoid and then converted back into the sphere during a finite time interval. It was demonstrated that at strain amplitudes above a few percent, the structural relaxation of the material involved localized plastic events that were identified using the cage detection algorithm BiroliPRL09 . The spatial distribution of clusters of cage jumps and their radial density profiles were studied for various damping conditions and durations of the shear event. Interestingly, it was found that the density profiles of cage jumps are well described by a universal function multiplied by a factor that depends on the friction coefficient and the shear transformation time scale Priezjev15 . It remained unclear, however, how this factor varies with the strain amplitude and whether it can be expressed as a function of a single variable.
In this paper, the plastic response of the amorphous material to a reversible shear transformation is examined over a wide range of damping conditions and oscillation time scales. The analysis of the density profiles of cage jumps presented in the previous study Priezjev15 is extended further to describe the effect of strain amplitude on the profile shape and the dependence of the density maximum on the friction coefficient and oscillation period. In particular, it is demonstrated that, at sufficiently slow transformation rates, the peak value of the density profiles is a function of the ratio of the friction coefficient and the time scale of the shear transformation and that it strongly depends on the strain amplitude.
The rest of the paper is structured as follows. The details of molecular dynamics simulation model are described in the next section. The analysis of the radial density profiles of cage jumps as a function of the time scale of the shear event, friction coefficient, and the strain amplitude is presented in Sec. III. The conclusions are provided in the final section.
II Molecular dynamics (MD) simulations
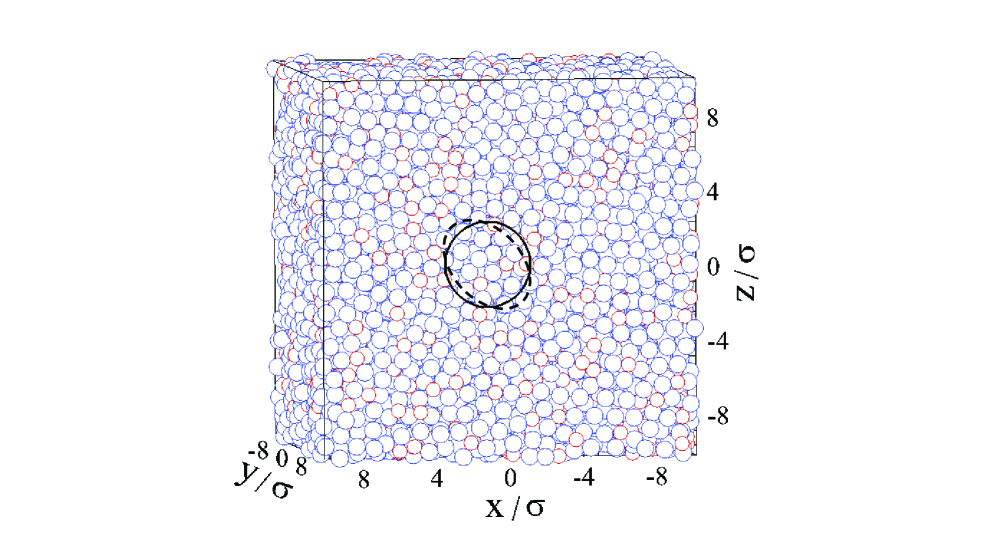
The simulated system consists of particles confined in a three-dimensional cell as shown in Fig. 1. We used a standard model of a glass-forming Lennard-Jones (LJ) binary mixture introduced by Kob and Andersen KobAnd95 . In this model, any two particles interact through the Lennard-Jones (LJ) potential
| (1) |
with the parameters , , , , , and KobAnd95 . The LJ potential is truncated at the cutoff radius Varnik04 . The units of length, mass and energy are chosen , , and , and, consequently, the unit of time is defined . The simulations were performed at a constant density and the linear size of the cubic box is . Periodic boundary conditions were applied along the , , and directions.
The motion of particles is governed by the classical Langevin dynamics. For example, the equation of motion in the direction for the -th particle of mass is given by
| (2) |
where is the friction coefficient and is a random force with zero mean and variance determined by the fluctuation-dissipation theorem Kubo66 . The Langevin temperature is fixed , where is the Boltzmann constant. The equations of motion were integrated numerically using the fifth-order Gear predictor-corrector algorithm Allen87 with a time step . Different realizations of disorder were prepared by quenching the system from the temperature , which is well above KobAnd95 , to the final temperature with the rate of .
We next describe the deformation protocol for the reversible shear transformation. The inclusion atoms were identified within a sphere of radius , which is located at the center of the simulation cell (see Fig. 1). The average number of atoms in the inclusion is about . First, the positions of the inclusion atoms were kept fixed while the system was aged for about at the temperature . The spherical inclusion was gradually strained into an ellipsoid and then converted back into the sphere during the time interval . Note that the major axis of the ellipsoid was oriented along one of the diagonals of the simulation box, and the volume of the inclusion was kept constant during the transformation. In our study, the shear strain is defined as the ratio of the ellipsoid semi-major axis to the sphere radius . The variation of stain as a function of time from zero to is described by the following equation
| (3) |
where is the strain amplitude and is the time scale of the shear event. After the shear transformation, the positions of inclusion atoms were kept fixed at their original positions and the system was allowed to equilibrate for the additional time interval . This time interval is larger than the damping time for the smallest value of the friction coefficient considered in the present study. Several test simulations were performed when the system was equilibrated for a larger time interval of after the shear transformation in order to verify that the results remain unchanged. Finally, the average atom positions were computed before and after the shear transformation and then analyzed in independent samples.
III Results
At mechanical equilibrium, the atomic structure of the model glass shows no long-range order while each atom remains trapped in a cage composed of its neighbors during the time scale of the computer simulation at the studied temperature. The plastic deformation of the amorphous material was induced by a reversible shear transformation of a spherical inclusion and studied at different damping conditions and time scales of the shear event. In our setup, the inclusion atoms were displaced to form an ellipsoid with the major axis parallel to the direction (see Fig. 1) in order to reduce the effect of periodic boundary conditions. It was observed that at sufficiently small strain amplitudes (below a few percent), the system response is elastic and all atoms return to their cages after the shear transformation Puosi14 ; Priezjev15 .
In the present study, the analysis of particle positions was performed in the plastic regime when the strain amplitude was varied in the range . We find that at smaller values of , an accurate analysis of particle displacements requires averaging over larger number of independent systems, while at larger strain amplitudes, the relative distance between inclusion atoms becomes comparable to the molecular diameter, thus creating voids at the surface of the inclusion during the shear transformation process. Irreversible rearrangements of atoms in the material triggered by the shear transformation were identified using the cage detection algorithm BiroliPRL09 . Visual inspection of snapshots of the simulated system revealed that cage jumps tend to aggregate into relatively compact clusters, which are predominantly located near the inclusion where the deformation of the material during the shear transformation is larger Priezjev15 .
It was shown in the previous study Priezjev15 that the clusters of cage jumps are approximately power-law distributed with an exponent that depends on the strain amplitude. In general, it is expected that the density of cage jumps will decay away from the center of the inclusion because the maximum local strain in the material during the reversible shear transformation decreases as a function of the radial distance. For example, the displacement and strain fields were calculated analytically for a spherical inclusion that was strained into an ellipsoid in a two-dimensional plane, while the third direction reminded neutral Procaccia13 . It was shown that in a stationary regime, the strain field has a quadrupolar symmetry and it decays as from the center of the inclusion in three dimensions Procaccia13 .
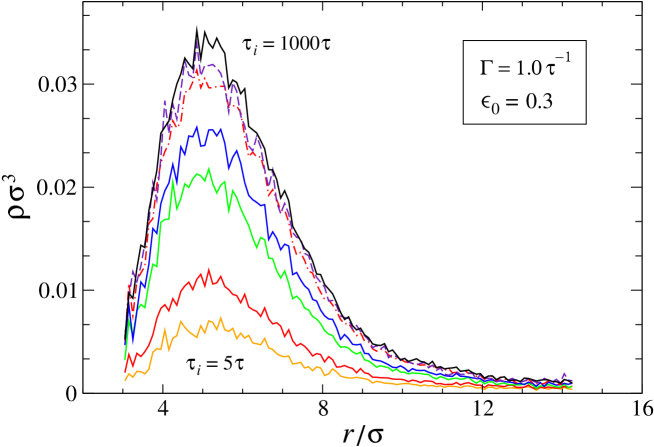
Averaged density profiles of cage jumps as a function of the radial distance from the center of the inclusion are plotted in Fig. 2 for the strain amplitude in the regime of intermediate damping . Several important features are evident. First, the density of cage jumps is reduced within about two atomic diameters from the surface of the inclusion. This effect originates from the reversible motion of the inclusion atoms that effectively form a part of a cage for the neighboring atoms of the material, thus reducing the probability of their irreversible displacements Priezjev15 . Second, the density profiles exhibit a maximum at and then decay with further increasing radial distance. It was previously shown that the rate of decay for correlates well with the local deformation of the material, which was estimated from the relative displacement of neighboring particles after the spherical inclusion was irreversibly strained into an ellipsoid Priezjev15 .
In general, we find that the average density of cage jumps increases with increasing time scale of the shear transformation (e.g., see Fig. 2). At small values of and , the time scale of the shear event is comparable with the time it takes for sound waves to propagate across the system, and thus the probability of formation of large clusters is reduced. In contrast, when , the shear stress from the deforming inclusion can induce larger clusters of cage jumps, which in turn might trigger other irreversible events in the system. In addition, as the damping rate decreases, the effect of inertia becomes more important, leading to larger avalanches during the shear transformation process, and, as a result, larger density of cage jumps. This trend was also identified in sheared disordered solids in the athermal quasistatic limit by examining the critical scaling of avalanches at different damping rates Salerno13 .
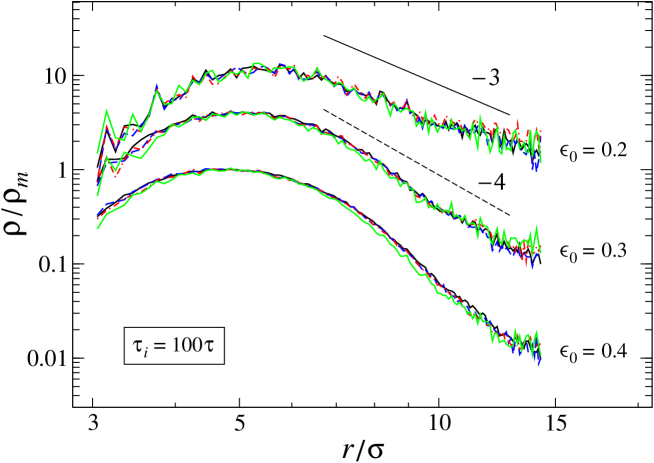
It was further noticed in the previous study Priezjev15 that the density profiles of cage jumps for different values of and can be made to collapse onto a master curve if is divided by a scaling factor. In Fig. 3, we plot the average density profiles normalized by the corresponding density peak for different values of and strain amplitudes , and . It is evident that for each value of the strain amplitude, the rescaled density profiles collapse on the master curves. Note that the data in Fig. 3 for the two lower values and are shifted for clarity. It can be seen that the location of the maximum of and the slope of decay for depend of the strain amplitude. The deviation from the dependence, which describes the decay of the local strain away from an elliptical inclusion Procaccia13 , for larger strain amplitudes and might be due to the finite system size. Remember that at some atoms interact with their neighbors via periodic boundary conditions but the local strain is in general not the same across periodic boundaries during the shear transformation.
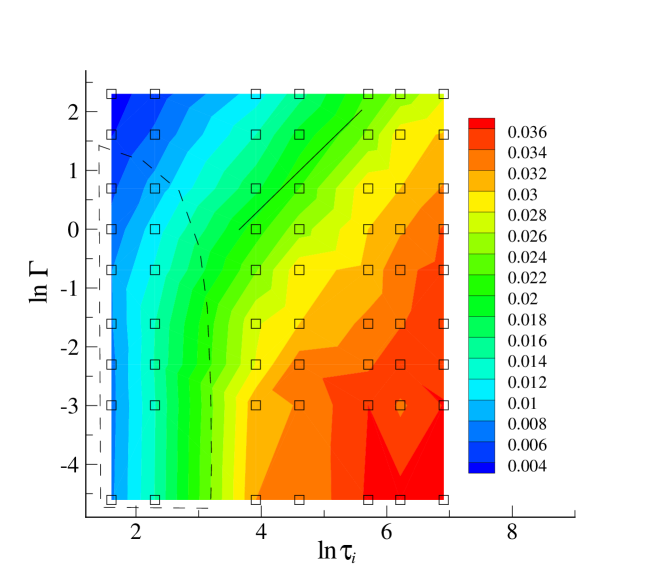
In our study, the maximum of the density profiles of cage jumps was estimated in a wide range of parameter values, i.e., and . Figure 4 shows a contour plot of the density peaks as a function of the friction coefficient and the shear transformation time scale for the strain amplitude . It can be seen that the density landscape is quite complex, but the trends are clear. Namely, at small in the overdamped regime, the deformation of material during the shear transformation is minimal, and thus the density of cage jumps is relatively small. In the opposite limit, when the shear transformation is very slow and the system dynamics is underdamped, the deformation of material is largest, facilitating the formation of large clusters, and the density of cage jumps saturates to a maximum value of about (see Fig. 4).
It can be further observed that the contour lines in Fig. 4 approximately follow a linear dependence between the friction coefficient and the time scale of the shear event (see the straight line with unit slope in Fig. 4). This correlation holds over the whole range of parameters and , except for the data points within the dashed region in Fig. 4. This, in turn, implies that the ratio computed along a contour level will correspond to the same value of the density peak. Therefore, it is expected that the data reported outside of the dashed region in Fig. 4 can be collapsed onto a master curve if replotted as a function of . Another argument for using is that the time dependence of the continuum displacement field after an instantaneous shear transformation in the overdamped regime is roughly proportional to the factor , where is the shear modulus Puosi14 . Therefore, it follows that the local displacement field, which can trigger an irreversible rearrangement of atoms at a distance from an inclusion, depends on the ratio .
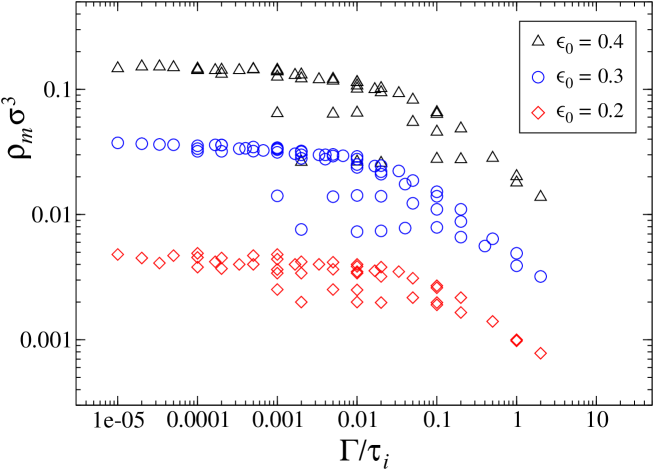
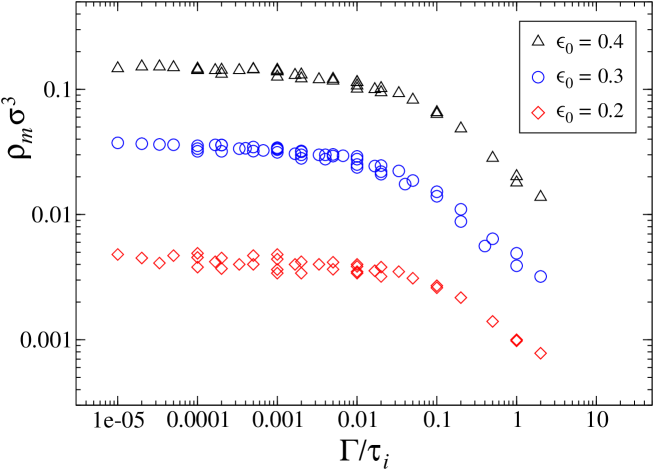
The density peaks of cage jumps are first plotted in Fig. 5 as a function of the ratio for the strain amplitudes , and and the same range of parameter values as in Fig. 4. The collapse of the data on three distinct master curves is satisfactory; however, the data are somewhat scattered at intermediate values of . As anticipated, the scattered data in Fig. 5 were evaluated for the parameters and within the dashed region in Fig. 4. Without these data points, the dependence of the density peaks on the ratio is shown in Fig. 6. It is evident that for , the density peak saturates to a constant value that corresponds to the largest plastic deformation for each strain amplitude. In contrast, with increasing , the density peak gradually crosses over to a power-law decay as a function of . In this regime, the density of cage jumps is reduced due to either small time scale or large friction coefficient.
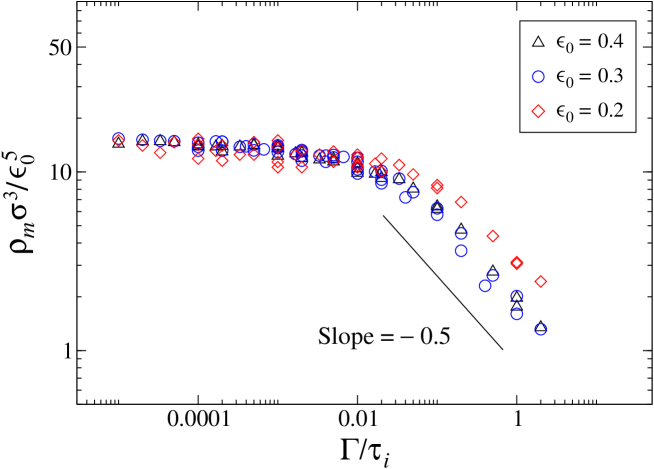
It is apparent that the shape of the curves shown in Fig. 6 is very similar, suggesting that they might be different by a factor that depends on the strain amplitude. Indeed, we found that when the density peaks for each strain amplitude are divided by , the data collapse onto a single master curve (see Fig. 7). The resulting master curve extends over about five orders of magnitude in . Notice that the slope of the decay at depends slightly on the strain amplitude. The existence of the plateau in Fig. 7 implies that the largest value of can be obtained in the limiting case of a very slow shear transformation for any damping conditions, i.e., when . The significance of the value for the exponent is at present not clear. We note, however, that the exponent was estimated based only on three data points for and the critical value of the strain amplitude that marks the onset of irreversible deformation was not determined in our study. The relatively strong dependence of on the strain amplitude might be due the quadrupolar symmetry of the strain field that can trigger increasingly large clusters of cage jumps around the inclusion upon increasing strain amplitude.
IV Conclusions
In this paper, we have examined the structural relaxation in a three-dimensional amorphous material induced by a reversible shear transformation using molecular dynamics simulations. The material was deformed by straining a spherical inclusion into an ellipsoid of the same volume and then converting it back into the sphere. We found that at sufficiently large strain amplitude of the shear transformation, some particles undergo irreversible displacements that were identified using the cage detection algorithm. The density profiles of cage jumps exhibit a distinct maximum near the surface of the inclusion followed by a power-law decay as a function of the radial distance. At a given strain amplitude, the density profiles are self-similar when scaled by the density maximum, which in turn depends on the damping rate and duration of the shear transformation. Moreover, it was demonstrated that the data for the peak value of the density profiles can be collapsed onto a master curve when plotted as a function of the ratio of the friction coefficient and the oscillation period. Overall, these findings indicate that the density of cage jumps around the inclusion becomes larger in the cases of weakly damped dynamics or slow shear transformation.
Acknowledgments
Financial support from the National Science Foundation (CBET-1033662) is gratefully acknowledged. Computational work in support of this research was performed at Michigan State University’s High Performance Computing Facility and the Ohio Supercomputer Center.
References
- (1) C. A. Schuh, T. C. Hufnagel, U. Ramamurty, Acta Materialia 55, 4067 (2007).
- (2) A. S. Argon, Acta Metall. 27, 47 (1979).
- (3) M. L. Falk and J. S. Langer, Annu. Rev. Condens. Matter Phys. 2, 353 (2011).
- (4) D. Rodney, A. Tanguy, and D. Vandembroucq, Modelling Simul. Mater. Sci. Eng. 19, 083001 (2011).
- (5) D. J. Lacks and M. J. Osborne, Phys. Rev. Lett. 93, 255501 (2004).
- (6) K. M. Salerno and M. O. Robbins, Phys. Rev. E 88, 062206 (2013).
- (7) A. Lemaitre and C. Caroli, Phys. Rev. Lett. 103, 065501 (2009).
- (8) D. Fiocco, G. Foffi, and S. Sastry, Phys. Rev. E 88, 020301(R) (2013).
- (9) N. V. Priezjev, Phys. Rev. E 87, 052302 (2013).
- (10) I. Regev, T. Lookman, and C. Reichhardt, Phys. Rev. E 88, 062401 (2013).
- (11) N. V. Priezjev, Phys. Rev. E 89, 012601 (2014).
- (12) M. Mailman, M. Harrington, M. Girvan, and W. Losert, Phys. Rev. Lett. 112, 228001 (2014).
- (13) N. Perchikov and E. Bouchbinder, Phys. Rev. E 89, 062307 (2014).
- (14) N. C. Keim and P. E. Arratia, Phys. Rev. Lett. 112, 028302 (2014).
- (15) K. E. Jensen, D. A. Weitz, and F. Spaepen, Phys. Rev. E 90, 042305 (2014).
- (16) E. D. Knowlton, D. J. Pine, and L. Cipelletti, Soft Matter 10, 6931 (2014).
- (17) M. C. Rogers, K. Chen, L. Andrzejewski, S. Narayanan, S. Ramakrishnan, R. L. Leheny, and J. L. Harden, Phys. Rev. E 90, 062310 (2014).
- (18) N. C. Keim and P. E. Arratia, Soft Matter 11, 1539 (2015).
- (19) F. Puosi, J. Rottler, and J.-L. Barrat, Phys. Rev. E 89, 042302 (2014).
- (20) A. Nicolas, F. Puosi, H. Mizuno, and J.-L. Barrat, J. Mech. Phys. Solids 78, 333 (2015).
- (21) J. D. Eshelby, Proc. Roy. Soc. London A 241, 376 (1957).
- (22) N. V. Priezjev, Phys. Rev. E 91, 032412 (2015).
- (23) R. Candelier, O. Dauchot, and G. Biroli, Phys. Rev. Lett. 102, 088001 (2009).
- (24) W. Kob and H. C. Andersen, Phys. Rev. E 51, 4626 (1995).
- (25) F. Varnik, L. Bocquet and J.-L. Barrat, J. Chem. Phys. 120, 2788 (2004).
- (26) R. Kubo, Rep. Prog. Phys. 29, 255 (1966).
- (27) M. P. Allen and D. J. Tildesley, Computer Simulation of Liquids (Clarendon, Oxford, 1987).
- (28) R. Dasgupta, O. Gendelman, P. Mishra, I. Procaccia, and C. A. B. Z. Shor, Phys. Rev. E 88, 032401 (2013).